Week-4 Challenge WOT Condition Part-2
Objective:
- What is the difference between mapped and dynamic model of engine, motor and generator? How can you change model type?
- How does the model calculate miles per gallon? Which factors are considered to model fuel flow?
- Run the HEV ReferenceApplication with WOT drive cycle. Change the grade and wind velocity in the environment block. Comment on the results.
- Keeping all other parameters same, compare the simulated results of hybrid and pure electric powertrains.
1.What is the difference between mapped and dynamic model of engine, motor and generator? How can you change model type?
Mapped model
This type of model uses a set of steady-state lookup tables to characterize engine,motor and generator performance. The tables provide overall engine ,motor and generator characteristics. For example for an engine, actual torque, fuel flow rate, BSFC, and engine-out exhaust emissions. It is used when we have experimental data already available. Also it is used for quasi steady-state simulations.
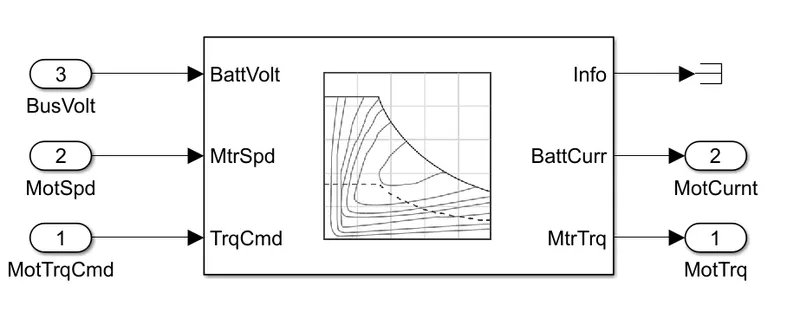
Figure-1 Mapped motor
Dynamic model
From the name itself, it means that this type of model is used when time dependent simulations are performed and results are required. It is used when we have component level data available. It decomposes the behavior into characteristics that are separated into lower level components and by combining components in this way, the models capture the dynamic effects.
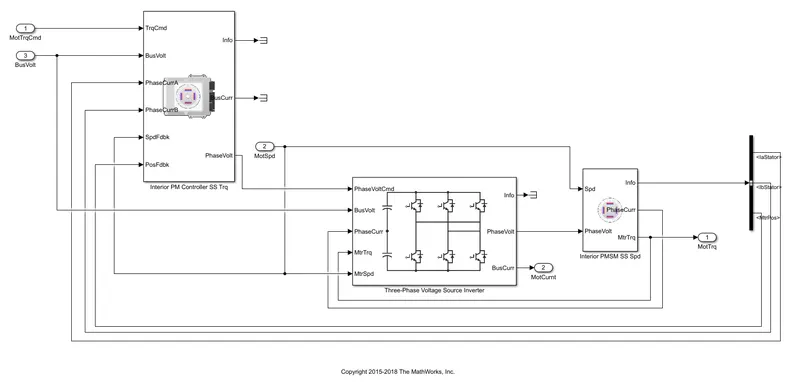
Figure-2 Dynamic motor
Changing model type: Go to the electric or engine plant of the passenger car block. Go to the parameter of choice (ex:motor), right click and go to variant and choose label mode active choice. Finally choode between dynamic and Mapped configuration.
2. How does the model calculate miles per gallon? Which factors are considered to model fuel flow?
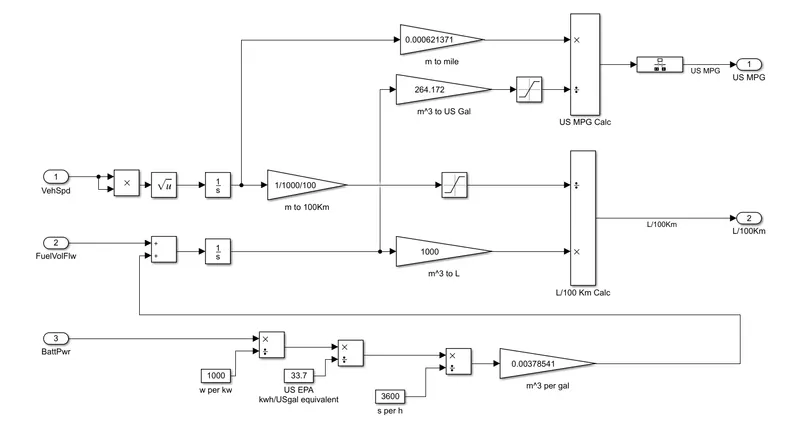
Figure-3 Miles per gallon calculations for HEV
From Figure-3, we observe that distance travelled is calculated by integrating the vehicle speed. To convert the units from m to Km and then further to miles, rest of the constants are multiplied or devided. For a hybrid electric vehicle, Fuel consumed is calculated using Fuel volume flow and battery power used. To convert Batter KW to gal/hr, Value is devided by 33.7, and later is converted to m^3/s. Integrating this gives the Volume in m^3 whic can further be converted to gallons. In case of fuel, direct integration of fluid volume flow gives the volume of fuel used.
Factors considered to model fuel flow are Battery power and Vehicle speed.
3. Run the HEV ReferenceApplication with WOT drive cycle. Change the grade and wind velocity in the environment block. Comment on the results.
- Go to help and write Powertrain blockset. Go to Get start with powertrain blockset and choose Explore hybrid electric vehicle multimode reference application. Load the simulink model.
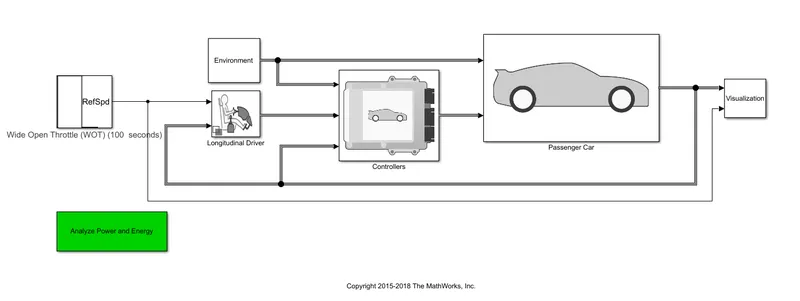
Figure- HEV Powertrain blockset
- As it is a Wide open throttle model, change the drive cycle to WOT and change the parametrs accordingly.
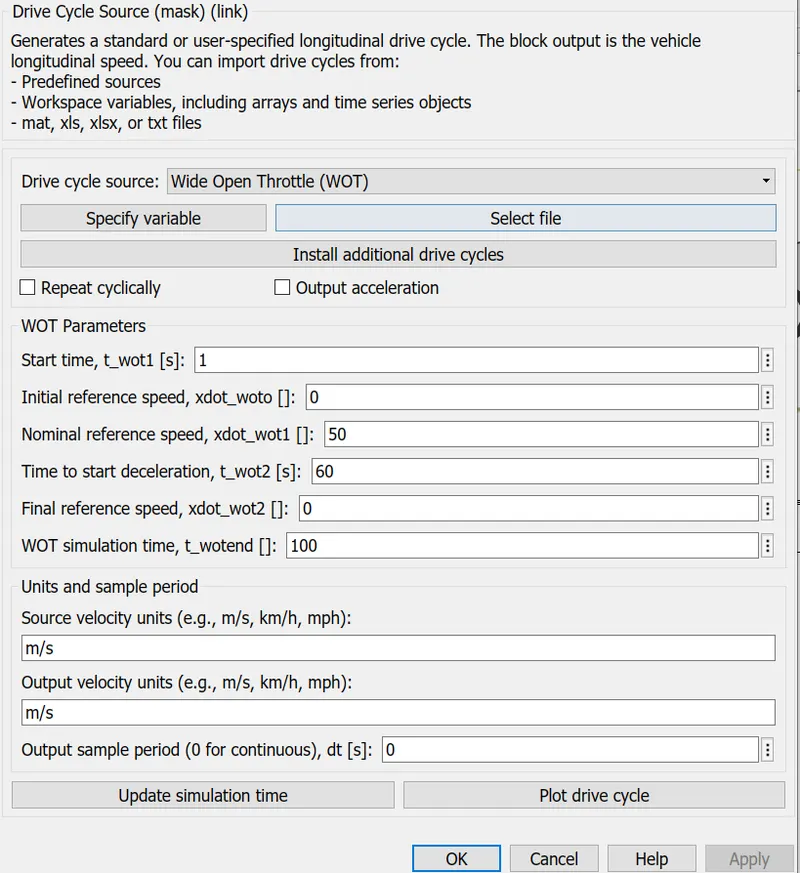
Figure-4 Drive cycle
- Now we need to change the Grade and Wind velocity in the Environment block and comment on the results therefore go to environment block and change the parameters.
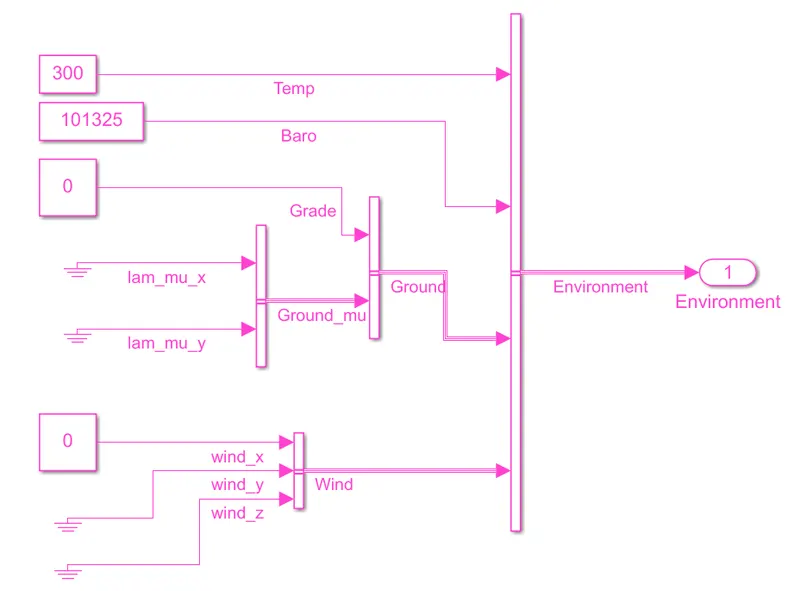
Figure-5 Environment block
Case-1 Grade and Wind velocity kept 0
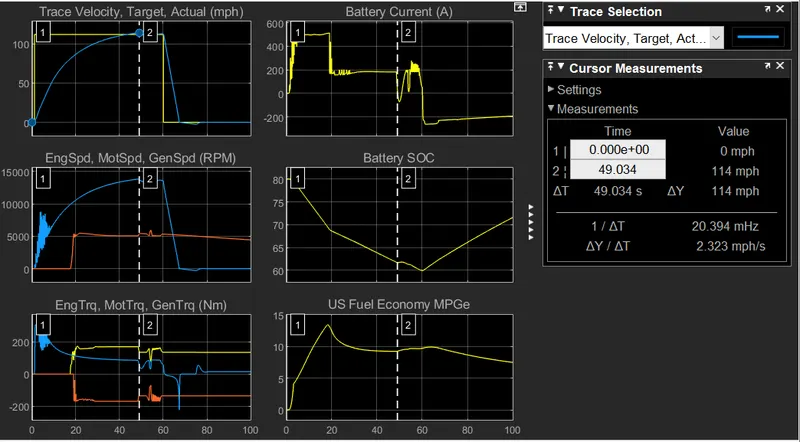
Figure-6 Acceleration time
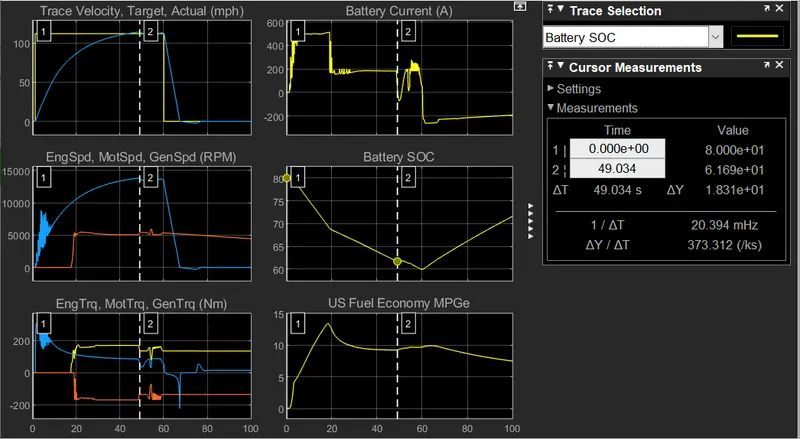
Figure-7 Battery State of Charge
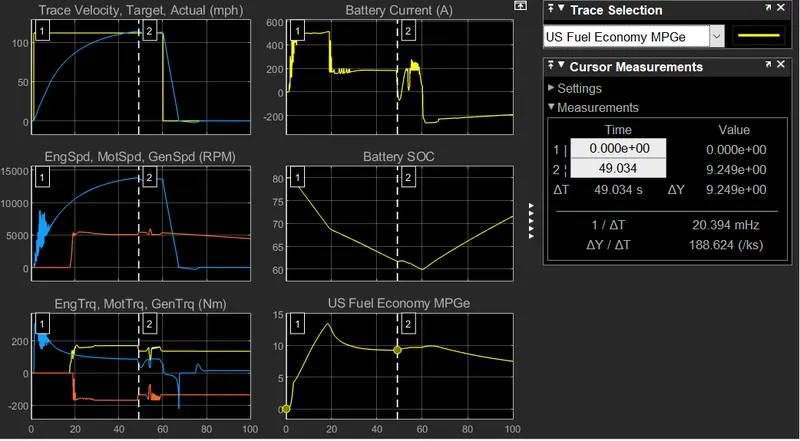
Figure-8 Fuel economy Miles per gallons
Case-2 Keeping grade angle 10 and Wind velocity 0
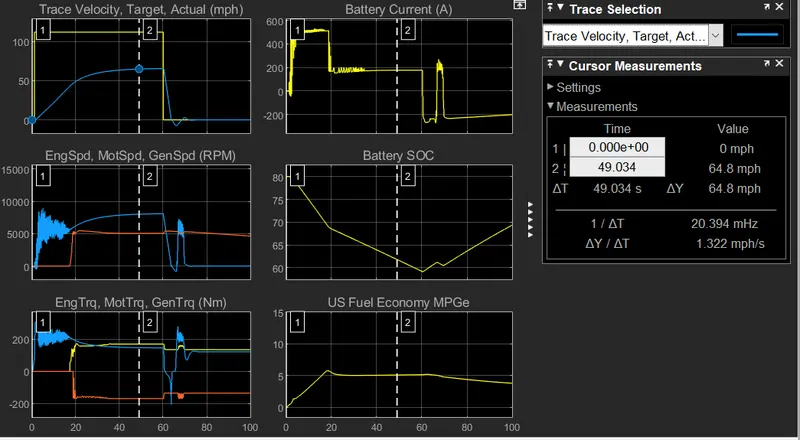
Figure-9 Acceleration time
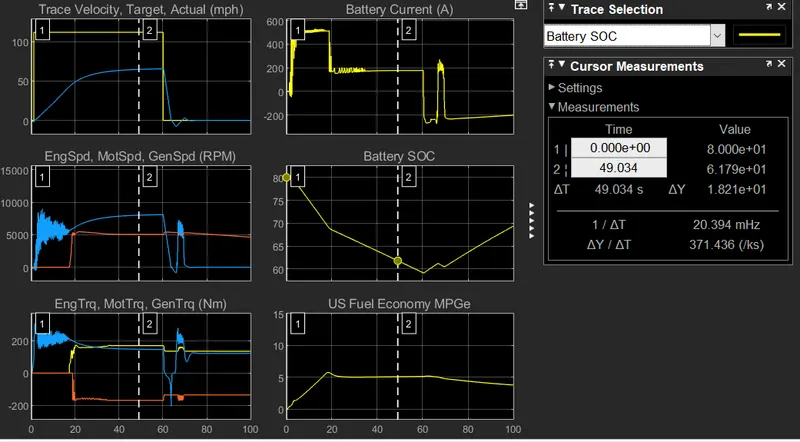
Figure-10 Battery State of Charge
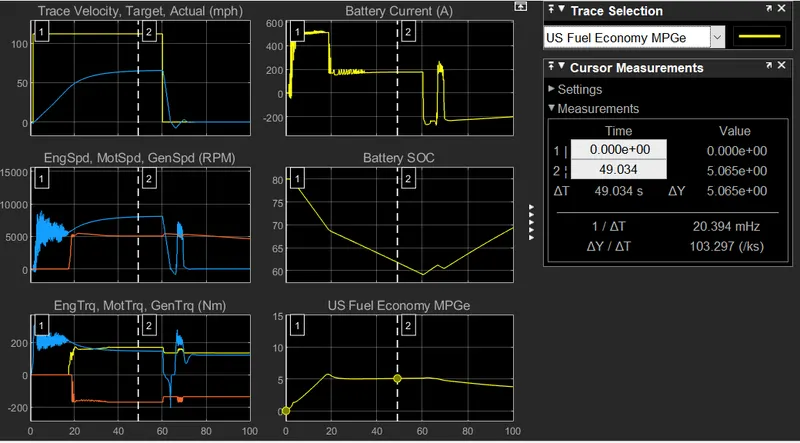
Figure-11 Fuel economy Miles per gallons
Case-3 Keeping grade angle 10 and Wind velocity 20
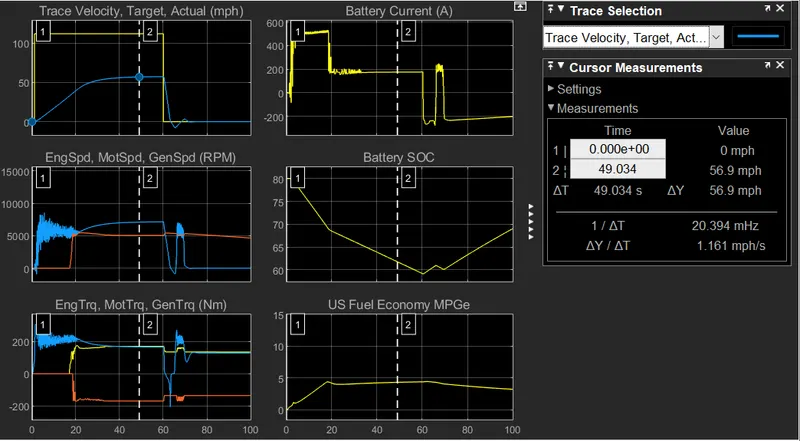
Figure-12 Acceleration time
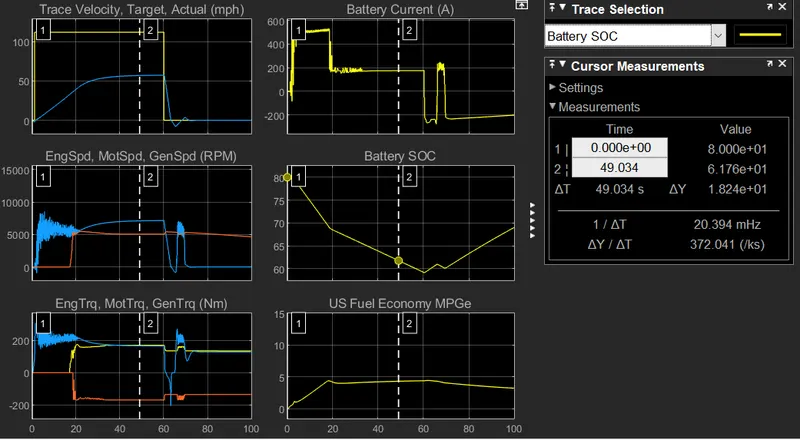
Figure-13 Battery State of Charge
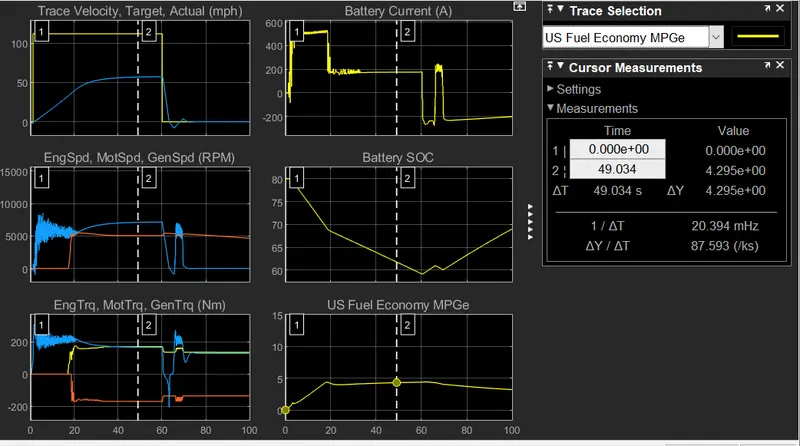
Figure-14 Fuel economy Miles per gallons
Conclusion:
- When the grade and wind velocity are kept 0, Acceleration time of 49 sec is observed and top speed of 114 mph is observed. When the grade is kept at 10 degrees, for the same acceleration time, top speed observed is 64.8 mph. When the grade is kept at 10 degrees and wind velocity is also applied equal to 20 m/s, top speed decreased to 56.9 mph. Hence top speed decreased with increase in grade and wind velocity.
- Battery SOC remains same for all the cases.
- With increase in grade and wind velocity, miles per gallon also decreased.
4. Keeping all other parameters same, compare the simulated results of hybrid and pure electric powertrains.
- Case-1 Electric vehicle with grade and wind velocity 0
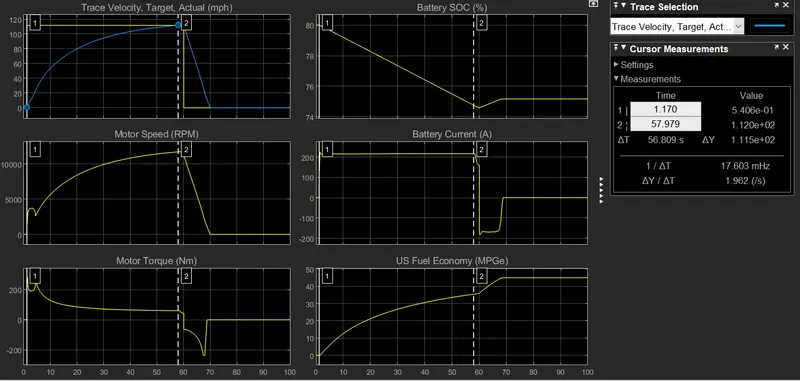
Figure-15 Acceleration time for EV
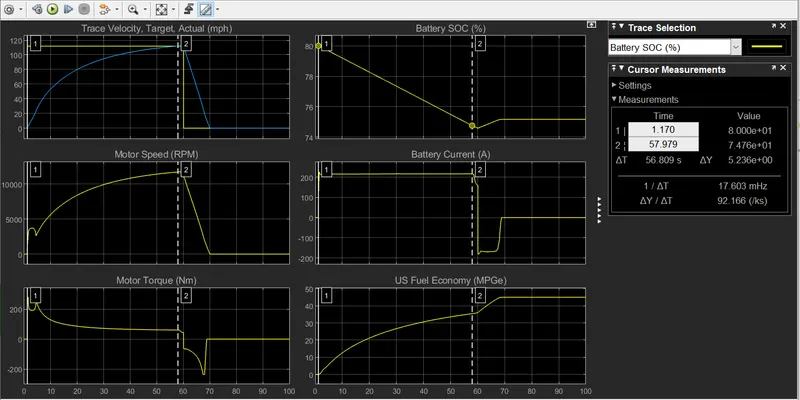
Figure-16 Battery SOC for Ev
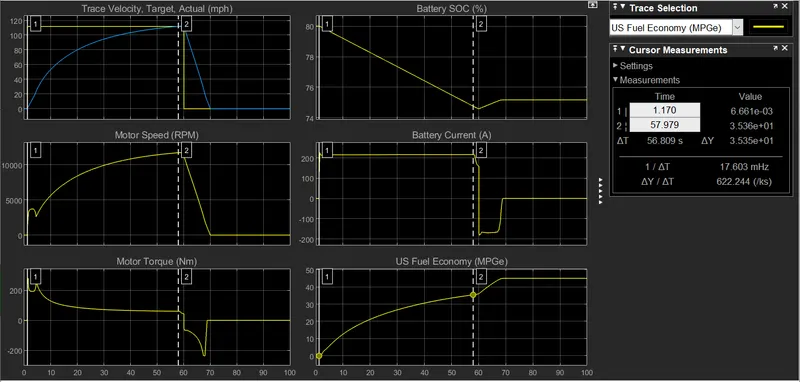
Figure-17 Fuel economy for Ev
- Case-2 Hybrid Electric vehicle with grade and wind velocity 0
Figure-18 Acceleration time for HEV
Figure-19 Battery SOC for HEV
Figure-20 Fuel economy for HEV
Conclusion:
- Better fuel economy is observed in case of EV for obvious reasons (It is fully working on Electric propulsion, whereas Hybris electric vehicle has fuel propulsion as well).
- Battery SOC decreased more for HEV case because of more weight of the vehicle (considering both HEV and EV working in electric propulsion domain).
- More top speed and less acceleration time is observed in HEV.