Project 2 - Supply and Demand Gap Analysis
UBER SUPPLY AND DEMAND ANALYSIS
Aim: To analyze the Uber Demand and Supply gap and creating a dashboard to visualize the data with respective to the fields.
Introduction: Uber is a transportation company with an app that allows passengers to hail a ride and drivers to charge fares and get paid. More specifically, Uber is a ridesharing company that hires independent contractors as drivers. It's one of many services today that contribute to the sharing economy, supplying a means of connecting existing resources instead of providing the physical resources themselves.
Uber provides its services through mobile applications. The current dataset taken has the details for five days in the month of July of 2016. We will use dataset from the Uber to create visualizations and analyze the data which is given for five days in the month of July of 2016. The main objective of this project is to analyze the data set and give recommendations based on our findings.
Problem statement: In this analysis, we find out the performance of uber and how many Drivers are present, how many trips are completed, and how many trips are cancelled also find out the availability/unavailability of the cab.
Methodology:
Importing the data:
First, we import the data and here we have data in the csv format.
Open the PowerBI desktop and click on Get Data to import the csv file and load the data.
Data Cleaning:
After importing data, there are 6745 rows and 6 columns. We need to clean the data with the help of Power Query Editor.
To open the Power Query Editor by clicking on Transform Data under the Home tab and go to Power Query Editor.
In Power Query Editor, go to the View tab, enable Column Distribution, Column Quality and Column Profile. It will help you to find out missing values, any data errors, any data type mismatch, any outliers.
Data Visualization:
I have used Power BI tool to visualize the data available to gain meaningful insights and better understand the dataset. I have used different visualizations like bar graphs and line graphs which are available in the tool. Additionally, it also provides tools to filter data by a variety of variables, such as geographic region and time, to provide a more granular look at the data.
Analysis:
Now we will see all the columns in the data.
Driver id: The unique id of the driver
Drop timestamp: The drop-off date and time in case the trip was completed.
Pick-up point: The point from which the request was made either airport or city.
Request id: A unique id of the request
Request timestamp: The date and time at which the customer made the trip request.
Status: Status of the trip (Completed, No cars Found, Cancelled).
Now we will see the visualizations in the for some of the data,
The card visualization has been used to show different numeric values like Driver Count, No of Requests.
The Slicer is added for Pickup point and Hours in a day and Year.
Similarly, Bar graphs, Line graphs, Pie and Donut Charts
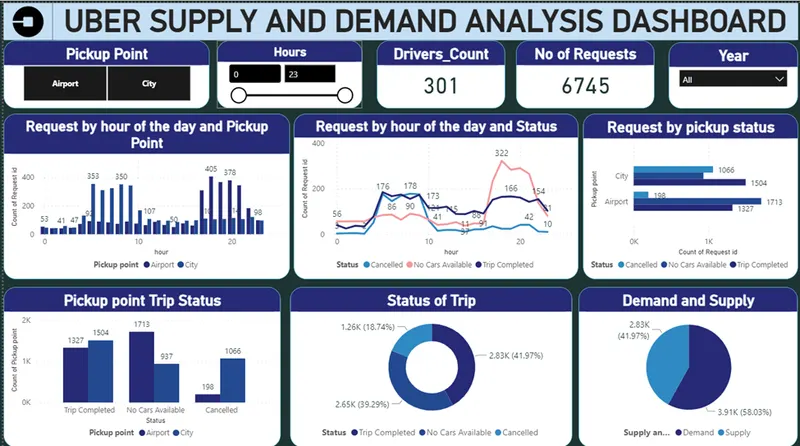
- There are 2 Pickup Points (Airport and City)
- There are total 301 Drivers and 6745 requests.
- The slicer contains Pickup Points, Date, and the Hour of the day data.
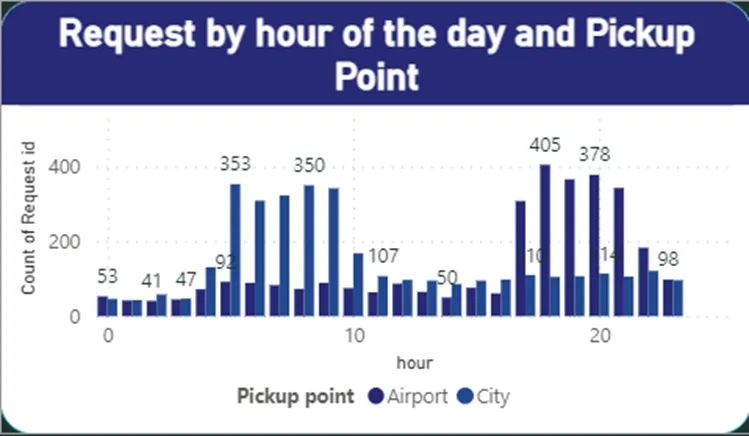
- From the below graph we can say from Morning 5:00 am to 10:00 am is the peak time with demand at the city level. Similarly, we can see from Evening 5:00 pm to 10:00 pm is the peak time with demand at the airport.
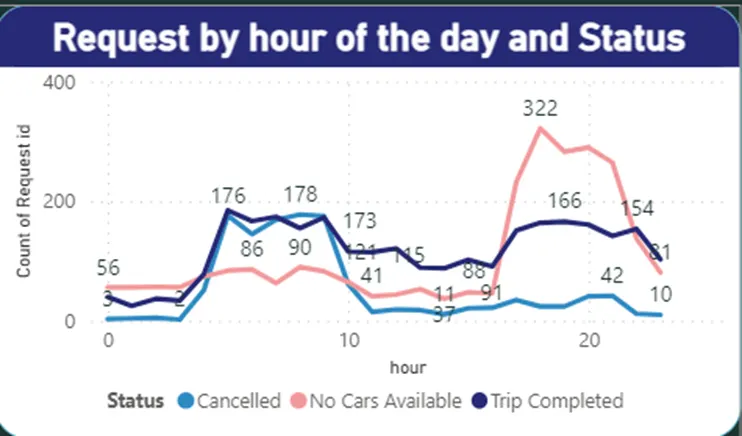
- From the below graph we can see that at the Peak time in the evening 5:00 pm to 10:00 pm there are no cars available, and more cancellation is at morning 5:00 am to 10:00 am.
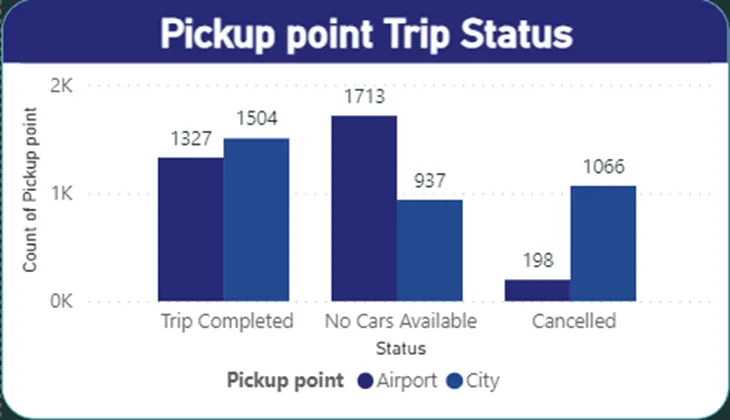
- From the below graph request pickup status and No cars available at the Airport when compared to cancelled and completed.
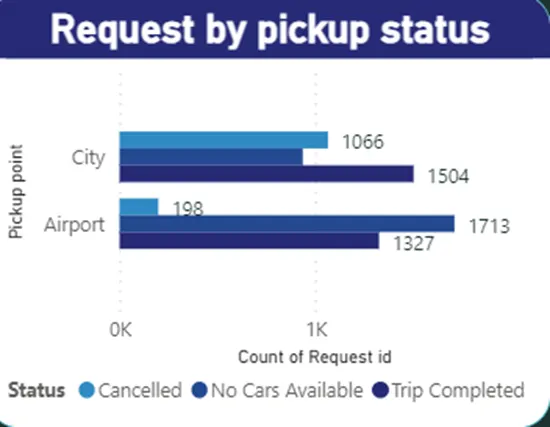
- From the below graph we can say more cancellation are done at city and No cars available more at Airport.
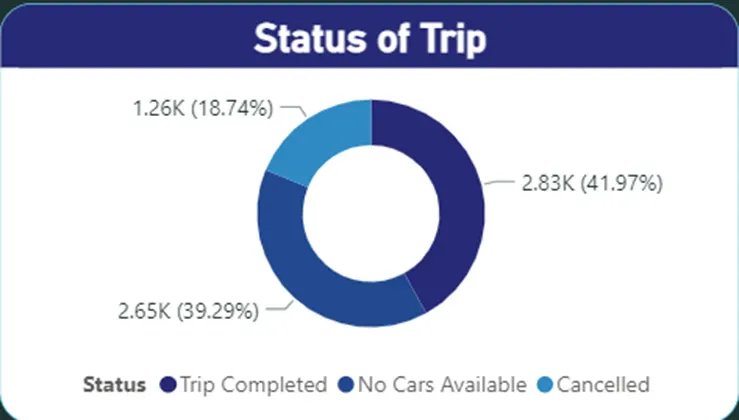
- From the below donut chart we can say 41.97 % trips are successfully completed and remaining 58.03% (No cars Available and Cancellation).
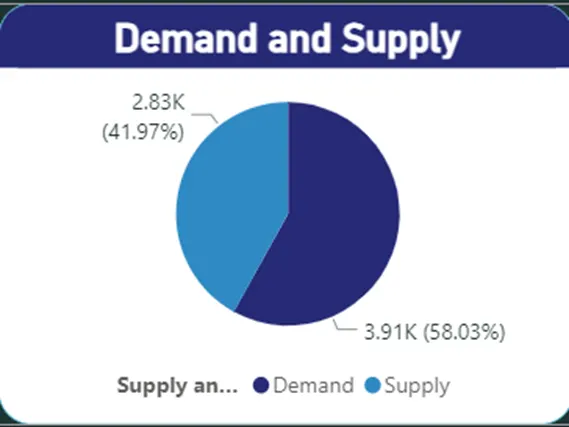
- In below Pie chart, we combine the data of No car available and Cancellation, so that we can see how much demand and supply is there.
Insights:
- All these factors lead to high cancellation rate for trips from City to Airport.
- We observed that in the Peak Evening Slot where the demand for Airport to City trips is high, there are maximum number of “No Cars Available” leading to great Gap in the Demand & Supply.
- This is because by the night, a lot of flights including the international ones start arriving at the airport. This creates a high demand for cars. Also, the Uber driver partners start retiring for the day as the dawn proceeds leading to a high non availability of the cars.
- These factors lead to high “No Cars Available” issue for trips from Airport to City.
- Here we notice that there is a spike in cancellations from 6 am to 9 am for requests from City. The reason may be due to the heavy traffic due to working hours at that time and drivers are cancelling.
Recommendations:
- Expand your service area: If you see a lack of available cabs in the Airport area after 4 PM, you may want to consider expanding your service area to include more nearby neighborhoods or areas where you can recruit more drivers. This could help to increase the number of cabs available to meet demand.
- Increase the number of drivers on the road during peak demand times: By having more drivers available during the times when demand is highest, you may be able to reduce the number of cancellations and increase the number of completed trips.
- Improve the driver experience: If drivers are cancelling trips due to heavy traffic or other issues, you may be able to improve the driver experience by providing them with tools or resources to help them navigate more efficiently or by offering additional support.
Conclusions:
The Uber supply and demand gap is an ongoing problem that needs to be addressed to ensure that the company continues to be successful. However, the gap is unlikely to be closed completely, and Uber will need to continue to develop strategies to bridge the gap between supply and demand.
Going forward, it will be important to carefully consider these recommendations and determine which ones are most appropriate and feasible for the business.