Project 2 - Rankine cycle Simulator
Objective:
- Create a Rankine Cycle Simulator using OCTAVE/MATLAB.
- Code should calculate the state points of the Rankine Cycle.
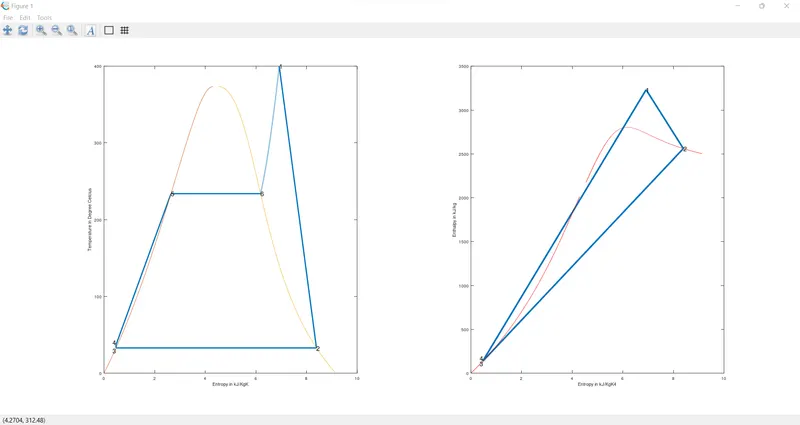
- Plot the corresponding T-s and h-s plots for the given set of inputs. Title and axes labels are a must, while legends could be used if necessary
Input:
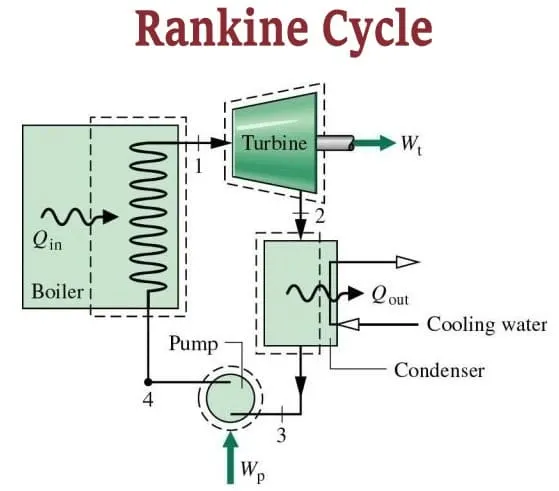
The Rankine cycle, also known as Rankine vapour cycle is a thermodynamic cycle that converts heat into mechanical energy. Steam based Rankine cycles are responsible for the majority of electric power generation in the world today. A system that uses the Rankine cycle has four parts: a pump, a boiler, a turbine and a condenser. The pump's job is to deliver liquid to the boiler. The boiler's job is to heat the liquid and turn it to vapor. The vapor is then used to power a turbine. The turbine's job is to transform the energy created by the heated fluid into usable energy. The vaporized liquid is then cooled back to liquid state in the condenser. The pump pressurizes the liquid in the condenser and the cycle continues.
Asking for input:
For the problem, we need to provide inputs. The inputs given by the probelm are:
Turbine Inlet temperature = 400° C
Turbine Inlet Pressure = 30 bars
Turbine Outlet Pressure = 0.05 bars = Condenser Inlet Pressure
Input code:
%Rankine Cycle

close all
clear all
clc

% Print Process Description
printf('1-2 Isobaric heat Transfer\n')
printf('2-3 Isentropic Expansion\n')
printf('3-4 Isobaric heat Rejection\n')
printf('4-1 Isentropic Compression\n')

%Enter Inputs
p1 = input('Enter the Pressure at the Turbine Inlet (in bar):');
T1 = input('Enter the Temperature at the Turbineinlet (in Degree Celcius):');
p2 = input('Enter the Pressure at the Condensor (in bar):');
Explanation:
The states of the rankinke cycle is shown on the command window using the printf() function. The syntax for the function is:
printf('display_string')
The values are inputed into the program using the input() funtion. The syntax for the function is:
var = input('display_string')
Calculation of state points:
The state points are calculated using the formulals. The values are taken from the 'XSteam' file. Values for Enthalpy & Entropy are extracted as a function of Pressure & Temperature. h_pT, s_pT, hL_p, sV_p etc.... are the default variables whose value is stored in XSteam file. Similarly, all the variables for all states are extracted using a suitable format.[**The Formulae for the State Variables and other depending factors are referred from Power Plant Reference Books.] Pressure, Temperature, Enthalpy, Entropy for all the State Variables are Extracted as a function of the dependent variable from the XSteam File.
State-1:(1-2 Isobaric heat Transfer)
Theory:
Turbine (1-2): Superheated steam enters into the Turbine and expands isentropically resulting in the production of work. The shaft of the turbine is connected to the generator. This results in the production of electricity i.e Mechanical energy gets converted into electric energy.
Input code:
%Calculate each state point values.

% state point 1
h1 = XSteam('h_pt',p1,T1);
s1 = XSteam('s_pt',p1,T1);
Explanation:
The Enthalpy and entropy are extracted from the XSteam file using the presuure and temperature values.
State-2:(2-3 Isentropic Expansion)
Theory:
Condenser (2-3): The expanded vapour is then passed through a condenser, where it gets condensed and converts into liquid again. This liquid is again pumped to the boiler.
Input code:
%state point 2
s2=s1;
sf2 = XSteam('sL_p',p2);
sg2 = XSteam('sV_p',p2);
hf2 = XSteam('hL_p',p2);
hg2 = XSteam('hV_p',p2);   %x2 = (s2-sf2)/(sg2-sf2);
s2 = sg2;
h2 = hg2;                  %hf2 +(x2*(hg2-hf2));
T2=XSteam('T_hs',h2,s2);
Explanation:
The Entropy and enthalpy of the steam at fluid state and gaseous state are extracted from the XSteam file.
State-3:(3-4 Isobaric heat Rejection)
Theory:
Pump (3-4): The water enters into the pump in a saturated state. Then the liquid is compressed isentropically until it meets the boiler pressure.
Input code:
%state point 3
T3=T2;
p3= p2;
s3=XSteam('sL_T',T3);
h3=XSteam('hL_T',T3);
v3 = XSteam('vL_p',p2);
Explanation:
The Enthalpy, entropy and volume are extracted from the XSteam file using the temperature and pressure values.
State-4:(4-1 Isentropic Compression)
Theory:
Boiler (4-1): The water enters into the boiler as compressed and leaves as superheated from the boiler. Thus the phase changes from liquid to vapour.
Input code:
%state point 4
p4 =p1;
s4= s3;
Cp4 = XSteam('Cp_ps',p4,s4);
Cv4 = XSteam('Cv_ps',p4,s4);
gamma = Cp4/Cv4;
r = (gamma - 1)/gamma;
T4 = T3 *(p4/p3)^r;
Explanation:
The Entropy and enthalpy of the steam at fluid state and gaseous state are extracted from the XSteam file.
Calculation of the output values:
Theory:
Work produced by the turbine,
`W_T=m(h1−h2)K`
Heat rejected by the condenser,
`Q_r=m(h2−h3)K`
Work done by the pump,
`W_P=m(h3−h4)K`
Heat supplied by the boiler is,
`Q_b=m(h1−h4)K`
Net work done by the cycle:
`W_(nt) = W_T - W_P`
Efficiency of the system,
`N_(per) = (W_(nt)/Q_s)*100;`
Steam rate per second,
`steam rate = 3600/(W_T - W_P)`
Input code:
%Calculate output values.

% Turbine Work
Wt = h1-h2;

% Pump Work
Wp = v3*(p1-p2)*100;
h4 = Wp + h3;

% Net Work unit in kj/kg
W_net = Wt-Wp;

%heat supplied
Qs = h1 - h4;

%Efficiency
N_per = (W_net/Qs)*100;

%Steam rate per second
steam_rate = 3600/(Wt - Wp);
Explanation:
The output values are calculated using the formulea and the values extracted from the file.
Calculation of the stem values(Tsat):
Theory:
To plot the Saturation Curve, a Temperature range is defined using linspace command and for the overall length of this Temperature values of Enthalpy and Entropy are calculated at every temperature point. The Break in the Saturation Curve separates the Liquid Phase & Vapour Phase
Input code:
%state point 5 and 6 which help in plotting
T5=XSteam('Tsat_p',p1);
T6=T5;
s5=XSteam('sL_p',p1);
s6=XSteam('sV_p',p1);
h5=XSteam('hL_p',p1);
h6=XSteam('hV_p',p1);
Explanation:
The entropy and enthalpy values of liquid and vapour points are extracted from the XSteam file.
Print the resuts:
Theory:
The output values are displayed on the command window.
Input code:
%print all state point values to show.
printf('\n------------------RESULT------------------\n')
printf('At State point 1:\nP1 is : %4.2f Bar\nT1 is : %4.2f Degree Celcius\nH1 is : %4.2f kJ/kg\nS1 is : %4.2f kJ/kgk\n\n',p1,T1,h1,s1)
printf('At State point 2:\nP2 is : %4.2f Bar\nT2 is : %4.2f Degree Celcius\nH2 is : %4.2f kJ/kg\nS2 is : %4.2f kJ/kgk\n\n',p2,T2,h2,s2)
printf('At State point 3:\nP3 is : %4.2f Bar\nT3 is : %4.2f Degree Celcius\nH3 is : %4.2f kJ/kg\nS3 is : %4.2f kJ/kgk\n\n',p3,T3,h3,s3)
printf('At State point 4:\nP4 is : %4.2f Bar\nT4 is : %4.2f Degree Celcius\nH4 is : %4.2f kJ/kg\nS4 is : %4.2f kJ/kgk\n\n',p4,T4,h4,s4)
printf('Wt is :%4.2f kJ/kg\nWp is : %4.2f kJ/kg\nWnet is : %4.2f kJ/kg\nNtherm is : %4.2f percent\nS.S.C is : %4.2f kg/kWh',Wt,Wp,W_net,N_per,steam_rate)
Explanation:
The values are displayed on the command window using the printf() function.
Plot the graphs:
Theory:
The plot of the rankine cycle is plotted by the Octave.
Input code:
%plot T-S Diagram
subplot(1,2,1)
T_rankine = linspace(T5,T1,5000);
for i = 1:length(T_rankine)
       s_rankine(i) = XSteam('s_pT',p1,T_rankine(i));
end
plot([s1 s2 s3 s4 s5 s6 s_rankine],[T1 T2 T3 T4 T5 T6 T_rankine],'linewidth',1.5);
hold on
T_curve = linspace(1,400,500);
for i=1:length(T_curve)
    s_l(i) = XSteam('sL_T',T_curve(i));
    s_v(i) = XSteam('sV_T',T_curve(i));
    h_l(i) = XSteam('hL_T',T_curve(i));
    h_v(i) = XSteam('hV_T',T_curve(i));
end
plot(s_l,T_curve);
plot(s_v,T_curve);
text(s1,T1,'1','FontSize',15)
text(s2,T2,'2','FontSize',15)
text(s3,T3,'3','FontSize',15,'HorizontalAlignment','right','VerticalAlignment','top')
text(s4,T4,'4','FontSize',15,'HorizontalAlignment','right','VerticalAlignment','bottom')
text(s5,T5,'5','FontSize',15)
text(s6,T6,'6','FontSize',15)
xlabel('Entropy in kJ/KgK');
ylabel('Temperature in Degree Celcius');

%plot H-S diagram
subplot(1,2,2)
plot([s1 s2 s3 s4 s1],[h1 h2 h3 h4 h1],'linewidth',2)
hold on
plot(s_v,h_v,'color','r')
plot(s_l,h_l,'color','r')
text(s1,h1,'1','FontSize',15)
text(s2,h2,'2','FontSize',15)
text(s3,h3,'3','FontSize',15,'HorizontalAlignment','right','VerticalAlignment','top')
text(s4,h4,'4','FontSize',15,'HorizontalAlignment','right','VerticalAlignment','bottom')
xlabel('Entropy in kJ/KgK4')
ylabel('Enthalpy in kJ/kg')
Explanation:
The subplot() function is used to have more than one plots in on figure window. The syntax for the subplot() function is:
subplot(row_number,coloumn_number, total_number_of_plots)
The graph is plotted using the plot() function.The syntax for the plot() function is:
plot(x_val,y_val)
xlabel('x-title')
ylabel('y-title')
text(x_co-ordinate,y_co-ordinate,"text")
Output:
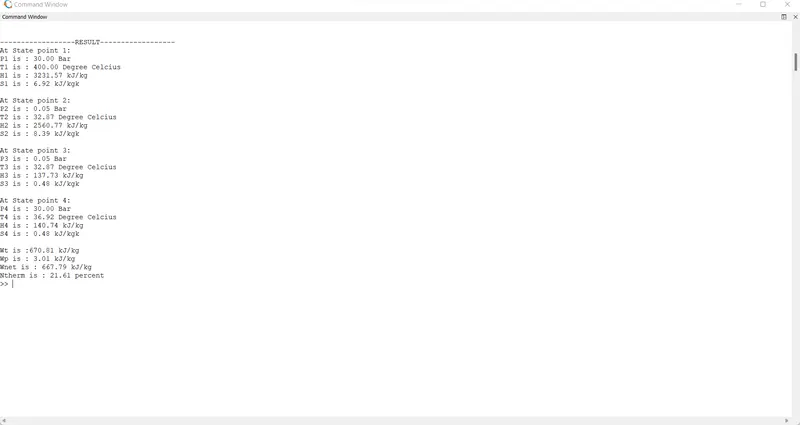
The Rankine cycle plots have generated by calculating the state points, efficiency and the output is printed in the command window.
Command window:
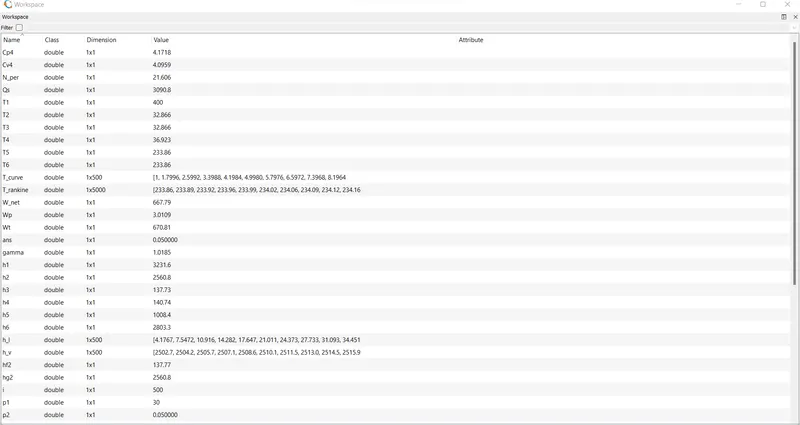
Workspace:
Graph: