Project 2 - Rankine cycle Simulator
Aim- a)Create a Rankine cycle simulator by using MATLAB.
b)To calculate state points graph of H-S and T-S.
Theory-
The Rankine cycle is an idealized thermodynamic cycle describing the process by which certain heat engines, such as steam turbines or reciprocating steam engines, allow mechanical work to be extracted from a fluid as it moves between a heat source and heat sink. The Rankine cycle is named after William John Macquorn Rankine, a Scottish polymath professor at Glasgow University.
Heat energy is supplied to the system via a boiler where the working fluid (typically water) is converted to a high pressure gaseous state (steam) in order to turn a turbine. After passing over the turbine the fluid is allowed to condense back into a liquid state as waste heat energy is rejected before being returned to boiler, completing the cycle. Friction losses throughout the system are often neglected for the purpose of simplifying calculations as such losses are usually much less significant than thermodynamic losses, especially in larger systems.
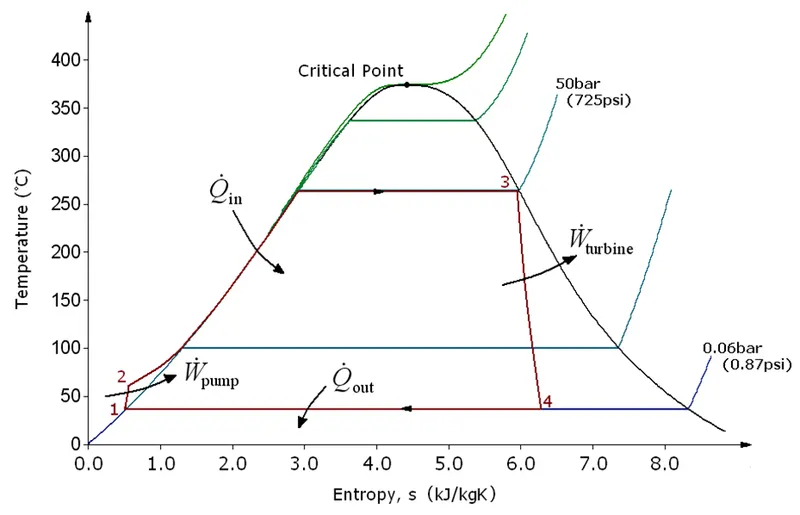
There are four processes in the Rankine cycle. The states are identified by numbers (in brown) in the T–s diagram.
- Process 1–2: The working fluid is pumped from low to high pressure. As the fluid is a liquid at this stage, the pump requires little input energy. Process 1-2 is isentropic compression.
- Process 2–3: The high-pressure liquid enters a boiler, where it is heated at constant pressure by an external heat source to become a dry saturated vapour. The input energy required can be easily calculated graphically, using an enthalpy–entropy chart(h–s chart, or Mollier diagram), or numerically, using steam tables or software. Process 2-3 is constant pressure heat addition in boiler.
- Process 3–4: The dry saturated vapour expands through a turbine, generating power. This decreases the temperature and pressure of the vapour, and some condensation may occur. The output in this process can be easily calculated using the chart or tables noted above. Process 3-4 is isentropic expansion.
- Process 4–1: The wet vapour then enters a condenser, where it is condensed at a constant pressure to become a saturated liquid. Process 4-1 is constant pressure heat rejection in condenser.
In an ideal Rankine cycle the pump and turbine would be isentropic, i.e., the pump and turbine would generate no entropy and hence maximize the net work output. Processes 1–2 and 3–4 would be represented by vertical lines on the T–s diagram and more closely resemble that of the Carnot cycle. The Rankine cycle shown here prevents the state of the working fluid from ending up in the superheated vapor region after the expansion in the turbine, [1] which reduces the energy removed by the condensers.
The actual vapor power cycle differs from the ideal Rankine cycle because of irreversibilities in the inherent components caused by fluid friction and heat loss to the surroundings; fluid friction causes pressure drops in the boiler, the condenser, and the piping between the components, and as a result the steam leaves the boiler at a lower pressure; heat loss reduces the net work output, thus heat addition to the steam in the boiler is required to maintain the same level of net work output.
Programme-
clear all
close all
clc
disp(' Rankine Cycle Simulator');
disp(' 1 - 2 is Isentropic Expansion in Turbine');
disp(' 2 - 3 is Isobaric Heat rejection in Condensor');
disp(' 3 - 4 is Isentropic Compression in Pump');
disp(' 4 - 1 is Isobaric Heat addition in Boiler');
%Inputs
p1 = input(' Enter Turbine inlet pressure in bar:');
t1 = input(' Enter Turbine inlet temperature in degree celcius:');
p2 = input(' Enter Condensor pressure in bar:');
%Inlet of the turbine
s1 = XSteam('s_pT',p1,t1);
h1 = XSteam('h_pT',p1,t1);
%Inlet of the condenser
s2 = s1;
t2 = XSteam('TSat_p',p2);
sf2=XSteam('sL_p',p2);
sg2=XSteam('sV_p',p2);
hf2=XSteam('hL_p',p2); %enthalpy at liquid state
hg2=XSteam('hV_p',p2); %enthalpy at gaseous state
x2=((s2-sf2)/(sg2-sf2)); %dryness fraction factor
h2=hf2+(x2*(hg2-hf2));
%Exit of the condenser
p3 = p2;
t3 = t2;
s3 = XSteam('sL_T',t3);
h3 = XSteam('h_ps',p3,s3);
%Inlet to the boiler
p4 = p1;
s4 = s3;
h4 = XSteam('h_ps',p4,s4);
cp4 = XSteam('CpL_p',p3);
cv4 = XSteam('CvL_p',p3);
gamma = (cp4/cv4);
% To calculate the t4
% p4^(1-gamma)*t4^gamma = p3^(1-gamma)*t3^gamma
t4 = (t3*((p3/p4)^((1-gamma)/gamma)));
% Calculation
%Work done by turbine
wt = h1 - h2;
%Work done by pump
wp = h4 - h3;
%Net Work done
w_net = wt - wp;
%Heat injected in boiler
q_in = h1 - h4;
%Heat rejected in condensor
q_out = h2 - h3;
%Thermal Efficiency
n = w_net/q_in;
np = n*100;
%Plot for Temperature vs Entropy
figure(1)
%plot for liquid and vapour saturation curves
t = linspace(0,550,600);
for i = 1:length(t)
s_l(i) = XSteam('sL_T',t(i));
end
for i = 1:length(t)
s_v(i) = XSteam('sV_T',t(i));
end
plot(s_l,t,'--','color','r')
hold on
plot(s_v,t,'--','color','b')
grid on
%plot for Work done by turbine
plot([s1,s2],[t1,t2],'color','r')
hold on
title('T-S DIAGRAN OR IDEAL RANKINE CYCLE')
xlabel('Entropy(KJ/kgK)')
ylabel('Temperature(K)')
%plot for heat rejected in condensor
plot([s2,s3],[t2,t3],'color','b')
hold on
%plot for work done by pump
plot([s3,s4],[t3,t4],'color','g')
hold on
%plot for heat injected by boiler
tp = XSteam('TSat_p',p4);
sp = XSteam('sL_T',tp);
plot([s4,sp],[t4,tp],'color','m')
hold on
tq = tp;
sq = XSteam('sV_T',tq);
plot([sp,sq],[tp,tq],'color','m')
hold on
plot([sq,s1],[tq,t1],'color','m')
hold on
%Indicate states with numbers
text(s1,t1,'1');
text(s2,t2,'2');
text(s3,t3,'3');
text(s4,t4,'4');
%Plot for enthalpy vs entropy
figure(2)
plot([s1,s2],[h1,h2],'color','r')
grid on
title('H-S DIAGRAM')
xlabel('Entropy(KJ/kgK)')
ylabel('Enthalpy(KJ/kg)')
hold on
plot([s2,s3],[h2,h3],'color','b')
hold on
plot([s3,s4],[h3,h4],'color','g')
hold on
plot([s4,s1],[h4,h1],'color','m')
hold on
%plot for liqiuid and vapour saturation curve
t = linspace(0,550,600);
for j = 1:length(t)
h_l(j) = XSteam('hL_T',t(j));
end
for j = 1:length(t)
h_v(j) = XSteam('hV_T',t(j));
end
plot(s_l,h_l,'--','color','r')
hold on
plot(s_v,h_v,'--','color','b')
%Indicate states with numbers
text(s1,h1,'1');
text(s2,h2,'2');
text(s3,h3,'3');
text(s4,h4,'4');
%Results output
fprintf('\n \n%10s %54s \n','State 1','State 2');
fprintf('%s %6.3f%s %44s %.3f%s \n','P1:',p1,'bar','P2:',p2,'bar');
fprintf('%s %.3f%s %35s %.3f%s \n','T1:',t1,'Deg Celcius','T2:',t2,'Deg Celcius');
fprintf('%s %8.3f%s %40s %.3f%s \n','H1:',h1,'KJ/kg','H2:',h2,'KJ/kg');
fprintf('%s %.3f%s %42s %.3f%s \n \n \n','S1:',s1,'KJ/kgK','S2:',s2,'KJ/kgK');
fprintf('%10s %54s \n','State 3','State 4');
fprintf('%s %6.3f%s %44s %.3f%s \n','P3:',p3,'bar','P4:',p4,'bar');
fprintf('%s %.3f%s %35s %.3f%s \n','T3:',t3,'Deg Celcius','T4:',t4,'Deg Celcius');
fprintf('%s %8.3f%s %40s %.3f%s \n','H3:',h3,'KJ/kg','H4:',h4,'KJ/kg');
fprintf('%s %.3f%s %42s %.3f%s \n \n \n','S3:',s3,'KJ/kgK','S4:',s4,'KJ/kgK');
fprintf('%40s %.3f %s \n','Work output by Turbine: ',wt,'KJ/kg');
fprintf('%40s %.3f %s \n','Work input by Pump: ',wp,'KJ/kg');
fprintf('%40s %.3f %s \n','Net Work: ',w_net,'KJ/kg');
fprintf('%40s %.3f \n','Thermodynamic Efficiency: ',np);
fprintf('%40s %.3f %s \n','Heat input in Boiler: ',q_in,'KJ/kg');
fprintf('%40s %.3f %s \n','Heat rejected in condenser: ',q_out,'KJ/kg');
Programme Explanation-
- Using fprintf or disp print the processes involved in the ranking cycle.
- using input display the prompt at command to get initial values.
- Read the XSteam.m code carefully and use it to obtain the value of thermodynamic properties at different states.
- We need at least 2independent, insensitive properties to define any state.
- During phase changes, the temperature remains constant.
- Display the outputs of computed thermodynamic properties of each state.
- Calculate the efficiency, net work, back work ratio and display it in the command window.
- To create a vapour dome make use the fact that the critical temperature of the water is 373.946-degree centigrade.
- compute the variation of entropy during the isobaric process and plot the T-S and H-S indicator diagrams.
- In states 3 and 4 are mixed up because in the 3 to 4 process entropy remains constant and my temperatures T3 and T4 are almost the same which means that pump work is very small.
Result-
Rankine Cycle Simulator-
1 - 2 is Isentropic Expansion in Turbine
2 - 3 is Isobaric Heat rejection in Condensor
3 - 4 is Isentropic Compression in Pump
4 - 1 is Isobaric Heat addition in Boiler
Enter Turbine inlet pressure in bar:30
Enter Turbine inlet temperature in degree celcius:400
Enter Condensor pressure in bar:0.05
State 1 State 2
P1: 30.000bar P2: 0.050bar
T1: 400.000Deg Celcius T2: 32.875Deg Celcius
H1: 3231.571KJ/kg H2: 2110.708KJ/kg
S1: 6.923KJ/kgK S2: 6.923KJ/kgK
State 3 State 4
P3: 0.050bar P4: 30.000bar
T3: 32.875Deg Celcius T4: 36.834Deg Celcius
H3: 137.753KJ/kg H4: 140.762KJ/kg
S3: 0.476KJ/kgK S4: 0.476KJ/kgK
Work output by Turbine: 1120.863 KJ/kg
Work input by Pump: 3.009 KJ/kg
Net Work: 1117.853 KJ/kg
Thermodynamic Efficiency: 36.167
Heat input in Boiler: 3090.809 KJ/kg
Heat rejected in condenser: 1972.955 KJ/kg
Output Plots-
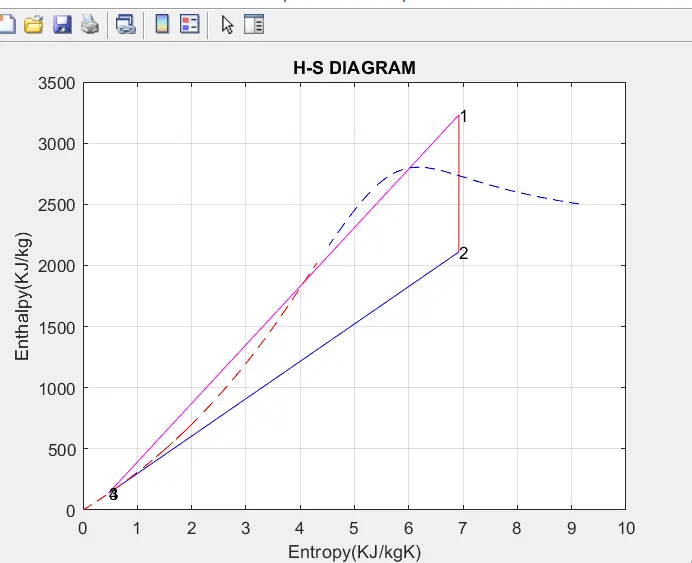
H-S Diagram
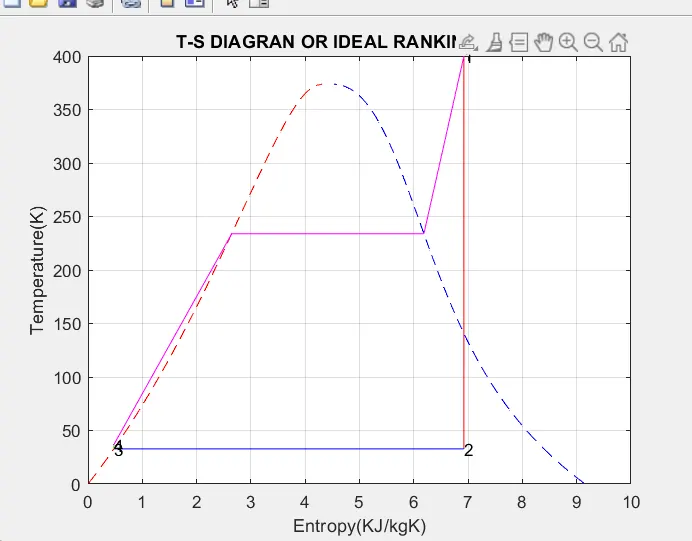
T-S Diagram