Project 1 - Parsing NASA thermodynamic data
Aim- Nasa file parsing and evaluate specific heat, entropy, enthalpy using matlab software.
Objective-
1.Write a function that extracts the 14 co-efficients and calculates the enthalpy, entropy and specific heats for all the species in the data file.
2.Calculate the molecular weight of each species and display it in the command window.
- Plot the Cp, Enthalpy and Entropy for the local temperature range (low temperature : high temperature) specific for each species.
Governing equation-

Programme-
First we are starting from function –
function[cp,h,s]=coeff_func_nasa(T,a1,a2,a3,a4,a5,a6,a7,a8,a9,a10,a11,a12,a13,a14)
R=8.314
for i=length(T);
if T(i)<300;
cp=(a1+a2.*T+a3.*T.^2+a4.*T.^3+a5.*T.^4).*R
h=(a1+(a2.*T)./2+(a3.*T.^2)./3+(a4.*T.^3)./4+(a5.*T.^4)./5+a6./T).*(R.*T)
s=(a1*log(T)+a2.*T+(a3.*T.^2)./2+(a4.*T.^3)./3+(a5.*T.^4)./4+a7)
else
cp=(a8+a9.*T+a10.*T.^2+a11.*T.^3+a12.*T.^4).*R
h=(a8+(a9.*T)./2+(a10.*T.^2)./3+(a11.*T.^3)./4+(a12.*T.^4)./5+a13./T).*(R.*T)
s=(a8*log(T)+a9.*T+(a10.*T.^2)./2+(a11.*T.^3)./3+(a12.*T.^4)./4+a14)
end
end
end
Explanation-
Cp, h and s stands for specific heat, enthalpy and entropy which are output.
We are saving the file name as a coeff_func_nasa and we giving the inputs i.e temperature and 14 coefficients.
R stands for universal gas constant.
After that we are wring the equation and by using the forloop we obtain the repeated value of that equation.
Second we are starting molecular weight-
%Defining the function
function [molecular_weight] = mol_weigh_func(species_name);
SPECIES = upper(species_name);
constituents = {'H', 'C', 'N', 'O', 'A', 'S'};
atomic_weight = [1 12 14 16 40 32];
molecular_weight = 0;
for i = 1:length(SPECIES)
for j = 1:length(constituents)
if strcmp(SPECIES(i),constituents(j))
molecular_weight = molecular_weight + atomic_weight(j);
u = j;
end
end
n = str2double(SPECIES(i));
if n > 1
molecular_weight = molecular_weight + atomic_weight(u)*(n-1);
end
end
Explanation-
Output of this function is molecular weight.
And we are giving the input as species name.
Upper command is used because species name is in upper side of coefficient in data file.
Constituents means gases in the data file which we are going to calculate the molecular weight.
Atomic weight of those gases is required to calculate the molecular weight.
We are using the forloop command for repeated values of species and constituents and if command also used.
Main programme-
clear all
close all
clc
f1=fopen('THERMO.dat','r')
fgetl(f1);
%reading the header info.
global_temp_line=fgetl(f1);
A=strsplit(global_temp_line,' ');
global_low_temp=str2num(A{2});
global_mid_temp=str2num(A{3});
global_high_temp=str2num(A{4});
%skipping three lines
for i=1:3
fgetl(f1);
end
%reading the species
for i=1:53
header=fgetl(f1)
x=strsplit(header,' ');
species_name= x{1}
z=length(x);
local_low_temp=str2double(x(z-3));
local_mid_temp=str2double(x(z-2));
local_high_temp=str2double(x(z-1));
t1=local_low_temp;
t2=local_mid_temp;
t3=local_high_temp;
%getting first line coe.(a1-a5)
line_1=fgetl(f1);
a=strfind(line_1,'E')
a1=str2double(line_1(1:a(1)+3))
a2=str2double(line_1(a(1)+4:a(2)+3))
a3=str2double(line_1(a(2)+4:a(3)+3))
a4=str2double(line_1(a(3)+4:a(4)+3))
a5=str2double(line_1(a(4)+4:a(5)+3))
%getting 2nd line coe.(a6-a10)
line_2=fgetl(f1);
a_1=strfind(line_2,'E');
a6=str2num(line_2(1:a_1(1)+3))
a7=str2double(line_2(a_1(1)+4:a_1(2)+3))
a8=str2double(line_2(a_1(2)+4:a_1(3)+3))
a9=str2double(line_2(a_1(3)+4:a_1(4)+3))
a10=str2double(line_2(a_1(4)+4:a_1(5)+3))
%getting 3rd line coe.(a10-a14)
line_3=fgetl(f1);
a_2=strfind(line_1,'E');
a11=str2double(line_3(1:a_2(1)+3))
a12=str2double(line_3(a_2(1)+4:a_1(2)+3))
a13=str2double(line_3(a_2(2)+4:a_1(3)+3))
a14=str2double(line_3(a_2(3)+4:a_1(4)+3))
%creating the file to store all the plots
mkdir(['C:\Users\abhij\OneDrive\Desktop\output\',species_name])
%creating array of temp
T=linspace(global_low_temp,global_high_temp,450)
%calculating thermo. function
[cp,h,s]=coeff_func_nasa(T,a1,a2,a3,a4,a5,a6,a7,a8,a9,a10,a11,a12,a13,a14);
figure(1)
%plotting_temp vs specific heat
plot(T,cp,'linewidth',3,'color','b')
title(species_name);
xlabel('tempreture')
ylabel('SPECIFIC HEAT')
figure(2)
%plotting_temp vs enthapy
plot(T,h,'linewidth',3,'color','r')
title(species_name);
xlabel('tempreture')
ylabel('ENTHALPY')
figure(3)
%plottingc_temp vs entropy
plot(T,s,'linewidth',3,'color','y')
title(species_name);
xlabel('tempreture')
ylabel('ENTROPY')
%saving the file
cd=(['C:\Users\abhij\OneDrive\Desktop\output\',species_name])
%saving the plots
saveas(1,'specific heat.png');
saveas(2,'enthapy.png');
saveas(3,'entropy.png');
%calculation of mol. wt.
cd=(['C:\Users\abhij\OneDrive\Desktop\output\',species_name])
[molecular_weight] = mol_weigh_func(species_name)
end
fclose(f1);
Explanation-
Close all, clear all and clc used for deleting the recent page.
Fopen command is used for open the file which is thermo.data.
Fgetl used to show the lines on the file.
First we are showing the global temperature .
Strsplit used to spit separate quantity which can be stored in variable and do process.
Str2num is used to convert string into number.
For skipping 3 lines because temp. is after that three lines in file for that we use forloop command and use fgetl to show the temp.
For reading the species there are 53 gases 14 coefficients respectively so we used forloop command.
Local temp. which is in first line strsplit command is used to split the temp. and species.
Str2double command is used convert character vector that show the number to double precision value.
After that we are calculating the coeff. a1 to a14.
Strfind used to find the location of particular character.
After finding the coeff. We are creating a empty folder to store the graphs mkdir used to generate the folder.
For plotting the graph vs temp. we require temp. range so we use the linspace command for array for temp. low temp. to high temp.
After that mention the function programme and plot the graphs.
For saving the programme save as command is used.
And call the molecular function to calculate the molecular weight.
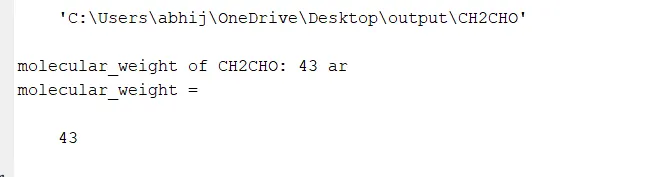
molecular weight showing in command window.
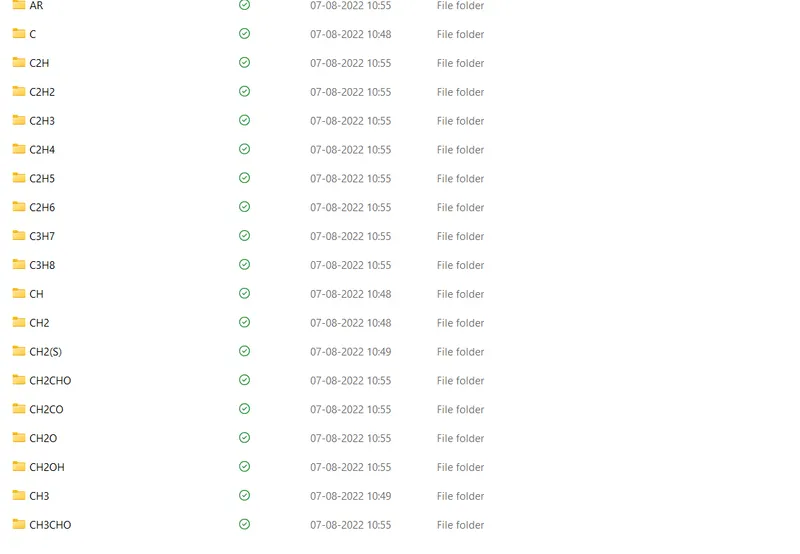
File store location.
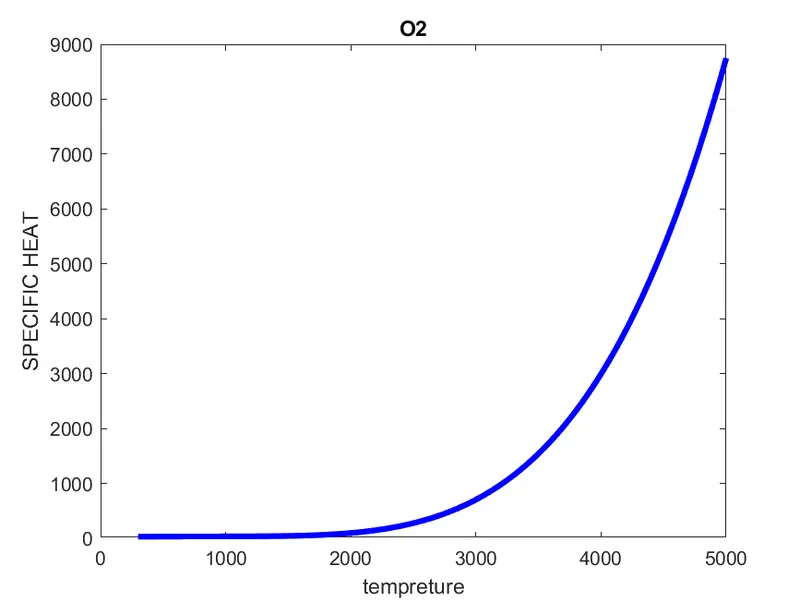
graph for o2 temp vs specific heat.
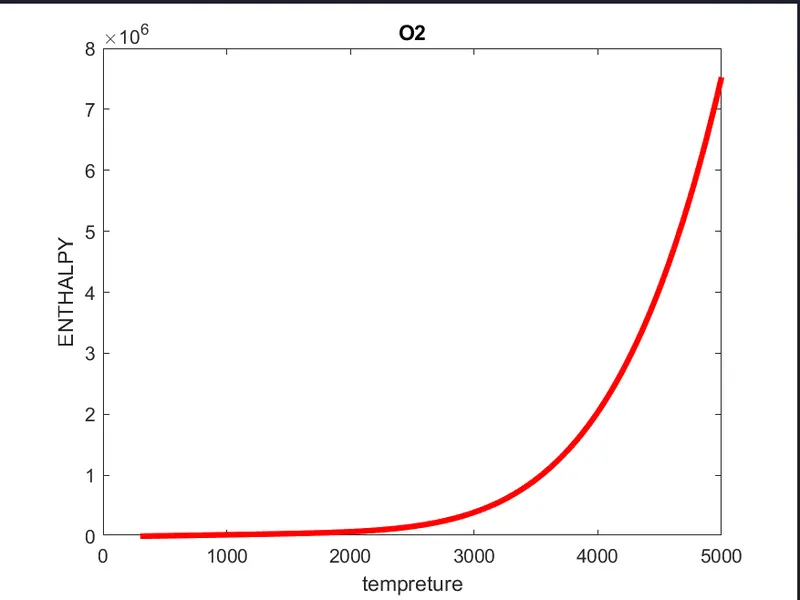
graph o2 temp vs enthalpy.
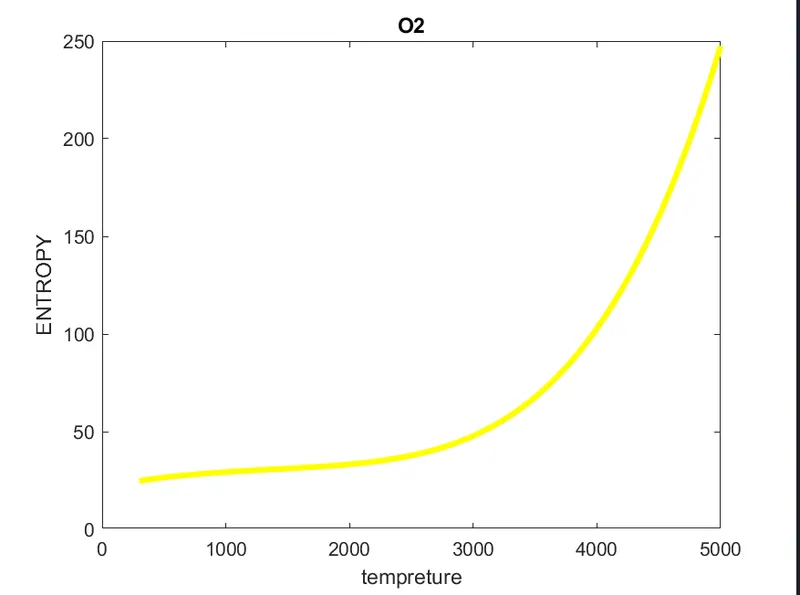
grapg for o2 temp vs entropy.
Conclusion- As per the programme we got the outputs that showing the graph temp vs entropy,enthalpy and specific heat.And all stored in a file.