Project 2 - Rankine cycle Simulator
clear all
close all
clc

fprintf('rankine cycle')
fprintf('1-2 is isentropic exapansion in turbine')
fprintf('2-3 is constant pressure heat removal')
fprintf('3-4 is isentropic compression in pump')
fprintf('4-1 is constant pressure heat addition in boiler ')

%inputs for state points
p1=30;
T1=400;
p2=0.05;

%gathering the data for point 1
h1 = XSteam('h_pT',p1, T1);
s1 = XSteam('s_pT', p1, T1);


%gathering the data for point 2
s2=s1;
sf2 = XSteam('sL_p',p2);
sg2 = XSteam('sV_p',p2);
x2 = (s2-sf2)/(sg2-sf2);
hf2 = XSteam('hL_p',p2);
hg2 = XSteam('hV_p',p2);
h2 = hf2 +(x2*(hg2-hf2));

%gathering the data for point 3
p3=p2;
s3=XSteam('sL_p',p3);
h3 = XSteam('hL_p', p3);

%gathering data for point 4
s4=s3;
p4= p1;

%work done pump
v3= XSteam('VL_p', p3);
W_P= v3*(p4-p3)*100;
h4=h3-W_P;

%Work done turbine
W_T= h1-h2;

% Net work done
W_net = W_T- W_P;

%Heat addition
Q_in = h1-h4;

%heat rejection
Q_out = h2-h3;

%thermal efficiency
T_eff= (W_net/Q_in)*100;

%specific steam consumption
Sp_S =(3600/W_net);

%temperature calculation
T3= XSteam('Tsat_p',p3);
T2=T3;
Cp4 = XSteam('Cp_ps', p4,s4);
Cv4 = XSteam('Cv_ps', p4,s4);
k= Cp4/Cv4;
T4= T3/((p3/p4)^(k-1/k));

T6= XSteam('Tsat_p',p1);
s5= XSteam('sL_p',p1);
s6=XSteam('sV_p',p1);
h5=XSteam('hL_p',p1);
h6=XSteam('hV_p',p1);
T5=T6;

%plot saturation
T=linspace(1,560,1000);
for i= 1:length(T)
    sf(i)= XSteam('sL_T',T(i));
    sg(i)=XSteam('Sv_T', T(i));
    hf(i)=XSteam('hL_T',T(i));
    hg(i)=XSteam('hV_T', T(i));
end
figure(1)
hold on
plot(sf,T,'color','r','LineWidth',2)
plot(sg,T,'color','r','LineWidth',2)
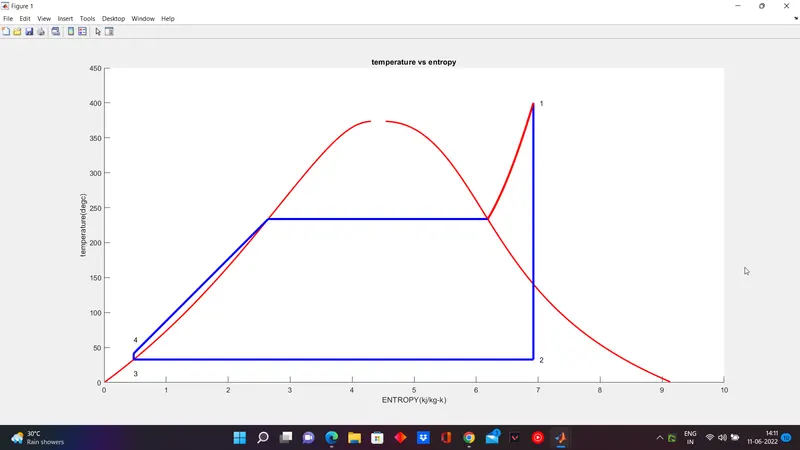
plot([s1 s2],[T1 T2],'Color','b', 'LineWidth',3)
plot([s2 s3],[T2 T3],'Color','b', 'LineWidth',3)
plot([s3 s4],[T3 T4],'Color','b', 'LineWidth',3)
plot([s4 s5],[T4 T5],'Color','b', 'LineWidth',3)
plot([s5 s6],[T5 T6],'Color','b', 'LineWidth',3)

s_1= linspace(s6,s1,1000);
for j= 1:length(s_1)
    Tc(j)=XSteam('T_ps', p1,s_1(j));
end

plot(s_1,Tc,'Color','r','LineWidth',3)
text(s1+0.1,T1,'1')
text(s2+0.1,T2,'2')
text(s3,T3-20,'3')
text(s4, T4+20,'4')
title('temperature vs entropy')
xlabel('ENTROPY(kj/kg-k)')
ylabel('temperature(degc)')

%plot
figure(2)
hold on
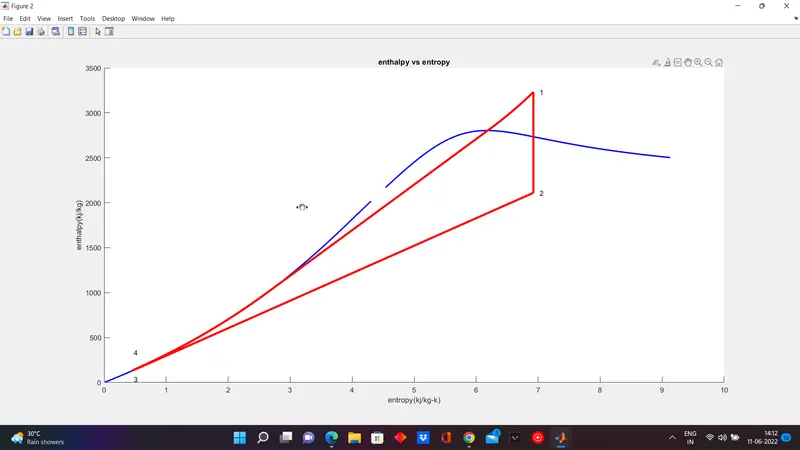
plot(sf,hf,'color','b','lineWidth',2)
plot(sg,hg,'Color','b','LineWidth',2)
plot([s1 s2],[h1 h2],'Color','r','lineWidth',3)
plot([s2 s3],[h2 h3],'Color','r','LineWidth',3)
plot([s3 s4],[h3 h4],'Color','r','LineWidth',3)
hc = linspace(h4, h5, 100);
for c= 1:length(hc)
    s_c(c)=XSteam('s_ph',p1,hc(c));
end

plot(s_c,hc,'Color','r','LineWidth',3)
plot([s5 s6],[h5 h6],'Color','r','LineWidth',3)
for d= 1:length(s_1)
    h_c(d)= XSteam('h_ps',p1,s_1(d))
end

plot(s_1,h_c,'Color','r','LineWidth',3)
text(s1+0.1,h1,'1')
text(s2+0.1,h2,'2')
text(s4,h3-100,'3')
text(s4,h4+200,'4')
title('enthalpy vs entropy')
xlabel('entropy(kj/kg-k)')
ylabel('enthalpy(kj/kg)')

% for results in command window
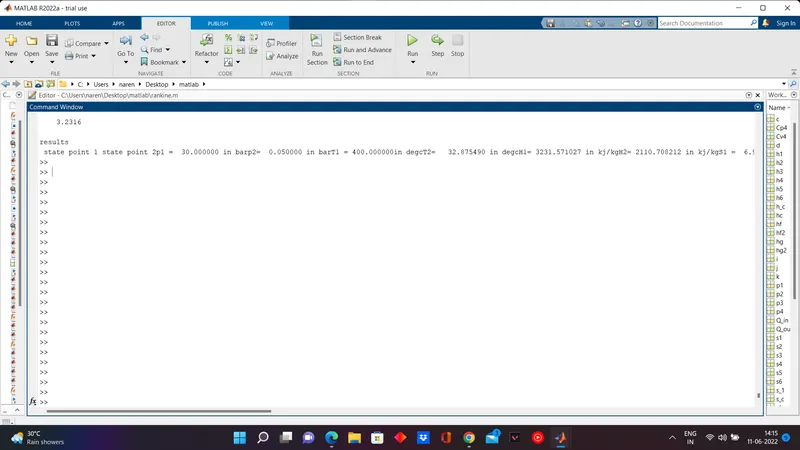
disp('results')
fprintf(' state point 1 ')
fprintf('state point 2')
fprintf('p1 = %10f in bar',p1)
fprintf('p2=%10f in bar', p2)
fprintf('T1 =%11fin degc', T1)
fprintf('T2= %11f in degc',T2)
fprintf('H1=%12f in kj/kg',h1)
fprintf('H2=%12f in kj/kg',h2)
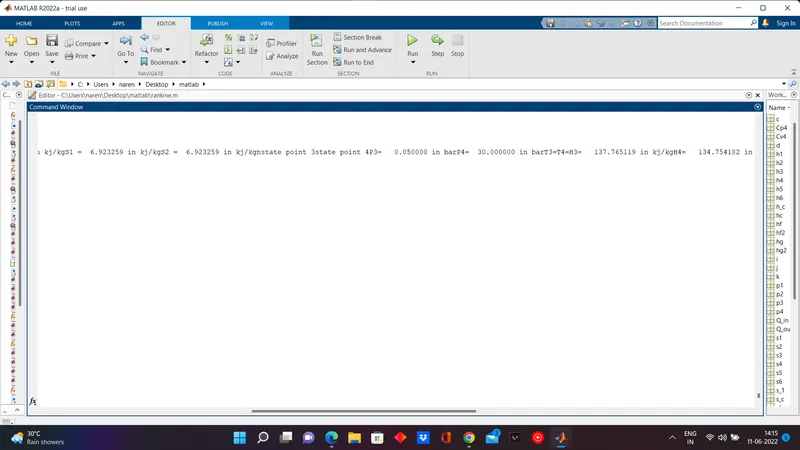
fprintf('S1 = %9f in kj/kg',s1)
fprintf('S2 = %9f in kj/kg',s2)
fprintf('n')
fprintf('state point 3')
fprintf('state point 4')
fprintf('P3= %10f in bar',p3)
fprintf('P4= %10f in bar',p4)
fprintf('T3=%11 in degc',T3)
fprintf('T4=%11 in dgec',T4)
fprintf('H3= %12f in kj/kg',h3)
fprintf('H4= %12f in kj/kg',h4)
fprintf('S3 = %9f in kj/kg-k', s3)
fprintf('S4 = %9f in kj/kg-k', s4)
fprintf('n')
fprintf(' turbine work = %14f in kj/kg',W_T)
fprintf('pump work= %15f in kj/kg', W_P)
fprintf('NET WORK = %17 in kj/kg', W_net)
fprintf('thermal efficiency =%13 in percent',T_eff)
fprintf('sp. steam consumption = %f in kj/kw',Sp_S)
report-
explanantion-
starting with understanding the 4 processes in the rankine cycle.
input the given conditions for the temperature and pressure
finding the data for temperature pressure enthalpy and entropy with the help of the XSteam table for all the 6 points
finding work done by turbine and pump and the net work done with the help of formulas
finding heat addition and rejection, thermal efficiency, specific steam consumption with the help of formulas
plotting the graphs for temperature vs entropy and entropy vs enthalpy
writing code for all the results in the command window
TEMPERATURE VS ENTROPY
ENTROPY VS ENTHALPY-
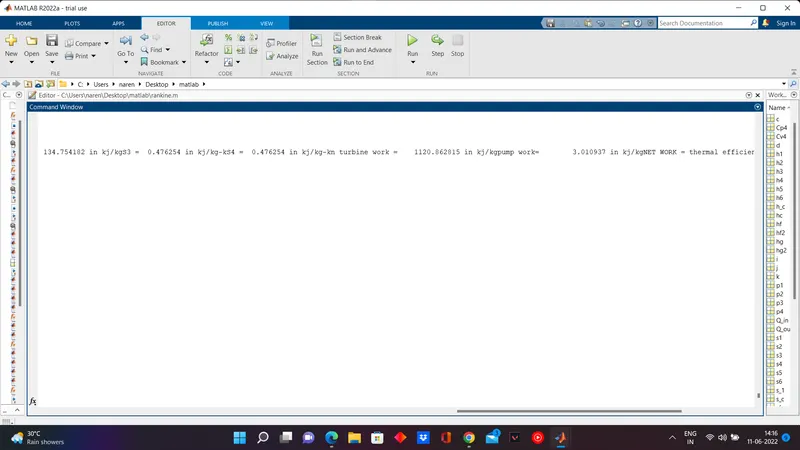
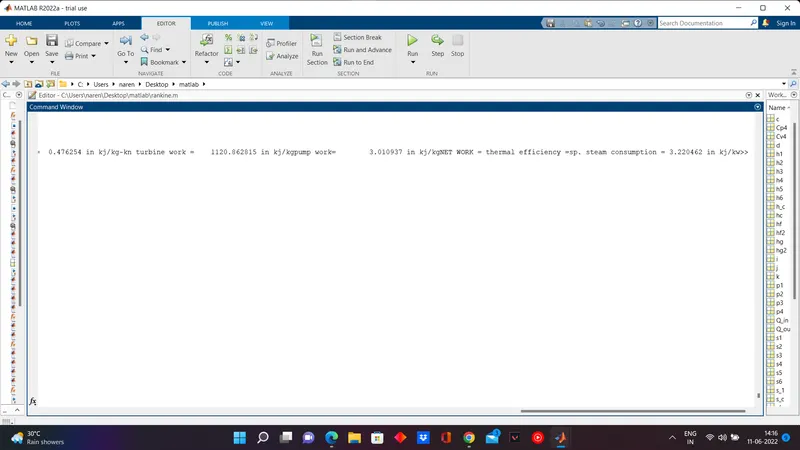
RESULTS IN COMMAND WINDOW-
ERRORS FACED
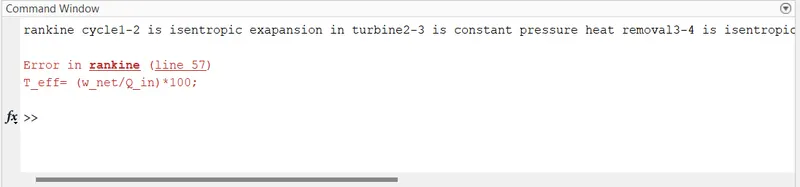
Making the w capital
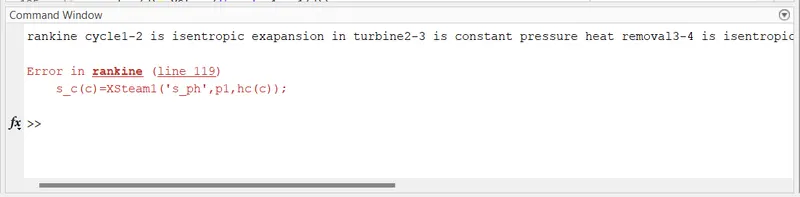
removing 1 from XSteam