Project 2 - Rankine cycle Simulator
Aim: To create Rankine cycle simulator using MATLAB.
Objective:
- To simulate Rankine cycle using MATLAB.
- To calculate state points using function XSteam.
- To plot T-S and H-S curve for given inputs in Rankine cycle.
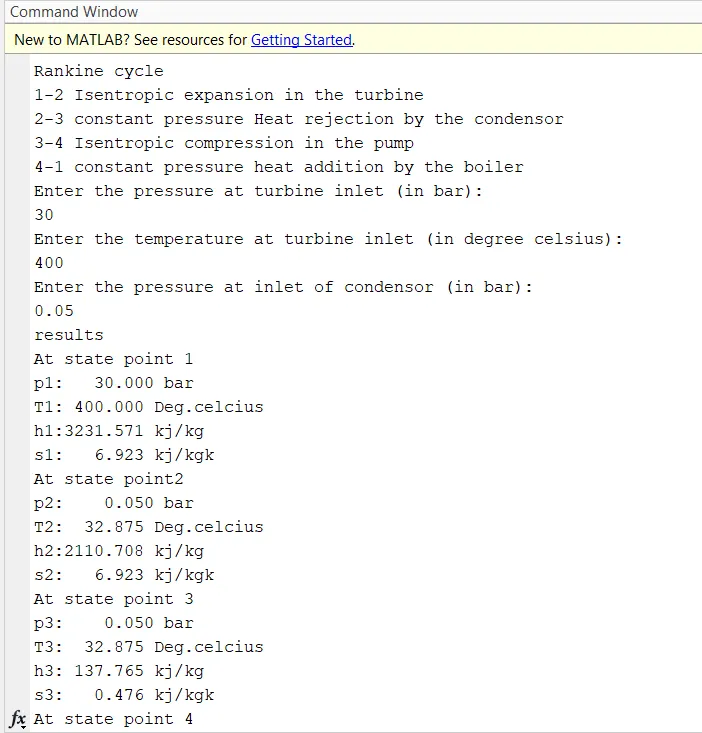
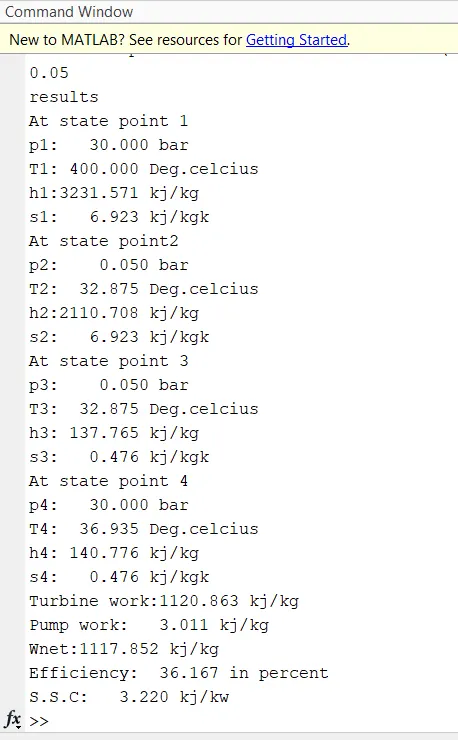
- To get output in command window for each state point in cycle.
Procedure:
Rankine Cycle :
- Rankine is an idealized thermodynamic cycle or heat engine in which a fuel is used to produce heat within the boiler ,converting water into steam which them expand through a turbine producing useful work .This process was developed in 1859 by Scottish engineer william j. m Rankine .It is a cycle which convert heat into mechanical energy which is usually converted into electrical energy.
- In this project idealized cycle is simulated,Hence neglected losses
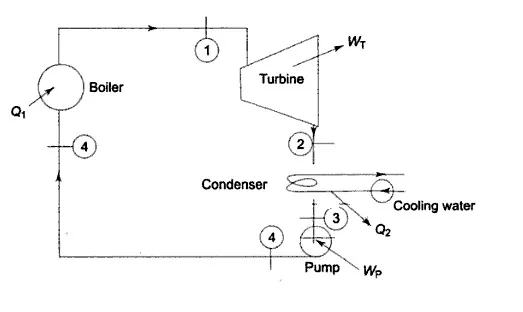
- The above figure shows the pictorial view of Rankine cycle
- Heat energy is supplied to the system via a boiler where the working fluid (typically water) is converted to a high pressure gaseous state (steam) in order to turn a turbine. After passing over the turbine the fluid is allowed to condense back into a liquid state as waste heat energy is rejected before being returned to boiler, completing the cycle. Friction losses throughout the system are often neglected for the purpose of simplifying calculations as such losses are usually much less significant than thermodynamic losses, especially in larger systems.
Process and working :
There are four processes in the rankine cycle :
- Process 1-2=Isentropic expansion in the turbine
- Process 2-3=constant pressure Heat rejection by the condensor
- Process 3-4=Isentropic compression in the pump
- Process 4-1=constant pressure heat addition by the boiler
1) Process 1-2 =The dry saturated vapour expand through the turbine,generating power ,this decreases the temperature and pressure of the vapour and some condensation may occure.
2) Process 2-3 = The vapour liquid mixture leaving the turbine is condensate at low pressure usually in surface condenser using cooling water .In well designed and maintained condensers,the pressure of the vapour is below atmospheric pressure,approaching the saturation pressure of the operating fluid at the cooling water temperature.
3) Process 3-4= The pressure of the condensate liquid is raised in feed pump,because of the low specific volume of the liquids,In this process entropy remains unchanged.
4) Process 4-1= High pressure liquid enter the boiler from feed pump and is heated to the saturation temperature ,further addition of energy causes evaporation of liquid until it is fully converted into saturated steam or superheated
Matlab code :
clear all
close all
clc
% print rankine process description
fprintf('Rankine cycle\n')
fprintf('1-2 Isentropic expansion in the turbine\n');
fprintf('2-3 constant pressure Heat rejection by the condensor\n');
fprintf('3-4 Isentropic compression in the pump\n' );
fprintf('4-1 constant pressure heat addition by the boiler\n');

% Inputs
p1=input('Enter the pressure at turbine inlet (in bar):\n');
T1=input('Enter the temperature at turbine inlet (in degree celsius):\n');
p2=input('Enter the pressure at inlet of condensor (in bar):\n');

% Extracting data defining variables
% state 1
h1=XSteam('h_pT',p1,T1); % Enthalpy at pressure and  temperature 1
s1=XSteam('s_pT',p1,T1); % Entropy at pressure and  temperature 1
% state 2
s2=s1;                % due to isentropic expansion s2=s1
sf2=XSteam('sL_p',p2); % Saturated liquid entropy at pressure 2
sg2=XSteam('sV_p',p2); % Saturated vapour entropy at pressure 2
x2=(s2-sf2)/(sg2-sf2); % Dryness fraction at state point 2
hf2=XSteam('hL_p',p2); % Saturated liquid enthalpy at pressure 2
hg2=XSteam('hV_p',p2); % Saturated vapour enthalpy at pressure 2
h2=hf2+(x2*(hg2-hf2)); % Enthalpy at state point 2

% state 3
p3=p2;              % Constant pressure in heat removal process
s3=XSteam('sL_p',p3); % Saturated liquid entropy at pressure 3
h3=XSteam('hL_p',p3); % Saturated vapour enthalpy at pressure 3

% State 4
s4=s3;           % Isentropic compression process
p4=p1;           % Constant pressure heat rejection

%Work done by the turbine
Wt=h1-h2;

% work done to run pump
v3=XSteam('vL_p',p3);
Wp=v3*(p4-p3)*100;
h4=h3+Wp;

%net work
Wnet=Wt-Wp;

% Heat into the system
Qin= h1-h4;

% Heat out from the system
Qout=h2-h3;

%Thermal efficiency
eff=(Wnet/Qin)*100;

% Specific steam consumption
%SSC=mass flow rate  per power
SSC=(3600/Wnet);

% Calculating temperature at state points 2,3,4
T3=XSteam('Tsat_p',p3); % Saturation temperature at pressure 3
T2=T3;
Cp4=XSteam('Cp_ps',p4,s4);
Cv4=XSteam('Cv_ps',p4,s4');
k=Cp4/Cv4;
T4=T3/((p3/p4)^((k-1)/k));

% Calculating temperature,enthalpy,entropy for saturated vapour and liquid

T6=XSteam('Tsat_p',p1);
s5=XSteam('sL_p',p1);
s6=XSteam('sV_p',p1);
h5=XSteam('hL_p',p1);
h6=XSteam('hV_p',p1);
T5=T6;

% plotting the saturation curve
T=linspace(1,375,1000);
for i=1:length(T)
    sf(i)=XSteam('sL_T',T(i));
    sg(i)=XSteam('sV_T',T(i));
    hf(i)=XSteam('hL_T',T(i));
    hg(i)=XSteam('hV_T',T(i));
end

% Plotting the T-s Diagram
figure(1)
hold on
plot(sf,T,'r','linewidth',1)
plot(sg,T,'r','linewidth',1)
plot([s1 s2],[T1 T2], 'k','linewidth',2)
plot([s2 s3],[T2 T3], 'k','linewidth',2)
plot([s3 s4],[T3 T4], 'k','linewidth',2)
plot([s4 s5],[T4 T5], 'k','linewidth',2)
plot([s5 s6],[T5 T6], 'k','linewidth',2)
sc1 =linspace(s6,s1,1000);
for l=1:length(sc1)
    Tc1(l)=XSteam('T_ps',p1,sc1(l));
end
plot(sc1,Tc1,'k','linewidth', 2)
text(s1+0.1,T1,'1')
text(s2+0.1,T2,'2')
text(s3,T3-20,'3')
text(s4,T4+20,'4')
title('Temp vs Entropy plot ')
xlabel('Entropy,S (Kj/kgk)')
ylabel('Temperature(degree c)')
legend('Saturation curve')

%Plotting the H-S diagram
figure(2)
hold on
plot(sf,hf,'r','linewidth',1)
plot(sg,hg,'r','linewidth',1)
plot([s1 s2],[h1 h2], 'k','linewidth',2)
plot([s2 s3],[h2 h3], 'k','linewidth',2)
plot([s3 s4],[h3 h4], 'k','linewidth',2)
hc=linspace(h4,h5,100);
for k=1:length(hc)
sch(k)=XSteam('s_ph',p1,hc(k));
end
plot(sch,hc,'k','LineWidth',2)
plot([s5 s6],[h5 h6],'k','lineWidth',2)
for m=1:length(sc1)
    hc1(m)=XSteam('h_ps',p1,sc1(m));
end
plot(sc1,hc1,'k','linewidth',2)
text(s1+0.1,h1,'1')
text(s2+0.1,h2,'2')
text(s3,h3-100,'3')
text(s4,h4+200,'4')
title('Enthalpy vs Entropy plot')
xlabel('Entropy,S(kj/kgk)')
ylabel('Enthalpy,H(kj/kg)')
legend('Saturation curve')

% Display result in command window
disp('results')
fprintf(('At state point 1\n'));
fprintf('p1: %8.3f bar\n',p1);
fprintf('T1:%8.3f Deg.celcius\n',T1);
fprintf('h1:%8.3f kj/kg\n',h1);
fprintf('s1:%8.3f kj/kgk\n',s1);

fprintf(('At state point2\n'));
fprintf('p2: %8.3f bar\n',p2);
fprintf('T2:%8.3f Deg.celcius\n',T2);
fprintf('h2:%8.3f kj/kgn\n',h2);
fprintf('s2:%8.3f kj/kgk\n',s2);

fprintf(('At state point 3\n'));
fprintf('p3: %8.3f bar\n',p3);
fprintf('T3:%8.3f Deg.celcius\n',T3);
fprintf('h3:%8.3f kj/kg\n',h3);
fprintf('s3:%8.3f kj/kgk\n',s3);

fprintf(('At state point 4\n'));
fprintf('p4: %8.3f bar\n',p4);
fprintf('T4:%8.3f Deg.celcius\n',T4);
fprintf('h4:%8.3f kj/kg\n',h4);
fprintf('s4:%8.3f kj/kgk\n',s4);

fprintf('Turbine work:%8.3f kj/kg\n',Wt);
fprintf('Pump work:%8.3f kj/kg\n',Wp);
fprintf('Wnet:%8.3f kj/kg\n',Wnet);
fprintf('Efficiency:%8.3f in percent \n',eff);
fprintf('S.S.C:%8.3f kj/kw\n',SSC);
Explanation of above code is follows:
Step 1) In order to print the all process of rankine cycle in command window we use fprintf command to show all this processes.
Step 2) we use input command to give input to the Rankine cycle we have pressure at turbine inlet,temperature at turbine, inlet,pressure at inlet of condensor.By using this inputs and the XSteam data which include the properties of steam and water such as enthalpy,entropy,at specific pressure and temperature for saturated vapour,saturated liquid condition etc.by using this we can calculate the state points of the Rankine cycle.
Step 3)Some thermodynamic relations is also used to calculate various state points of Rankine cycle.
Step 4) The XSteam data worked as
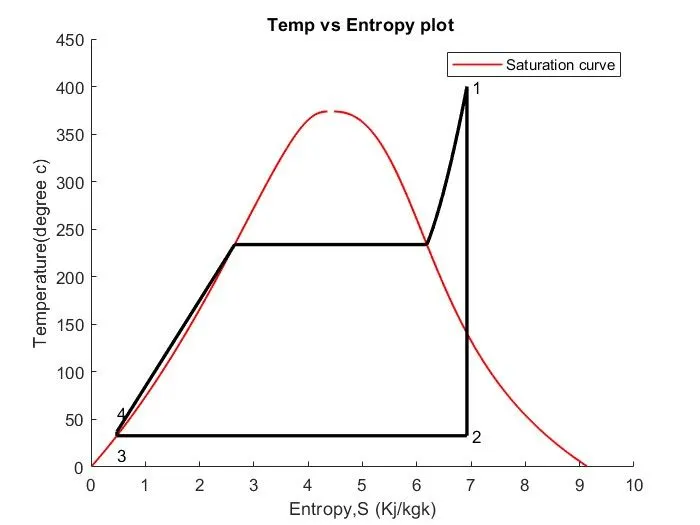
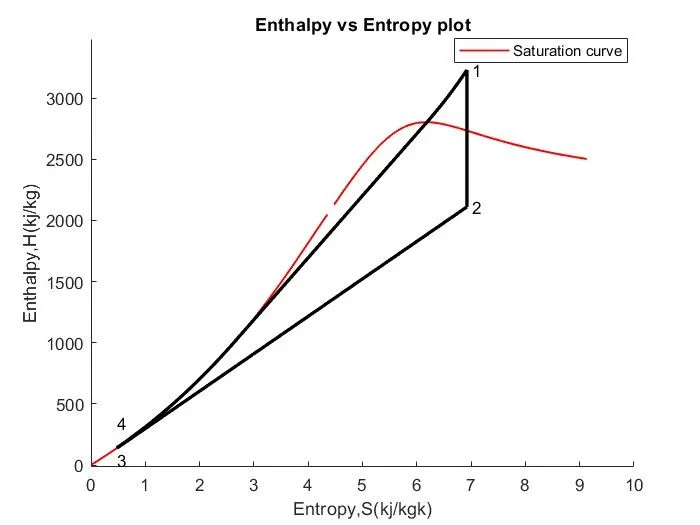
- Turbine Inlet temperature(T1) = 400° C
- Turbine Inlet Pressure (p1) = 30 bars
- Turbine Outlet Pressure (p2)= 0.05 bars = Condenser Inlet Pressure
References: