Project 2 - Rankine cycle Simulator
AIM:
To create a rankine cycle simulator and plot T-s and h-s diagram.
OBJECTIVE:
- To create a Rankine cycle simulator in MATLAB
- To calculate the state point using function XSteam
- To plot the T-s and h-s curve for given input in Rankine cycle
- To get output in the command window for each state point in cycle.
THEORY:
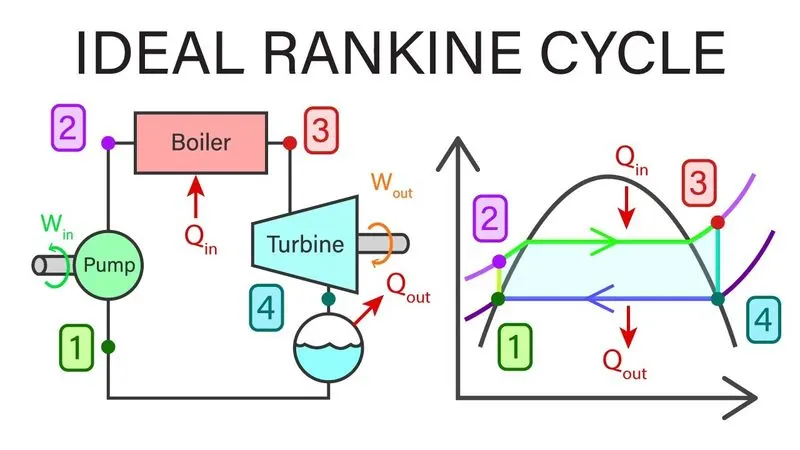
The rankine cycle is the fundamental opearting cycle of all power plants where an operating fluid is continously evaporated and condensed.The selection of operating fluid is continously evaporated and condensed.The selection of opearting fluid depends mainly on the available temperature.
The Rankine cycle operates in the following steps:
- 1-2 Isentropic Expansion:The vapour is expanded in the turbine thus producing work which may be converted to electricity.The saturated steam is expanded in the turbine and the rotation of turbine thus producing work which may be converted to electricity using a generator.The expansion is limited by the temperature of the cooling medium and by the erosion of turbine blades by liquid entrainment in the vapour steam as the process moves further into the two phase region
- 2-3 Isobaric Heat Rejection:The vapour liquid mixture leaving the turbine is condensed at low pressure,usually in a surface condenser using cooling water.
- 3-4 Isentropic Compression:The pressure of the working fluid which is in liquid form at this stage is raised in the pump.The pump requires very less work input.
- 4-1 Isobaric Heat Addition:High pressure liquid enters the boiler where addition of energy at constant pressure causes evaporation of the liquid until it is fully converted to saturated steam.
EQUATIONS USED:
1. Turbine work(Wt)
Wt=H1-H2
2.Pump work(Wp)
`Wp=H4-H3`
3.Net work(Wnet)
Wnet=Wt-Wp
4.Thermal Efficiency(`eta`)
`eta=`Wnet/(H1-H4)
5.Back Work Ratio(BWR)
BWR=Wp/Wt
6.Specific Steam conductivity(S.S.C)
S.S.C=3600/Wt
Where,H1,H2,H3 and H4 are the enthalpy at the state points 1,2,3 and 4 respectively.
MATLAB PROGRAM:
Xsteam is used to get steam data.
clear all
close all
clc

% creating Rankine cycle simulator
disp('RANKINE CYCLE SIMULATOR')
disp('1-2 : Isentropic Expansion in the turbine')
disp('2-3 : Isobaric Heat Rejection by condensor')
disp('3-4 : Isentropic Compression in the Pump')
disp('4-1 : Isobaric Heat Addition by the Boiler')
disp(' ')

t=linspace(0,373.15,300);

% inputs to be specified
P1=input('Enter the pressure at the Turbine inlet (in bar): ');
T1=input('Enter the temperature at the Turbine inlet (in Degree Celsius): ');
P2=input('Enter the pressure at the condenser (in bar): ');
disp(' ')

% state point 1
h1 = XSteam('h_pT',P1,T1);
s1 = XSteam('s_pT',P1,T1);
h_l1 = XSteam('hL_p',P1);
h_g1 = XSteam('hV_p',P1);
s_l1 = XSteam('sL_p',P1);
s_g1 = XSteam('sV_p',P1);
T_sat1 = XSteam('Tsat_p',P1);

% STATE POINT 2
s2=s1;
s_l2=XSteam('sL_p',P2);
s_g2=XSteam('sV_p',P2);

% dryness fraction
x=(s2-s_l2)/(s_g2-s_l2);

h_l2 = XSteam('hL_p',P2);
h_g2 = XSteam('hV_p',P2);
h2=h_l2+x*(h_g2-h_l2);
T2=XSteam('T_ph',P2,h2);
T_sat2=XSteam('Tsat_p',P2);

% STATE POINT 3
h3=h_l2;
s3=s_l2;
P3=P2;
T3=T2;

% STATE POINT 4
s4=s3;
P4=P1;
h4=XSteam('h_ps',P4,s4);
T4=XSteam('T_ps',P4,s4);

% plotting
% T-s Diagram
figure(1),clf
hold on

% saturation curve
for i =1:length(t)
    plot(XSteam('sL_T',t(i)),t(i),'r.')
    plot(XSteam('sV_T',t(i)),t(i),'r.')
end

% Rankine cycle
plot([s1 s2],[T1 T2],'LineWidth',2,'Color','g')
text(s1,T1,'1','FontSize',15)

% Beyond saturation curve
if x>1
    T3=T_sat2;
    plot([s2 s_g2 s3 s4],[T2 T_sat2 T3 T4],'LineWidth',2,'Color','g')
    text(s1,T2,'2','FontSize',15)
    text(s3,T3,'3','FontSize',15,'HorizontalAlignment','left','VerticalAlignment','top')

    % Beneath saturation curve
else
    plot([s2 s3 s4],[T2 T3 T4],'LineWidth',2,'Color','g')
    text(s1,T2,'2','FontSize',15)
    text(s3,T3,'3','FontSize',15,'HorizontalAlignment','left','VerticalAlignment','top')
end

n=linspace(T1,T2,500);
for i = 1:length(n)
    plot(XSteam('s_pT',P1,n(i)),n(i),'.','LineWidth',2,'Color','g')
end

 plot([s_l1 s_g1],[T_sat1 T_sat1],'LineWidth',2,'Color','g')
    text(s_l1,T_sat1,'4','FontSize',15,'VerticalAlignment','bottom')
    xlabel('Entropy(kJ/kg-K')
    ylabel('Temperature(k)')
    title('T-s Diagram')

    % h-s diagram
    figure(2),clf
    hold on

    % saturation curve
for i =1:length(t)
    plot(XSteam('sL_T',t(i)),XSteam('hL_T',t(i)),'r.')
    plot(XSteam('sV_T',t(i)),XSteam('hV_T',t(i)),'r.')
end

% Rankine cycle
plot([s1 s2 s3 s4 s1],[h1 h2 h3 h4 h1],'LineWidth',2,'Color','g')
text(s1,h1,'1','FontSize',15)
text(s2,h2,'2','FontSize',15)
text(s3,h3,'3','FontSize',15)
text(s4,h4+90,'4','FontSize',15)
xlabel('Entropy(kJ/kg-K')
    ylabel('Temperature(k)')
    title('h-s Diagram')

    % calculation of desired quantities
    % work done by turbine
    W_t=h1-h2;

    % work done by pump
    W_p =h4-h3;

    % Net work done
    W_net =W_t-W_p;

    % thermal efficiency
    n_thermal=(1-((h2-h3)/(h1-h4)))*100;

    % back work ratio
    BWR=W_p/W_t;

    % specific steam conductivity
    SSC=3600/W_t;

    % displaying results in command window
    disp('RESULTS:')

    disp('At state point 1: ')
    fprintf('P1=%.2f barn',P1)
    fprintf(['T1=%.2f' char(176) 'Cn'],T1)
    fprintf('h1=%.2f Kj/kgn',h1)
    fprintf('s1=%.2f Kj/kgKn',s1)
    disp(' ')

    disp('At state point 2: ')
    fprintf('P2=%.2f barn',P2)
    fprintf(['T2=%.2f' char(176) 'Cn'],T2)
    fprintf('h2=%.2f Kj/kgn',h2)
    fprintf('s2=%.2f Kj/kgKn',s2)
    disp(' ')

    disp('At state point 3: ')
    fprintf('P3=%.2f barn',P3)
    fprintf(['T3=%.2f' char(176) 'Cn'],T3)
    fprintf('h3=%.2f Kj/kgn',h3)
    fprintf('s3=%.2f Kj/kgKn',s3)
    disp(' ')

    disp('At state point 4: ')
    fprintf('P4=%.2f barn',P4)
    fprintf(['T4=%.2f' char(176) 'Cn'],T4)
    fprintf('h4=%.2f Kj/kgn',h4)
    fprintf('s4=%.2f Kj/kgKn',s4)
    disp(' ')

    fprintf('work done by turbine=%.2f kj/kgn',W_t)
    fprintf('work done by pump=%.2f kj/kgn',W_p)
    fprintf('Net work done=%.2f kj/kgn',W_net)
    fprintf('Thermal efficiency=%.2f %%n',n_thermal)
    fprintf('Back work ratio=%fn',BWR)
    fprintf('Specific steam conductivity=%.2f kg/kWhn',SSC)
CODE EXPLANATION:
- Initially a platform for filling required inputs is established.
- Then it is followed by specifying all state point variables from the XSteam library.
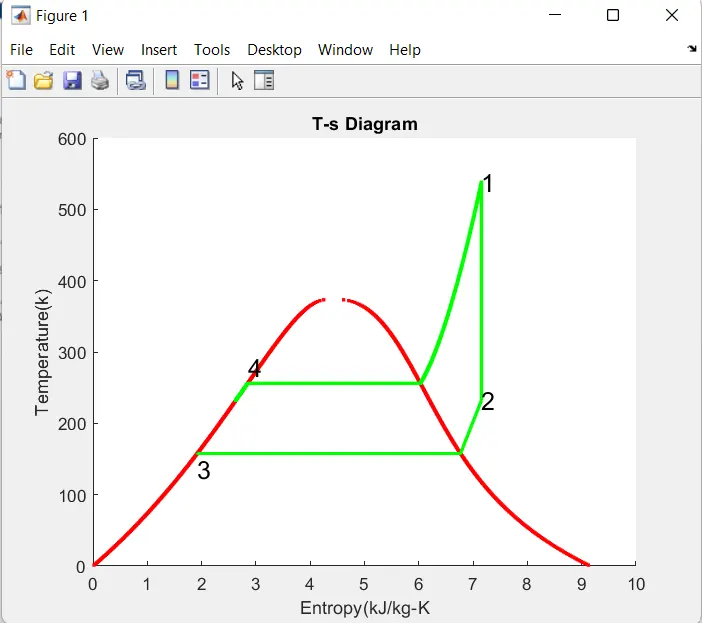
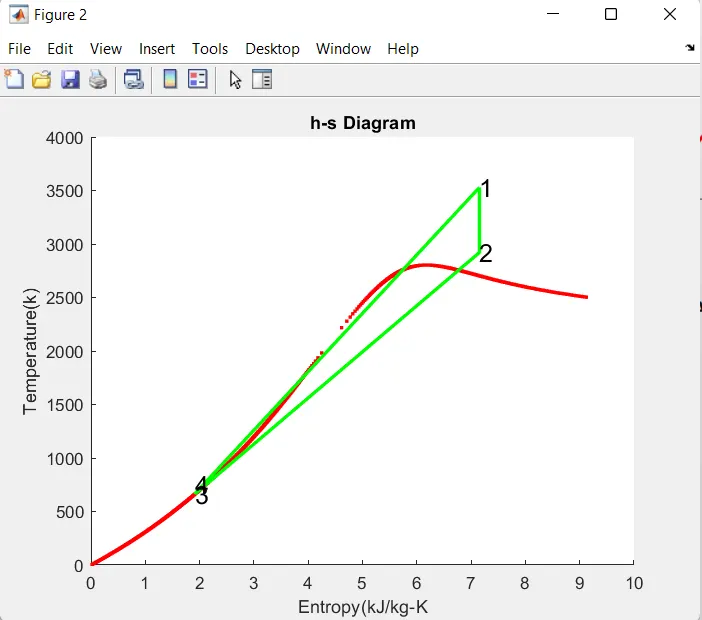
- The T-s and h-s diagrams are plotted containing the rankine cycle and saturation cycle.
- Then the calculation of desired quantities are calculated.the work done by individual equipments and the net work done is calculated.
- Adding to other desired variables back work ratio is also calculated.
- Then the values of state point variables is printed on command window with work output values.
OUTPUT:
On the COMMAND WINDOW
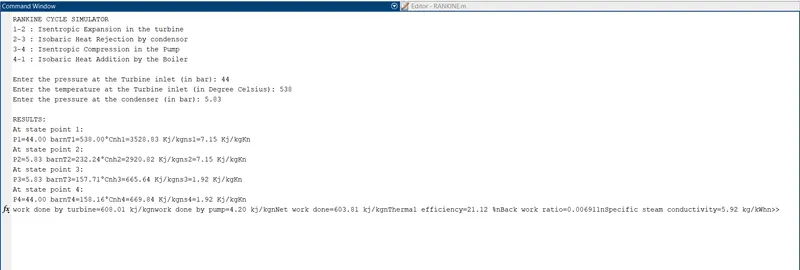
RESULTS:
From the command window
- Net work output =603.81 kj/kg
- Back work ratio=0.006911
PLOTS:
- T-s diagram
- h-s diagram
CONCLUSION:
The rankine cycle simulator has been established with required inputs fed.
The required variables are calculated and respective plots are plotted.
REFERENCES:
1. https://en.wikipedia.org/wiki/Rankine_cycle
2. https://energyeducation.ca/encyclopedia/Rankine_cycle
********************************************************************************************************************************************************************