Project 2 - Rankine cycle Simulator
Rankine cycle Simulator
Aim- To write code in MATLAB that can solve Rankine Cycle and make plots for it.
Objective-
- Creating a Rankine Cycle Simulator using OCTAVE/MATLAB. Calculating the state points of the Rankine Cycle based on user inputs.
- Then plotting the corresponding T-S and H-S plots for the given set of inputs.
Introduction-
- It is a model used to predict the performance of steam turbine systems.
- It was also used to study the performance of reciprocating steam engines.
- The Rankine cycle is an idealized Thermodynamic Cycle of a Heat Engine that converts heat into mechanical work while undergoing a phase change.
- It is an idealized cycle in which friction losses in each of the four components are neglected. The heat is supplied externally to a closed loop, which usually uses water as the Working Fluid.
- This was developed by a Scottish Engineer, Willam J.M Rankine in 1859. Hence the name Rankine Cycle.
Processes in Rankine Cycle-
There are four cycles in the Rankine Cycle. The below image shows the Physical Layout of the Rankine Cycle.
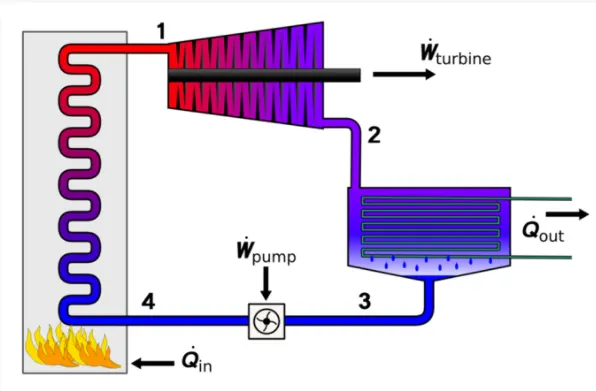
- 1 - 2 Isentropic Compression: The working fluid is pumped from low pressure to High Pressure. As the fluid is a liquid state, the pump requires input energy.
- 2 - 3 Constant Pressure Heat Addition process: The high-pressure liquid enters a boiler, where it is heated at constant pressure by an external heat source to become a dry vapor.
- 3 - 4 Isentropic Expansion: The Dry Saturated vapor expands through a turbine, generating power. This decreases the temperature and pressure of the vapor, and some condensation may occur.
- 4 - 1 Constant Pressure Heat rejection process: The wet vapor enters the condenser, where it is condensed at constant pressure to become saturated liquid.
The work input to the pump and the work output are calculated using enthalpy and entropy at that state using steam tables.
Step Wise Procedure-
Process Flow of the Rankine Cycle Simulator
- Clearing all the data stored, closing all the figures, and clearing the command window.
- Displaying the name and description of the simulator.
- Requesting for input by the user.
- Calculating the standard values that are to be used in the program using the XSteam function.
- Condition for working of the Rankine Cycle.
- Calculating the parameters of the State points.
- Calculating the heat input, heat rejected, thermal efficiency.
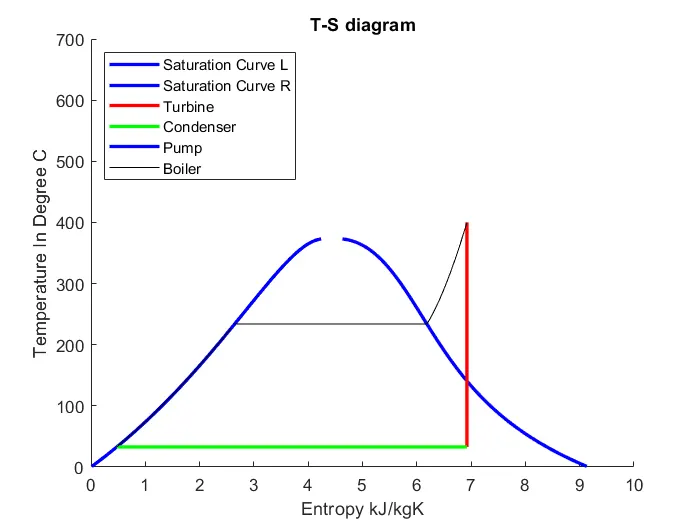
- T-s curve calculation and plotting.
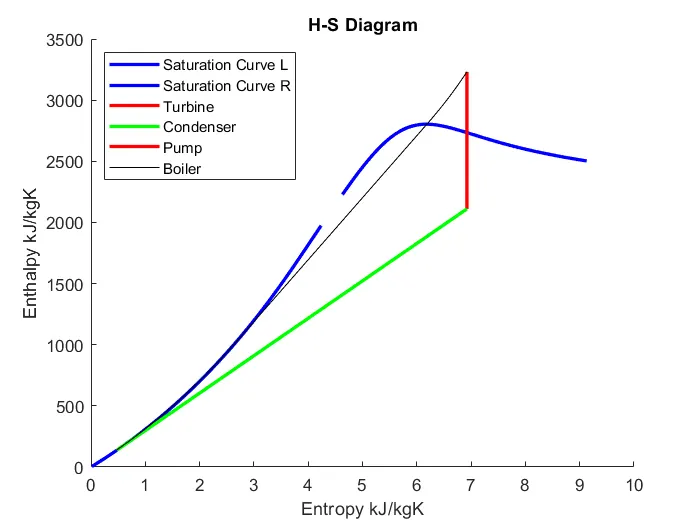
- Enthalpy - Entropy curve calculation and plotting.
- Displaying the result.
Here the given inputs values are-
- Turbine inlet temperature = 400 C.
- Turbine Inlet Pressure = 30 bars.
- Turbine Outlet Pressure = 0.05 bars = Condenser Inlet Pressure.
Main Program-
clear all
close all
clc

% inputs
disp('Rankine Cycle Simulator')
disp('1-2 corresponds to isentropic expansion in turbine')
disp('2-3 corresponds to constant pressure heat rejection in condenser')
disp('3-4 corresponds to isentropic compression in pump')
disp('4-1 corresponds to constant pressure heat addition in boiler')
fprintf('n')


p1 = input('Enter the pressure at the inlet of turbine (bar):');
t1 = input('Enter the temp at the inlet of the turbine (degree C):');
p2 = input('Enter the pressure at the inlet of condensor (bar):');

% At state point 1
h1 = XSteam('h_pT',p1,t1);
s1 = XSteam('s_pT', p1, t1);


%Since 1-2 is isentropic process
s2 = s1;
sf2 = XSteam('sL_p', p2);
sg2 = XSteam('sV_p', p2);
sfg2 = (sg2 - sf2);


%Finding dryness fraction (s2 = sf2 + x2* sfg2)
x2 = (s2 - sf2)/sfg2;
x2<1;
disp('Steam is wet at the inlet of the condenser')
fprintf('n')


%Finding Enthalpy
hf2 = XSteam ('hL_p',p2);
hg2 = XSteam ('hV_p',p2);
hfg2 = hg2 - hf2;
h2 = hf2 + x2*hfg2;
t2 = XSteam('Tsat_p',p2);

%Workdone by Turbine
wt = h1 - h2;


%Workdone by Turbine
wt = h1 - h2;


%For state point 3

%Work done by pump
p3 = p2;
vf3 = XSteam('vL_p',p3);
v3 = vf3;
wp = v3*(p1 - p2)*100;
t3 = XSteam('Tsat_p',p2);
h3 = XSteam('hL_p', p2);
s3 = XSteam('sL_p',p2);
%At point 4
p4 = p1;
h4 = wp + h3;
t4 = XSteam('T_ph',p4, h4);
s4 = s3;


%Heat supplied to boiler
qs = h1 - h4;


%Heat Rejected by condenser
qr = h2 - h3;


%Work ratios and efficiency of turbine
w_net = wt - wp;
net_work_ratio = w_net/wt;
efficiency = w_net/qs;


%back work ratio
back_work_ratio = wp/wt;


%Specific Steam Consumption
SSC = 3600/w_net;
tf_sat = XSteam('Tsat_p',p1);
sf_sat = XSteam('sL_p',p1);
hf_sat = XSteam('hL_p',p1);
sg_sat = XSteam('sV_p',p1);
hg_sat = XSteam('hV_p',p1);


%Plotting saturation liquid and vapour lines
temp_range = linspace(1,373,1000);
for i = 1:length(temp_range)
S_L(i) = XSteam('sL_T',temp_range(i));
S_V(i) = XSteam('sV_T', temp_range(i));


end


%Plotting T-S diagram
figure(1)
hold on
plot(S_L,temp_range,'b','LineWidth',2)
plot(S_V,temp_range,'b','LineWidth',2)
plot([s1 s2], [t1 t2],'r','LineWidth',2)
plot([s2 s3], [t2 t3],'g','LineWidth',2)
plot([s3 s4], [t3 t4],'b','LineWidth',2)


%Plotting curved constant pressure line 3 to 4
t_cons_p = linspace(t4, XSteam('Tsat_p',p1),30);
for i = 1:length(t_cons_p)
S(i) = XSteam('s_pt',p1,t_cons_p(i));
end
plot(S,t_cons_p,'k')
t0_cons_p = linspace(XSteam('Tsat_p',p1),t1,300);
for i=1:length(t0_cons_p)
S0(i)=XSteam('s_pt',p1,t0_cons_p(i));
end
plot(S0,t0_cons_p,'k')


%Plotting the straight line of the phase change region
plot([sf_sat sg_sat], [tf_sat tf_sat], 'k')
title('T-S diagram')
xlabel('Entropy kJ/kgK')
ylabel('Temperature In Degree C')
axis([0 10 0 700])
legend('Saturation Curve L', 'Saturation Curve R', 'Turbine', 'Condenser', 'Pump', 'Boiler', 'Location','Northwest')


%Plotting H-S diagram
figure(2)
hold on

%Plotting saturation curves
temp_range1 = linspace(1, 373, 1000);
for i=1:length(temp_range1)
H_L1(i) = XSteam('hL_T', temp_range1(i));
H_V1(i) = XSteam('hV_T', temp_range1(i));

end

plot(S_L, H_L1,'b','LineWidth',2)
plot(S_V, H_V1,'b','LineWidth',2)
plot([s1 s2], [h1 h2],'r','LineWidth',2)
plot([s2 s3], [h2 h3],'g','LineWidth',2)
plot([s3 s4], [h3 h4],'r','LineWidth',2)


%For plotting the line between the pump and boiler
s_pump = linspace(s3, s1, 1000);
for i =1:length(s_pump)
h_pump(i)=XSteam('h_ps',p1,s_pump(i));
end
plot(s_pump, h_pump, 'k')
title('H-S Diagram')
xlabel('Entropy kJ/kgK')
ylabel('Enthalpy kJ/kgK')
legend('Saturation Curve L','Saturation Curve R','Turbine','Condenser','Pump','Boiler','Location','Northwest')


%Displaying the value of state point variables at each point
P_final = [p1 p2 p3 p4];
T_final = [t1 t2 t3 t4];
H_final = [h1 h2 h3 h4];
S_final = [s1 s2 s3 s4];
for i=1:4
fprintf('At state point %d n', i)
fprintf('Pressure p%d : %4.4f (bar) n',i,P_final(i))
fprintf('Temperature t%d : %4.4f (degree C) n',i,T_final(i))
fprintf('Enthalpy h%d : %4.4f (kJ/kgK) n',i,H_final(i))
fprintf('Entropy s%d : %4.4f (kJ/kg) n',i,S_final(i))
fprintf('n')
end


fprintf('The net work ratio is: %f n', net_work_ratio)
fprintf('The back work ratio is: %f n', back_work_ratio)
fprintf('The entered values are not valid as the steam is either Saturated or Super-saturated at the inlet of the condenser n')
fprintf('Enter the valid values by running the program again n')
return;
Command Window Outputs-
Rankine Cycle Simulator
1-2 corresponds to isentropic expansion in turbine
2-3 corresponds to constant pressure heat rejection in condenser
3-4 corresponds to isentropic compression in pump
4-1 corresponds to constant pressure heat addition in boiler
state point 1 nPressure p1 : 30.0000 (bar) n
Temperature t1 : 400.0000 (degree C) n
Enthalpy h1 : 3231.5710 (kJ/kgK) n
Entropy s1 : 6.9233 (kJ/kg) nnAt state point 2 n
Pressure p2 : 0.0500 (bar) n
Temperature t2 : 32.8755 (degree C) n
Enthalpy h2 : 2110.7082 (kJ/kgK) n
Entropy s2 : 6.9233 (kJ/kg) nn
At state point 3 nPressure p3 : 0.0500 (bar) n
Temperature t3 : 32.8755 (degree C) n
Enthalpy h3 : 137.7651 (kJ/kgK) n
Entropy s3 : 0.4763 (kJ/kg) nn
At state point 4 nPressure p4 : 30.0000 (bar) n
Temperature t4 : 32.9639 (degree C) n
Enthalpy h4 : 140.7761 (kJ/kgK) n
Entropy s4 : 0.4763 (kJ/kg) nn
The net work ratio is: 0.997314 n
The back work ratio is: 0.002686
Outputs-
1) T-S Diagram-
2) H-S Diagram-