clear all
close all
clc

diary Rankine_Cycle_Results.txt

fprintf('\t\t RANKINE CYCLE SIMULATOR\n\n')
fprintf('1-2 : Isentropic Expansion in Turbine\n')
fprintf('2-3 : Constant pressure Heat Rejection by the Condensor\n')
fprintf('3-4 : Isentropic Compression in Compressor\n')
fprintf('4-1 : Constant Pressure Heat Addition by the Boiler\n\n')

%% #1 Inputs

% p_b is the Boiler Pressure; p_c is the Condensor Pressure

p_b = input('Enter the Pressure at the Turbine Inlet (Bars) : ');
T1 = input('Enter the Temperature at the Turbine Inlet (Degree Celcius) : ');
p_c = input('Enter the Pressure at the Condensor (Bars) : ');
fprintf('\t\t\t RESULTS\n')

%% #2 State Points - 1

P1 = p_b;
% T1 is user defined
%h_pT	Entalpy as a function of pressure and temperature.
H1 = XSteam('h_pT',P1,T1);
%s_pT	Specific entropy as a function of pressure and temperature (Returns saturated vapour entalpy if mixture.)
S1 = XSteam('s_pT',P1,T1);

%% #3 State Points - 2

P2 = p_c;
S2 = S1;
% Calculating T2
% T2 can be either Tsup or Tsat depending on X (Dryness Fraction) value
% T_ps	Temperature as a function of pressure and entropy
% Sv_pc is Saturated Vapor Entropy at Condensor Pressure
% Sf_pc is Saturated Liquid Entropy at Condensor Pressure
% sV_p	Saturated vapour entropy
% sL_p	Saturated liquid entropy
Sv_pc = XSteam('sV_p',P2);
Sf_pc = XSteam('sL_p',P2);

X2 = (S2-Sf_pc)/(Sv_pc-Sf_pc);

T2 = XSteam('T_ps',P2,S2);
Tsat_pc = XSteam('Tsat_p',p_c);

if T2 > Tsat_pc
    disp('Temperature at state 2 is Superheated')
else
    disp('Temperature at state 2 is Saturated')
end

% Calculating H2
%h_ps	Entalpy as a function of pressure and entropy.
H2 = XSteam('h_ps',P2,S2);

%% #4 State Points - 3

P3 = P2;
T3 = Tsat_pc;
H3 = XSteam('hL_p',P3);
S3 = Sf_pc; % Assuming no undercooling

%% #5 State Points - 4

P4 = P1;
S4 = S3;
% T_ps	Temperature as a function of pressure and entropy
T4 = XSteam('T_ps',p_b,S4);

%h_ps	Entalpy as a function of pressure and entropy.
H4 = XSteam('h_ps',p_b,S4);


%% #6 Variation of T with S in Superheated/Rarefied Region @ Boiler Pressure

% T1 Superheated/Rarefied Region

%sV_pb	Saturated vapour entropy @ Boiler Pressure
Sv_pb = XSteam('sV_p',p_b);

% Tsat_pb is Saturated Temperature @ Boiler Pressure
Tsat_pb = XSteam('Tsat_p',p_b);

% Srar_pb is the Entropy of vapor in rarefied region @ Boiler pressure
Srar_pb = linspace(Sv_pb,S1);

if T1 > Tsat_pb

% Trar_pb is Temperature in Rarefied Region @ Boiler Pressure
Trar_pb = nan(1,length(Srar_pb));

%T_ps	Temperture as a function of pressure and entropy

    for i = 1:length(Srar_pb)
        Trar_pb(i) = XSteam('T_ps',p_b,Srar_pb(i));
    end
else
    Trar_pb = nan;
end


%% #7 Variation of T with S in Superheated/Rarefied Region @ Condenser Pressure


Sv_pc = XSteam('sV_p',p_c);

% Srar_pc is the Entropy of vapor in rarefied region @ Condenser pressure
Srar_pc = linspace(Sv_pc,S2);

if T2 > Tsat_pc

% Trar_pc is Temperature in Rarefied Region @ Condenser Pressure
Trar_pc = nan(1,length(Srar_pc));

%T_ps	Temperture as a function of pressure and entropy
    for i = 1:length(Srar_pb)
        Trar_pc(i) = XSteam('T_ps',p_c,Srar_pc(i));
    end
else
    Trar_pc = nan;
end


%% #8 Variation of T with S in Subcooled/Compressed Region @ Boiler Pressure

Sf_pb = XSteam('sL_p',p_b);

% Ssub_pb is the Entropy of fluid in subcooled region @ Boiler pressure
Ssub_pb = linspace(S3,Sf_pb);

% Tsub_pb is Temperature in Subcooled Region @ Boiler Pressure
Tsub_pb = nan(1,length(Srar_pc));

for i = 1:length(Ssub_pb)
    Tsub_pb(i) = XSteam('T_ps',p_b,Ssub_pb(i));
end


%% #9 Plotting Saturated Liquid and Saturated Vapor line on T-S Diagram

figure('name','T-S Graph')

% In water, critical point occurs at 373.946 °C
%sL_T	Saturated liquid entropy
%sV_T	Saturated vapour entropy

T = linspace(1,373,500);
Sf = nan(1,numel(T));
Sv = nan(1,numel(T));

for i = 1:length(T)
    Sf(i) = XSteam('sL_T',T(i));
    Sv(i) = XSteam('sV_T',T(i));
end

hold on
plot(Sf,T,'color','g','linewidth',1.5)
plot(Sv,T,'color','g','linewidth',1.5)


%% #10 Plotting the values - T-S Graph

% Plot 1-2
plot([S1 S2],[T1 T2],'color','r','linewidth',1)
plot(S1,T1,'o','markerfacecolor','[0 0 0]')
plot(S2,T2,'o','markerfacecolor','[0 0 0]')
text(S1,T1,'\leftarrow 1')

% Plot 2-3
if any(isnan(Trar_pc))
    plot([S3 S2],[Tsat_pc Tsat_pc],'color','r','linewidth',1)
    plot(S3,T3,'o','markerfacecolor','[0 0 0]')
    text(S2,T2,'\leftarrow 2')
else
    plot(Srar_pc,Trar_pc,'color','b','linewidth',1)
    plot([S3 Sv_pc],[Tsat_pc Tsat_pc],'color','r','linewidth',1)
    plot(Sv_pc,Tsat_pc,'o','markerfacecolor','[0 0 0]')
    plot(S3,T3,'o','markerfacecolor','[0 0 0]')
    text(S2,T2,'\leftarrow 2')
    text(Sv_pc,Tsat_pc,'\leftarrow 2s')
end

% Plot 3-4
plot([S3 S4],[T3 T4],'color','r','linewidth',1)
text(S3,T3,'\leftarrow 3')

% Plot 4-1, Subcooled region
plot(Ssub_pb,Tsub_pb,'color','b','linewidth',1.5)

% Plot 4-1, Liquid-Vapor Region
plot([Sf_pb Sv_pb],[Tsat_pb Tsat_pb],'color','r','linewidth',1)
plot(Sf_pb,Tsat_pb,'o','markerfacecolor','[0 0 0]')
plot(Sv_pb,Tsat_pb,'o','markerfacecolor','[0 0 0]')
text(Sf_pb,Tsat_pb,'\leftarrow 4f')


% Plot 4-1, Rarefied/Superheated Region
if ~any(isnan(Trar_pb))
    plot(Srar_pb,Trar_pb,'color','b','linewidth',1)
    text(Sv_pb,Tsat_pb,'\leftarrow 4v')
end
hold off

xlabel('Entropy KJ/KgK')
ylabel('Temperature C')

%% #11 Plotting the H-S diagram

figure('name','H-S Graph')
hold on
% # 1-2
plot([S1 S2],[H1 H2],'color','r','linewidth',1)
text(S1,H1,'1')
% # 2-3
plot([S2 S3],[H2 H3],'color','r','linewidth',1)
text(S2,H2,'2')
% # 3-4
plot([S3 S4],[H3 H4],'color','r','linewidth',1)
text(S3,H3,'3')
% # 4-1
plot([S4 S1],[H4 H1],'color','r','linewidth',1)
text(S4,H4,'4')

%% #12 Plotting Saturated Liquid and Saturated Vapor line on H-S Diagram

Hf = nan(1,numel(T));
Hv = nan(1,numel(T));

for i = 1:length(T)
    Hf(i) = XSteam('hL_T',T(i));
    Hv(i) = XSteam('hV_T',T(i));
end

plot(Sf,Hf,'color','g','linewidth',1.5)
plot(Sv,Hv,'color','g','linewidth',1.5)
xlabel('Entropy KJ/KgK')
ylabel('Enthapy KJ/Kg')
hold off

%% #13 Back Work Ratio, Net Work Output, Thermal Efficiency & S.S.C

Wt = H1-H2;
Wp = H4-H3;
W_net = Wt-Wp;
back_work = Wp/Wt;
SSC = 3600/Wt;
Q_in = H1-H4;
N_therm = (W_net/Q_in)*100;

%% #14 Results


fprintf('At State Point 1:\n')
fprintf('P1 is : %f bar\n',P1)
fprintf('T1 is : %f degree C\n',T1)
fprintf('H1 is : %f KJ/Kg\n',H1)
fprintf('S1 is : %f KJ/KgK\n\n',S1)

fprintf('At State Point 2:\n')
fprintf('P2 is : %f bar\n',P2)
fprintf('T2 is : %f degree C\n',T2)
fprintf('H2 is : %f KJ/Kg\n',H2)
fprintf('S2 is : %f KJ/KgK\n\n',S2)

fprintf('At State Point 3:\n')
fprintf('P3 is : %f bar\n',P3)
fprintf('T3 is : %f degree C\n',T3)
fprintf('H3 is : %f KJ/Kg\n',H3)
fprintf('S3 is : %f KJ/KgK\n\n',S3)

fprintf('At State Point 4:\n')
fprintf('P4 is : %f bar\n',P4)
fprintf('T4 is : %f degree C\n',T4)
fprintf('H4 is : %f KJ/Kg\n',H4)
fprintf('S4 is : %f KJ/KgK\n\n',S4)

fprintf('Wt is : %f KJ/Kg\n',Wt)
fprintf('Wp is : %f KJ/Kg\n',Wp)
fprintf('Wnet is : %f KJ/Kg\n',W_net)
fprintf('Ntherm is : %4.2f%% KJ/KgK\n',N_therm)
fprintf('S.S.C is : %f Kg/KWh\n\n',SSC)

diary off

%% Clearing Workspace Clutter

clear Hf Hv i Q_in Sf Sf_pb Sf_pc Srar_pb Srar_pc  Sv Ssub_pb T Trar_pb Trar_pc Tsub_pb
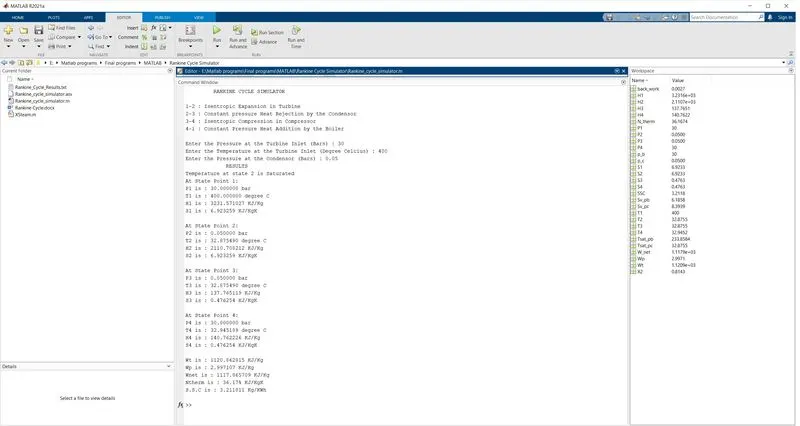
- Results Saturated condition
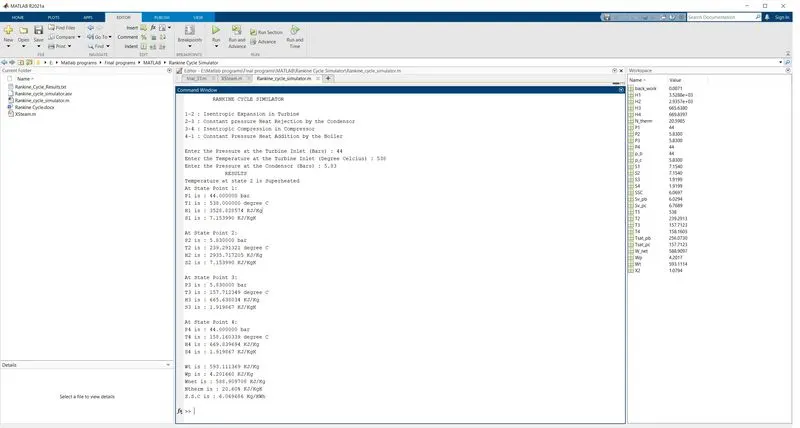
- Results Superheated condition