Project 1 - Parsing NASA thermodynamic data
clear all
close all
clc

% open THERM data in the read mode
t1 = fopen('THERMO.dat','r');

% Reading header, won't be assigning to anything, will clear off at program end
fgetl(t1);

% Reading next temperature line
gl_temp = fgetl(t1);

% Splitting the string
global_temp_split = strsplit(gl_temp);

% Converting to number,segregating and assigning to variables
global_low = str2double(global_temp_split{2});
global_mid = str2double(global_temp_split{3});
global_high = str2double(global_temp_split{4});

% Traversing the next three lines
for i = 1:3
    fgetl(t1);
end

%% Counting number of SPECIES in text file

inc = 0;
while ~feof(t1)     % while we have'nt reached the end of file...
    m = fgetl(t1);  % we capture each line and assign to output m
    m1 = strsplit(m,' ');   % We split m into cell arrays
    if strcmpi(m1{end},'1') % we compare last char value of cell array with char '1'
        inc=inc+1;          % if it's the same, we add that to our global count
    end
end

total_species = inc;    % this is total number of species in data file


fclose(t1);
%% Extracting coefficients

% Important step to convert numbers from double to exponential format
format shortE
R = 8.314;

% Skipping first few lines to get to species line
t1 = fopen('THERMO.dat','r');
for i = 1:5
    fgetl(t1);
end

%% Extracting the first species line and making changes

MW = nan(1,total_species);  % Dummy array of NaN and size(1,total_species)
species=cell(1,total_species);% Dummy array of char format of all species to store in array form
coefficients = cell(1,total_species);
% To create an array of temperatures to display in the final table
LT = cell(1,total_species);
MT = cell(1,total_species);
HT = cell(1,total_species);

tic

for i = 1:total_species

l_species1 = fgetl(t1); % Capturing the details of the 6th line
token = strtok(l_species1); % Extracting 1st character name before whitespace and assigning to output "token"
s1 = strsplit(l_species1,' ');
species{i} = s1{1};

% Converting Indexed out temperatures from char line to number format
local_temp_low1 = str2double(s1{end-3});
local_temp_mid1 = str2double(s1{end-1});
local_temp_high1 = str2double(s1{end-2});

LT{i} = local_temp_low1;
MT{i} = local_temp_mid1;
HT{i} = local_temp_high1;

%% Extracting first "coefficient line"; Getting value for a1

c_line1 = fgetl(t1);
% Finding all positions of E in that line
p1 = strfind(c_line1,'E');
% Extracting the first number in 'char' format
a1 = c_line1(1:p1(1)+3);
% Converting first coefficient string into number format
a1 = str2double(a1);

%% Working on coefficient 2 to 5
% Creating a dummy pre allocated array
dummy1 = nan(1,5);

for u = 2:5
    b = c_line1(p1(u-1)+4:p1(u)+3); % Extracting value
    c = str2double(b);              % Convert to number and assign to output c
    dummy1(u) = c;                  % Storing c into predefined array 'dummy'
end

% Extracting values from array 'dummy1' and assigning to coefficients a2 to a5
a2 = dummy1(2);
a3 = dummy1(3);
a4 = dummy1(4);
a5 = dummy1(5);

%% Extracting second "coefficient line"; Getting value for a6

c_line2 = fgetl(t1);
% Finding all positions of E in that line
p2 = strfind(c_line2,'E');
% Extracting the first number in 'char' format
a6 = c_line2(1:p2(1)+3);
% Converting first coefficient string into number format
a6 = str2double(a6);


%% Working on coefficient a7 to a10
% Creating a dummy pre allocated array
dummy2 = nan(1,5);

for u = 2:5
    b = c_line2(p2(u-1)+4:p2(u)+3);     % Extracting value
    c = str2double(b);                  % Convert to number and assign to output c
    dummy2(u) = c;                      % Storing c into predefined array 'dummy'
end

% Extracting values from array 'dummy2' and assigning to coefficients a7 to a10
a7 = dummy2(2);
a8 = dummy2(3);
a9 = dummy2(4);
a10 = dummy2(5);


%% Extracting third "coefficient line"; Getting value for a11

c_line3 = fgetl(t1);
% Finding all positions of E in that line
p3 = strfind(c_line3,'E');
% Extracting the first number in 'char' format
a11 = c_line3(1:p3(1)+3);
% Converting first coefficient string into number format
a11 = str2double(a11);


%% Working on coefficient a12 to a14
% Creating a dummy pre allocated array
dummy3 = nan(1,4);

for u = 2:4
    b = c_line3(p3(u-1)+4:p3(u)+3);     % Extracting value
    c = str2double(b);                  % Convert to number and assign to output c
    dummy3(u) = c;                      % Storing c into predefined array 'dummy3'
end

% Extracting values from array 'dummy3' and assigning to coefficients a7 to a10
a12 = dummy3(2);
a13 = dummy3(3);
a14 = dummy3(4);

coeffs = [a1,a2,a3,a4,a5,a6,a7,a8,a9,a10,a11,a12,a13,a14];
coefficients{i} = coeffs;

T_local = linspace(local_temp_low1,local_temp_high1,500);

%% Calculating Specific heats, Enthapy, Entropy and Molecular Weight

cp = specific_heat(local_temp_mid1,a1,a2,a3,a4,a5,a8,a9,a10,a11,a12,R,T_local);

H = enthalpy(a1,a2,a3,a4,a5,a6,a8,a9,a10,a11,a12,a13,R,local_temp_mid1,T_local);

[S] = entropy_therm(a1,a2,a3,a4,a5,a7,a8,a9,a10,a11,a12,a14,R,local_temp_mid1,T_local);

MW(i) = molecular_weight(token);


%% Plotting and storing the data in individual folders

plotting_thermdata(cp,H,S,T_local,token)

end

study_time = toc;

%% Clearing Workspace clutter

clear inc m;
clear dummy1 dummy2 dummy3 p1 p2 p3 l_species1 c_line1 c_line2 c_line3 ans
clear gl_temp global_temp_split m1 b coeffs i token u s1 local_temp_low1
clear a1 a2 a3 a4 a5 a6 a7 a8 a9 a10 a11 a12 a13 a14 local_temp_high1 local_temp_mid1

%% Display in Command Window

format short
row = (1:total_species);
Table = table(species',MW',LT',MT',HT');
Table.Properties.RowNames = strsplit(num2str(row));
Table.Properties.VariableNames = {'Species','Molecular_mass','Lower_Temp','Mid_Temp','High_Temp'};

display(Table)


FUNCTION FILE FOR SPECIFIC HEAT

function [cp] = specific_heat(local_temp_mid1,a1,a2,a3,a4,a5,a8,a9,a10,a11,a12,R,T_local)

        % If temperature is greater than global mid value, we take higher
        % coefficients
cp = nan(1,numel(T_local));

for k = 1:length(T_local)


    if T_local(k) > local_temp_mid1

        cp(k) = R.*(a1 + (a2.*T_local(k)) + (a3.*T_local(k).^2) + (a4.*T_local(k).^3) + (a5.*T_local(k).^4));

    else

        % Else, we take lower coefficients

        cp(k) = R.*(a8 + (a9.*T_local(k)) + (a10.*T_local(k).^2) + (a11.*T_local(k).^3) + (a12.*T_local(k).^4));

    end

end
end

FUNCTION FILE FOR ENTHALPY

function H = enthalpy(a1,a2,a3,a4,a5,a6,a8,a9,a10,a11,a12,a13,R,local_temp_mid1,T_local)

H = nan(1,numel(T_local));

for o = 1:numel(T_local)

    if T_local(o) > local_temp_mid1

        H(o) = R.*T_local(o).*(a1 + a2.*(T_local(o)./2) + a3.*(T_local(o).^2)./3 + a4.*(T_local(o).^3)./4 + a5.*(T_local(o).^4)./5 + a6./T_local(o));

    else

        H(o) = R.*T_local(o).*(a8 + a9.*(T_local(o)./2) + a10.*(T_local(o).^2)./3 + a11.*(T_local(o).^3)./4 + a12.*(T_local(o).^4)./5 + a13./T_local(o));

    end

end

end

FUNCTION FILE FOR ENTROPY_THERM

function [S] = entropy_therm(a1,a2,a3,a4,a5,a7,a8,a9,a10,a11,a12,a14,R,local_temp_mid1,T_local)

S = nan(1,numel(T_local));

for q = 1:numel(T_local)


    if T_local(q) > local_temp_mid1

        S(q) = R.*((a1.*log(T_local(q))) + (a2.*T_local(q)) + (a3.*((T_local(q)).^2)./2) + (a4.*((T_local(q)).^3)./3) + (a5.*((T_local(q)).^4)./4) + a7);

    else

        S(q) = R.*((a8.*log(T_local(q))) + (a9.*T_local(q)) + (a10.*((T_local(q)).^2)./2) + (a11.*((T_local(q)).^3)./3) + (a12.*((T_local(q)).^4)./4) + a14);

    end

end

end

FUNCTION FILE FOR MOLECULAR_WEIGHT

function MW = molecular_weight(token)

% defining the atomic names
atomic_names = {'C','H','O','N','R'};

% Defining their atomic weights
atomic_mass = [12 1 16 14 40];
MW = 0;

for i = 1:length(token)
    for j=1:length(atomic_names)
        if strcmp(token(i),atomic_names(j))
           MW= MW + atomic_mass(j);
           hold_position = j;
        end
    end
    n = str2double(token(i));
    if n>1
        MW = MW + (n-1)*atomic_mass(hold_position);
    end
end

end

FUNCTION FILE FOR PLOTTING_THERMDATA

function plotting_thermdata(cp,H,S,T_local,token)


% pwd identifies the current folder
% cd changes the current folder

cd(pwd)
directory_name = token;
mkdir(directory_name);


figure(1)
plot(T_local,cp,'linewidth',2.5,'color','r')
grid on
title(sprintf('Specific Heat vs. Temperature for %s',token))
xlabel('Temperature [K]')
ylabel('Specific Heat [KJ/KgK]')


figure(2)
plot(T_local,H,'linewidth',2.5,'color','g')
grid on
title(sprintf('Enthalpy vs. Temperature for %s',token))
xlabel('Temperature [K]')
ylabel('Enthalpy [KJ/mol]')


figure(3)
plot(T_local,S,'linewidth',2.5,'color','b')
grid on
title(sprintf('Entropy vs. Temperature for %s',token))
xlabel('Temperature [K]')
ylabel('Entropy [KJ/K]')

% Saving within the species directory

cd(directory_name)

saveas(figure(1),'cp vs T.png') % this method works too
saveas(2,'H vs T.png')
saveas(3,'S vs T.png')

cd ..

end
Errors,Conclusions,References and attachments are all in the report.
Attaching images here too...
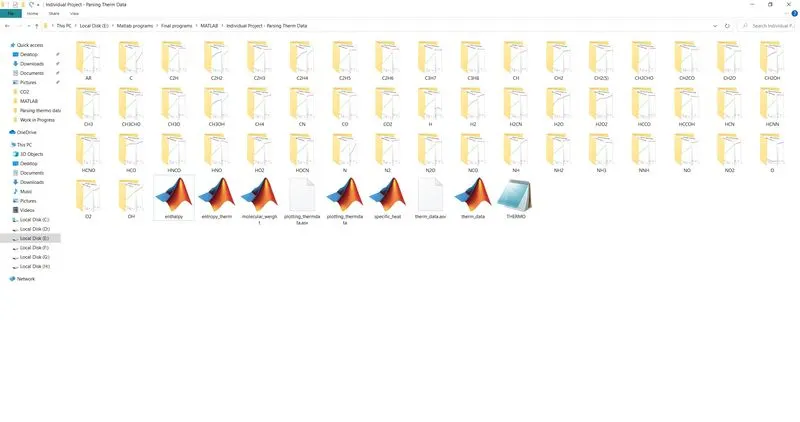
All Folders
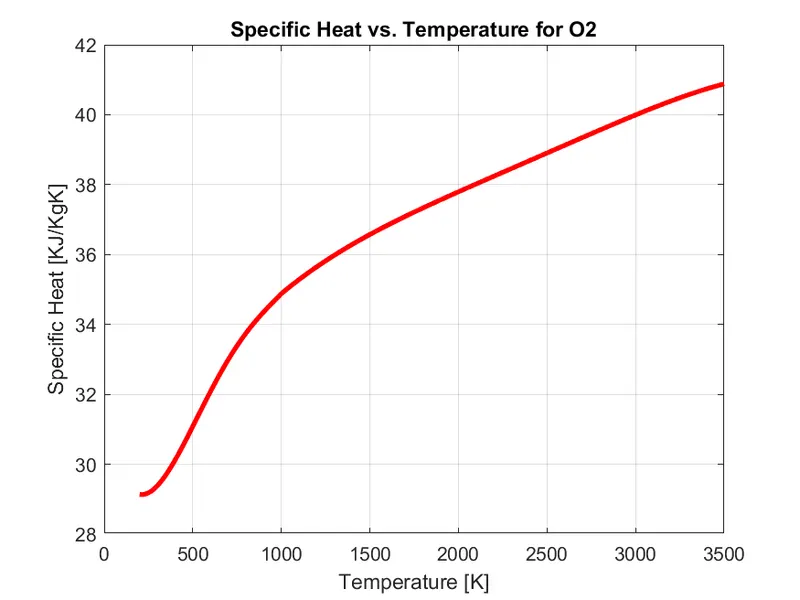
cp vs T
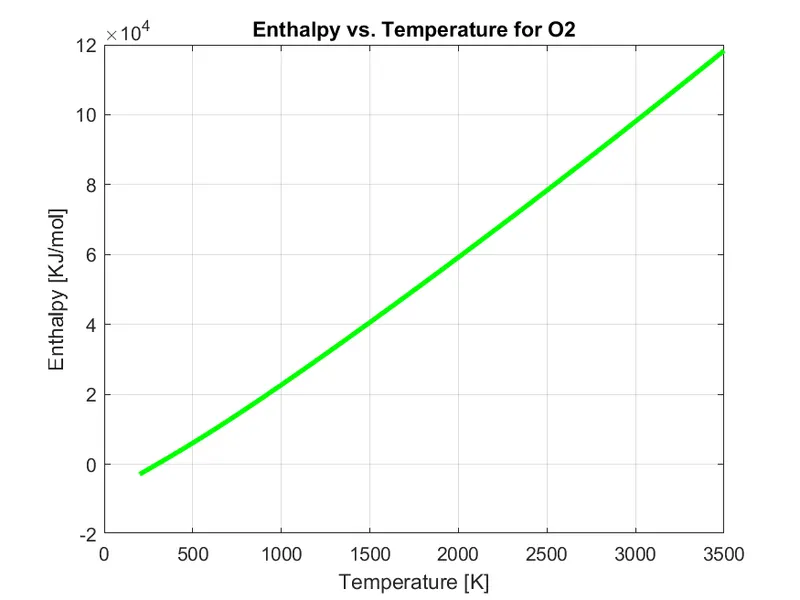
H vs T for O2
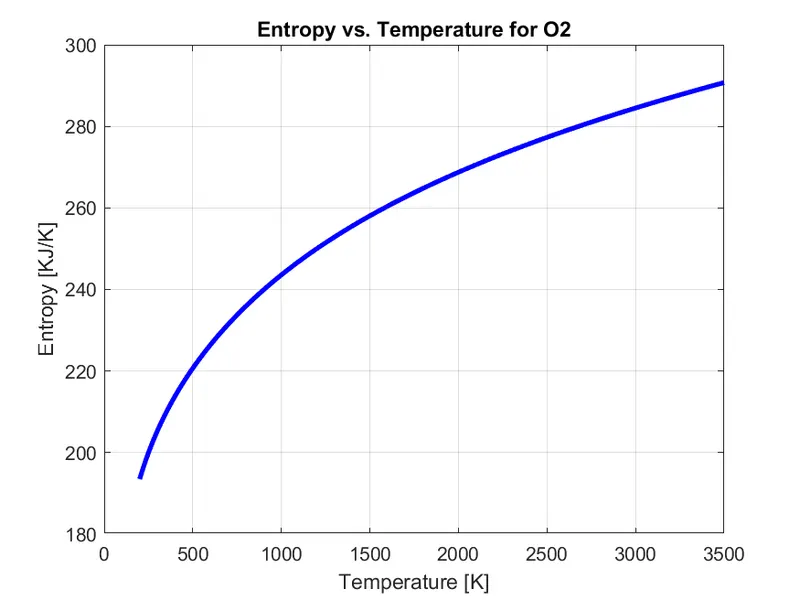
S vs T on O2
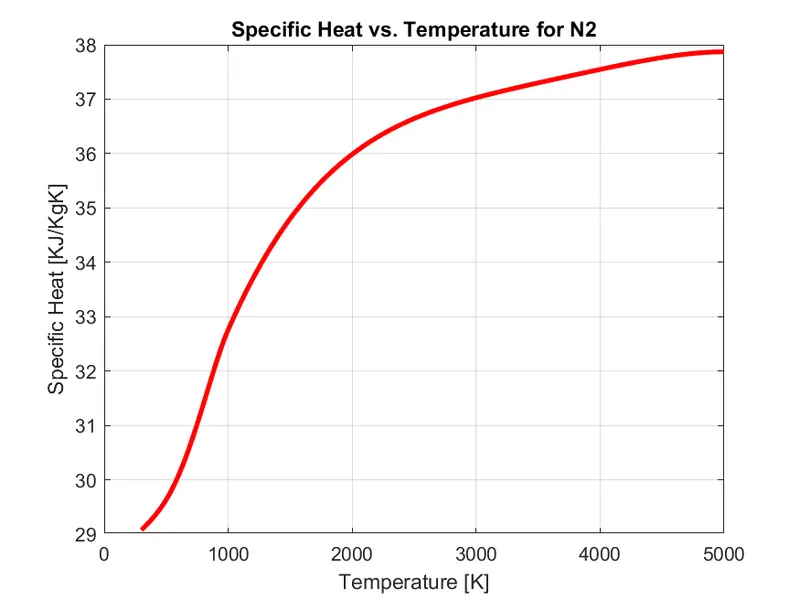
cp vs T for N2
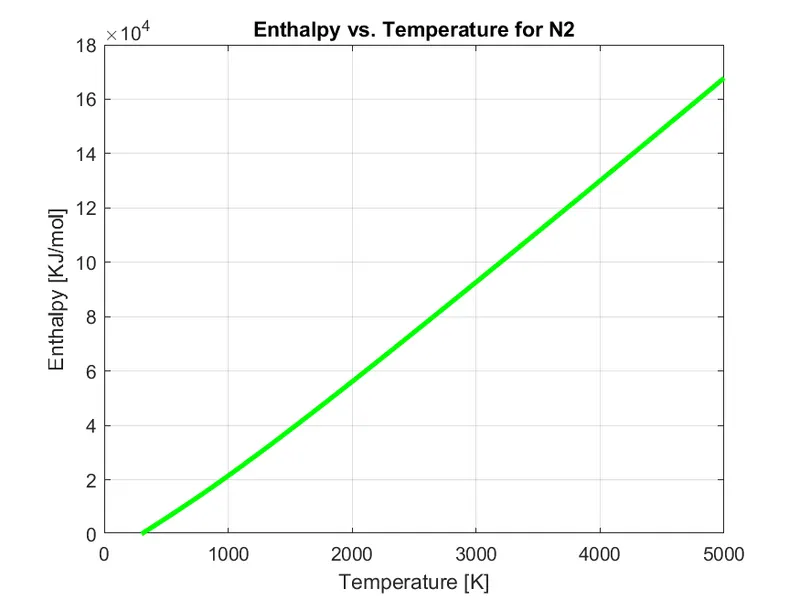
H vs T for N2
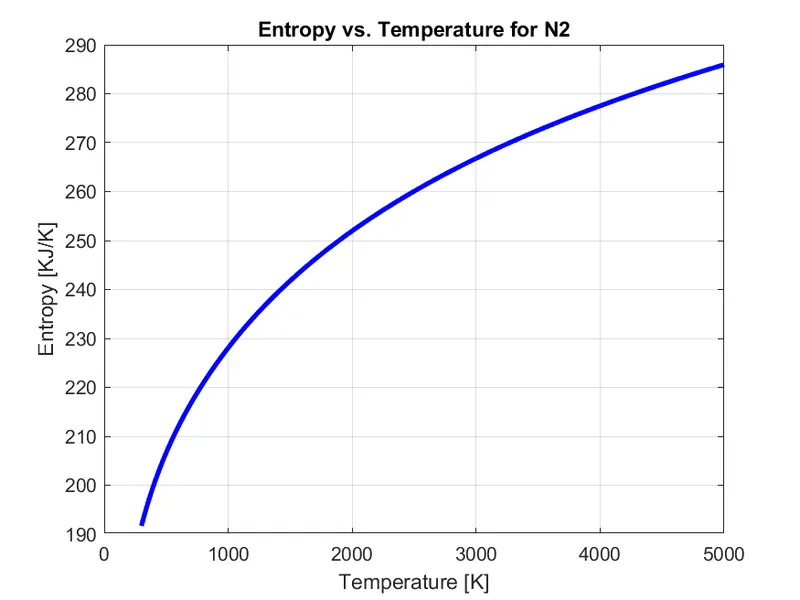
S vs T for N2
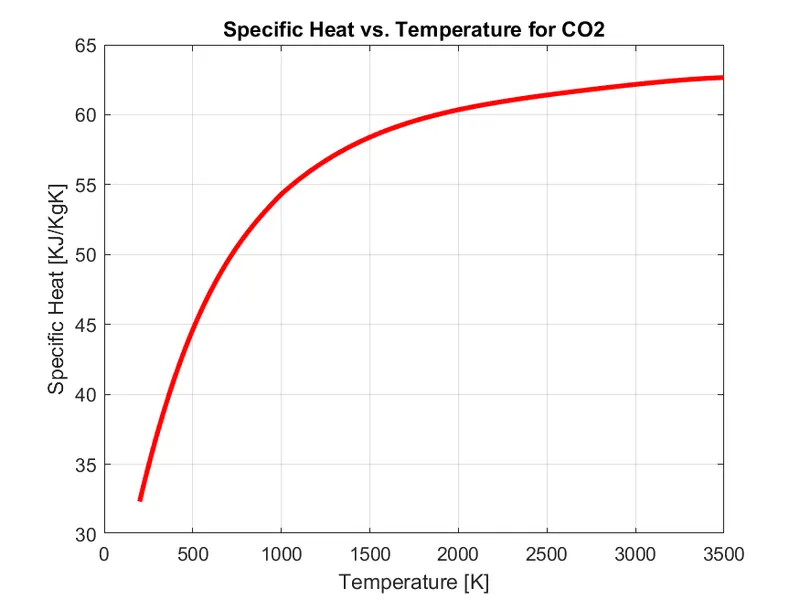
cp vs T for CO2
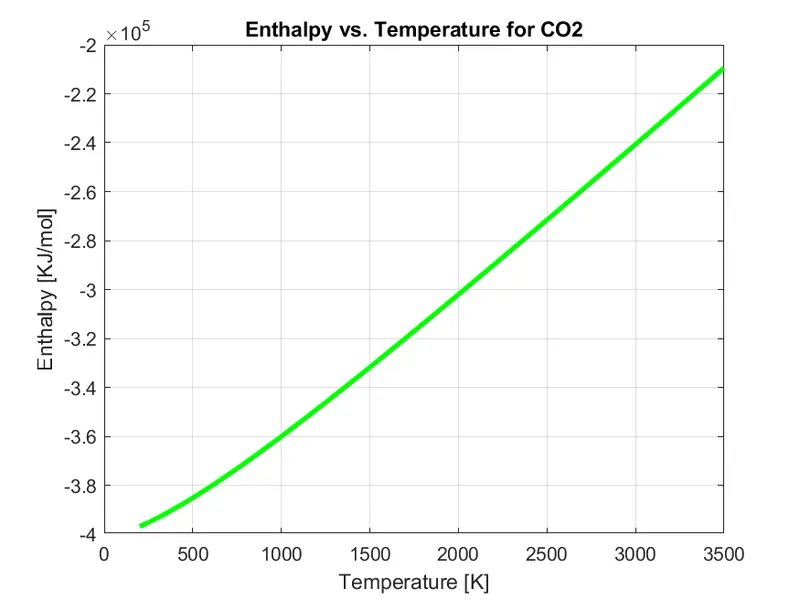
H vs T for CO2
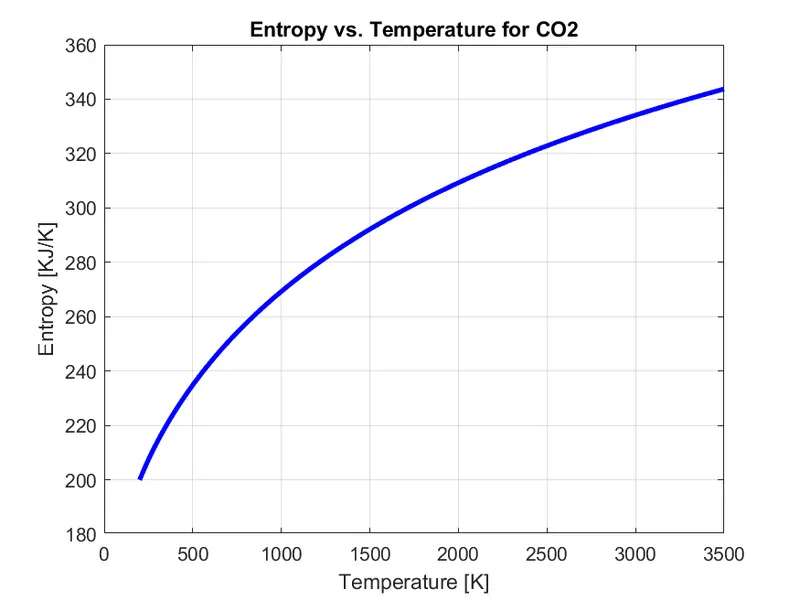
S vs T for CO2
Point not mentioned in the report.
- In user defined function script, the last line before end, is cd ..
- "cd .." means one level up from the current folder.
- This basically means, after we are done storing the plots in the species folder, we get back to the main folder by using this built-in MATLAB function. and a new folder of another species is made wherein 3 more of those plots are stored.