Project 2 - EDA on Vehicle Insurance Customer Data
Project Aim: Exploratory Data Analysis on Vehicle Insurance Customer Data
Explaination:
For this project two secondary data file are been used where first file has the reading of costumer policy details and second file consist of cstomer details. Firstly all the rows are been drop without customer id has the id can't be aprroximated. Later the empty numeric file have been filled using mean and the values for categorical value are replaced by mode. Now the outliers are replace all outlier values for numeric columns by mean. After that removing all the whitespace and case correction. Later both the files are been merged.
After that the information are been taken.
For EDA:
First step is to importing libraries.
import pandas as pd
import matplotlib.pyplot as pyplot
Second step is to import csv files.
cp = pd.read_csv('customer_policy_details.csv')
cp = cp.rename({'0':'Customer_id','1':'Annual Premium (in Rs)','2':'Sales_channel_code',
                '3':'Vintage','4':'Response'}, axis=1)
print(cp)

cd = pd.read_csv('customer_details.csv')
cd = cd.rename({'0':'Customer_id','1':'Gender','2':'Age','3':'Driving_licence_present',
                '4':'Region code','5':'Previously insured','6':'Vehicle age',
                '7':'Vehicle damage'}, axis=1)

print(cd)
Third step is to generate summary of null value.
#Generating the null value count
print('-'*30,'Null Value count for customer_policy_details','-'*30)
a = cp['Customer_id'].isna().sum()
b = cp['Annual Premium (in Rs)'].isna().sum()
c = cp['Sales_channel_code'].isna().sum()
d = cp['Vintage'].isna().sum()
e = cp['Response'].isna().sum()

print ('Total null value for Customer_id are: ',a)
print ('Total null value for Annual Premium (in Rs) are: ',b)
print ('Total null value for Sales_channel_code are: ',c)
print ('Total null value for Vintage are: ',d)
print ('Total null value for Response are: ',e)

print('-'*30,'Null Value count for customer_details','-'*30)
f = cd['Customer_id'].isna().sum()
g = cd['Gender'].isna().sum()
h = cd['Age'].isna().sum()
i = cd['Driving_licence_present'].isna().sum()
j = cd['Region code'].isna().sum()
k = cd['Previously insured'].isna().sum()
l = cd['Vehicle age'].isna().sum()
m = cd['Vehicle damage'].isna().sum()

print ('Total null value for Customer_id are: ',f)
print ('Total null value for Gender are: ',g)
print ('Total null value for Age are: ',h)
print ('Total null value for Driving_licence_present are: ',i)
print ('Total null value for Region code are: ',j)
print ('Total null value for Previously insured are: ',k)
print ('Total null value for Vehicle age are: ',l)
print ('Total null value for Vehicle damage are: ',m)
Dropping all row with null customer id:
cp.dropna(subset=['Customer_id'],inplace=True)
cd.dropna(subset=['Customer_id'],inplace=True)

print('Number of cells of Customer_id with null values = ', cd['Customer_id'].isnull().sum())
print('Number of cells of Customer_id with null values = ', cp['Customer_id'].isnull().sum())
Replacing all null values for numeric columns by mean in customer policy table and customer details:
ap = cp['Annual Premium (in Rs)'].fillna(cp['Annual Premium (in Rs)'].mean(),inplace=True)
sc =cp['Sales_channel_code'].fillna(cp['Sales_channel_code'].mean(),inplace=True)
vi = cp['Vintage'].fillna(cp['Vintage'].mean(),inplace=True)
re =cp['Response'].fillna(cp['Response'].mean(),inplace=True)

ag = cd['Age'].fillna(cd['Age'].mean(),inplace=True)
dl = cd['Driving_licence_present'].fillna(cd['Driving_licence_present'].mean(),inplace=True)
rc = cd['Region code'].fillna(cd['Region code'].mean(),inplace=True)
pi = cd['Previously insured'].fillna(cd['Previously insured'].mean(),inplace=True)
Replacing all null values for Categorical columns by mode in customer details:
ge = cd['Gender'].fillna(cd['Gender'].mode(),inplace=True)
va = cd['Vehicle age'].fillna(cd['Vehicle age'].mode(),inplace=True)
vd = cd['Vehicle damage'].fillna(cd['Vehicle damage'].mode(),inplace=True)
Printing any null value left.
print ('Total null value for Annual Premium (in Rs) are: ',ap)
print ('Total null value for Sales_channel_code are: ',sc)
print ('Total null value for Vintage are: ',vi)
print ('Total null value for Response are: ',re)
print ('Total null value for Gender are: ',ge)
print ('Total null value for Age are: ',ag)
print ('Total null value for Driving_licence_present are: ',dl)
print ('Total null value for Region code are: ',rc)
print ('Total null value for Previously insured are: ',pi)
print ('Total null value for Vehicle age are: ',va)
print ('Total null value for Vehicle damage are: ',vd)
Generate a summary of count of all the outliers column wise and replace all outlier values for numeric columns by mean.
cd_limit = {}
def Outliner(i):
    computations = cd[i].describe(percentiles=[.25, .75])
    mean = computations.values[1]
    Q1 = computations.values[4] # 25%
    Q3 = computations.values[6] # 75%
    IQR = Q3-Q1
    ll = Q1 - 1.5*IQR # lower limit
    hl = Q3 + 1.5*IQR # higher limit
    cd_limit[i] = (ll,hl)
    return cd_limit
Outliner('Age')
Outliner('Driving_licence_present')
Outliner('Region code')
Outliner('Previously insured')

cd_limit

table1_outliner = {'Age':0, 'Driving_licence_present':0, 'Region code':0, 'Previously insured':0}

for j in cd.index:
        if (cd_limit['Age'][0]!=cd_limit['Age'][1]) and (cd.loc[j, 'Age']>cd_limit['Age'][1] or cd.loc[j, 'Age']<cd_limit['Age'][0]):
            table1_outliner['Age']+=1
for j in cd.index:
        if (cd_limit['Driving_licence_present'][0]!=cd_limit['Driving_licence_present'][1]) and (cd.loc[j, 'Driving_licence_present']>cd_limit['Driving_licence_present'][1] or cd.loc[j, 'Driving_licence_present']<cd_limit['Driving_licence_present'][0]):
            table1_outliner['Driving_licence_present']+=1

for j in cd.index:
        if (cd_limit['Region code'][0]!=cd_limit['Region code'][1]) and (cd.loc[j, 'Region code']>cd_limit['Region code'][1] or cd.loc[j, 'Region code']<cd_limit['Region code'][0]):
            table1_outliner['Region code']+=1
for j in cd.index:
        if (cd_limit['Previously insured'][0]!=cd_limit['Previously insured'][1]) and (cd.loc[j, 'Previously insured']>cd_limit['Previously insured'][1] or cd.loc[j, 'Previously insured']<cd_limit['Previously insured'][0]):
            table1_outliner['Previously insured']+=1

table1_outliner

for j in cd.index:
    if cd.loc[j, 'Age']<cd_limit['Age'][0]:
        cd.loc[j, 'Age']=cd['Age'].mean()
    if cd.loc[j, 'Age']>cd_limit['Age'][1]:
        cd.loc[j, 'Age']=cd['Age'].mean()
for j in cd.index:
    if cd.loc[j, 'Driving_licence_present']<cd_limit['Driving_licence_present'][0]:
        cd.loc[j, 'Driving_licence_present']=cd['Driving_licence_present'].mean()
    if cd.loc[j, 'Driving_licence_present']>cd_limit['Driving_licence_present'][1]:
        cd.loc[j, 'Driving_licence_present']=cd['Driving_licence_present'].mean()
for j in cd.index:
    if cd.loc[j, 'Region code']<cd_limit['Region code'][0]:
        cd.loc[j, 'Region code']=cd['Region code'].mean()
    if cd.loc[j, 'Region code']>cd_limit['Region code'][1]:
        cd.loc[j, 'Region code']=cd['Region code'].mean()
for j in cd.index:
    if cd.loc[j, 'Previously insured']<cd_limit['Previously insured'][0]:
        cd.loc[j, 'Previously insured']=cd['Previously insured'].mean()
    if cd.loc[j, 'Previously insured']>cd_limit['Previously insured'][1]:
        cd.loc[j, 'Previously insured']=cd['Previously insured'].mean()

cp_limit = {}
def Outliner(i):
    computations = cp[i].describe(percentiles=[.25, .75])
    mean = computations.values[1]
    Q1 = computations.values[4] # 25%
    Q3 = computations.values[6] # 75%
    IQR = Q3-Q1
    ll = Q1 - 1.5*IQR # lower limit
    hl = Q3 + 1.5*IQR # higher limit
    cp_limit[i] = (ll,hl)
    return cp_limit
Outliner('Annual Premium (in Rs)')
Outliner('Sales_channel_code')
Outliner('Response')
Outliner('Vintage')

cp_limit

table2_outliers = {'Annual Premium (in Rs)':0, 'Sales_channel_code':0, 'Region code':0, 'Previously insured':0}

for j in cp.index:
        if (cp_limit['Annual Premium (in Rs)'][0]!=cp_limit['Annual Premium (in Rs)'][1]) and (cp.loc[j, 'Annual Premium (in Rs)']>cp_limit['Annual Premium (in Rs)'][1] or cp.loc[j, 'Annual Premium (in Rs)']<cp_limit['Annual Premium (in Rs)'][0]):
            table2_outliers['Annual Premium (in Rs)']+=1
for j in cp.index:
    if (cp_limit['Sales_channel_code'][0]!=cp_limit['Sales_channel_code'][1]) and (cp.loc[j, 'Sales_channel_code']>cp_limit['Sales_channel_code'][1] or cp.loc[j, 'Sales_channel_code']<cp_limit['Sales_channel_code'][0]):
            table2_outliers['Sales_channel_code']+=1
for j in cp.index:
    if (cp_limit['Response'][0]!=cp_limit['Response'][1]) and (cp.loc[j, 'Response']>cp_limit['Response'][1] or cp.loc[j, 'Response']<cp_limit['Response'][0]):
            table2_outliers['Response']+=1
for j in cp.index:
    if (cp_limit['Vintage'][0]!=cp_limit['Vintage'][1]) and (cp.loc[j, 'Vintage']>cp_limit['Vintage'][1] or cp.loc[j, 'Vintage']<cp_limit['Vintage'][0]):
            table2_outliers['Vintage']+=1

table2_outliers

for j in cp.index:
    if cp.loc[j, 'Annual Premium (in Rs)']<cp_limit['Annual Premium (in Rs)'][0]:
        cp.loc[j, 'Annual Premium (in Rs)']=cp['Annual Premium (in Rs)'].mean()
    if cp.loc[j, 'Annual Premium (in Rs)']>cp_limit['Annual Premium (in Rs)'][1]:
        cp.loc[j, 'Annual Premium (in Rs)']=cp['Annual Premium (in Rs)'].mean()
for j in cp.index:
    if cp.loc[j, 'Sales_channel_code']<cp_limit['Sales_channel_code'][0]:
        cp.loc[j, 'Sales_channel_code']=cp['Sales_channel_code'].mean()
    if cp.loc[j, 'Sales_channel_code']>cp_limit['Sales_channel_code'][1]:
        cp.loc[j, 'Sales_channel_code']=cp['Sales_channel_code'].mean()
for j in cp.index:
    if cp.loc[j, 'Response']<cp_limit['Response'][0]:
        cp.loc[j, 'Response']=cp['Response'].mean()
    if cp.loc[j, 'Response']>cp_limit['Response'][1]:
        cp.loc[j, 'Response']=cp['Response'].mean()
for j in cp.index:
    if cp.loc[j, 'Vintage']<cp_limit['Vintage'][0]:
        cp.loc[j, 'Vintage']=cp['Vintage'].mean()
    if cp.loc[j, 'Vintage']>cp_limit['Vintage'][1]:
        cp.loc[j, 'Vintage']=cp['Vintage'].mean()
Removing whitespace and Case correction.
# Remove Whitespaces for customer policy
cp.apply(lambda x: x.str.strip() if x.dtype == "object" else x)

# Remove Whitespaces for customer details
cd.apply(lambda x: x.str.strip() if x.dtype == "object" else x)

# Case correction for customer policy
cp.apply(lambda x: x.str.lower() if x.dtype == "object" else x)

# Case correction for customer details
cd.apply(lambda x: x.str.lower() if x.dtype == "object" else x)
Droping duplicate rows
# Dropping duplicate rows for customer policy
cp.drop_duplicates(inplace=True)
# Dropping duplicate rows for customer details
cd.drop_duplicates(inplace=True)
Merging the tables.
# Creating a master table
final_table = pd.merge(cp, cd, on='Customer_id',)
final_table
Getting information according.
# Getting information
# 1. Gender wise average annual premium
final_table.groupby('Gender')['Annual Premium (in Rs)'].mean()
# 2. Age wise average annual premium
result = final_table.groupby('Age')['Annual Premium (in Rs)'].mean()
result.plot()
pyplot.show()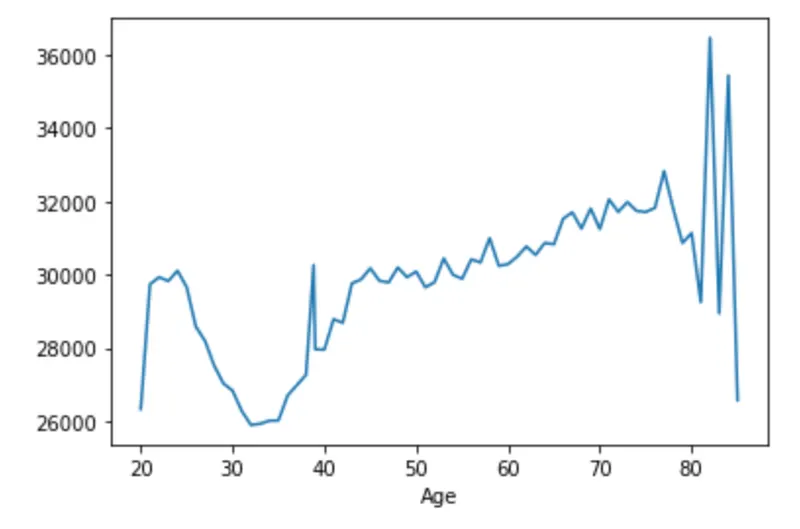
Fig 2. Age vs Annual Premium
# 3. Is your data balanced between the genders?
print(f"Balanced data ratio: {50/50}")
print(f"Slightly balanced data ratio: {round(55/45,2)}-{60/40}")
print(f"Imbalanced data ratio: {80/20}-{90/10}")
print(f"Male to Female ratio is {round(final_table['Gender'].value_counts()[0]/final_table['Gender'].value_counts()[1],2)}")

print('So, the data is between balanced and slightly blanced')
# 4. Vehicle age wise average annual premium.
result4_4 = final_table.groupby('Vehicle age')['Annual Premium (in Rs)'].mean()
result4_4.plot()
pyplot.show()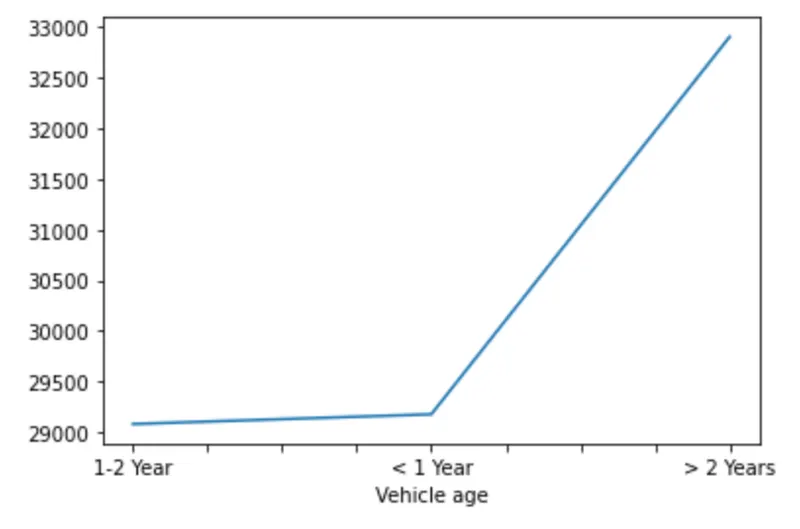
Fig 2. Vehicle age vs Annual Premium
Checking any relation between Person Age and annual premium
# Checking any relation between Person Age and annual premium.
n = final_table['Age'].corr(final_table['Annual Premium (in Rs)'])
if n<-0.5:
    print("Strong negative relationship")
if n>0.5:
    print("Strong positive relationship")
if n>-0.5 and n<0.5:
    print("There is no relationship!")
Resultant table:
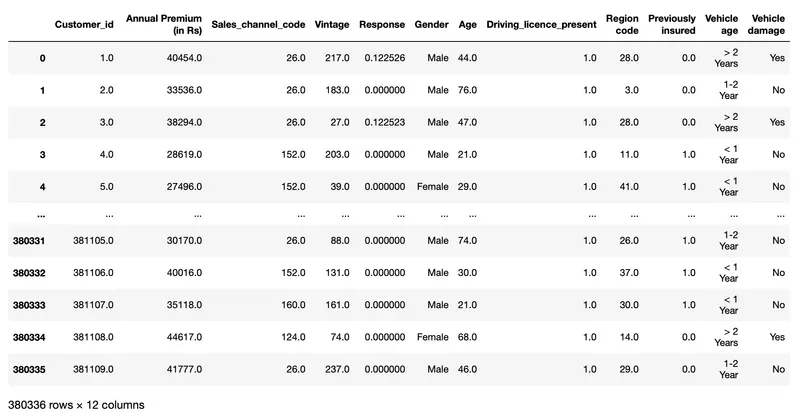
Fig 3. The final data file