In this Project have to design development of a forward energy-based fuel consumption model of a P1 hybrid vehicle
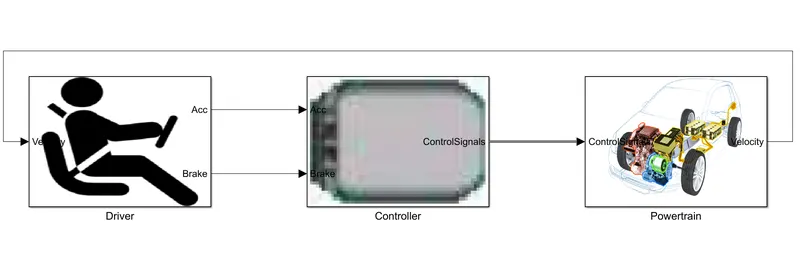
I had created 3 subsystems namely Driver,Controller, powertrain
As a driver he/she has to control on his own depends on the situation acc or brake
In controller which controls the signals which driver has used
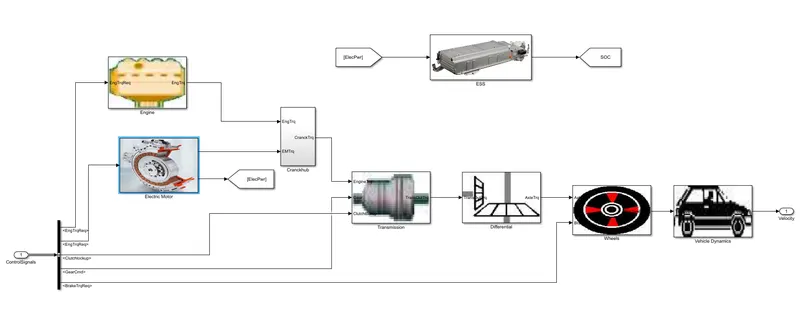
In powertrain thsese signals sends to the powertrain.
Driver:
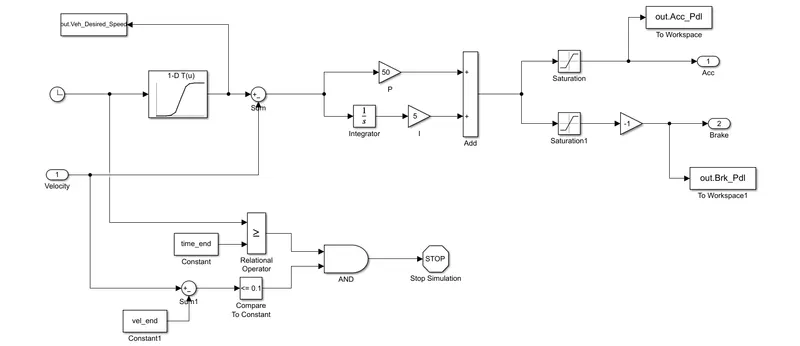
As shown in the above figure clock block is connected to the 1_d lookup table which sums up and send to the integrator.
In saturation block (Acc) set to max speed is 100.
Controller:
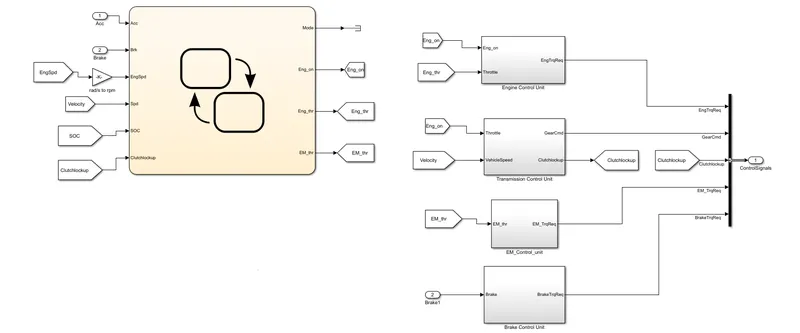
As shown in above is controller block.if we explore this will open up.
I got 6 inputs as Acc,brk,EngSpd which is converted from rad/s to rpm(9.54),velocity,SOC,clutchlockup
These inputs are connected to the chart.If i expand chart below chart will open up
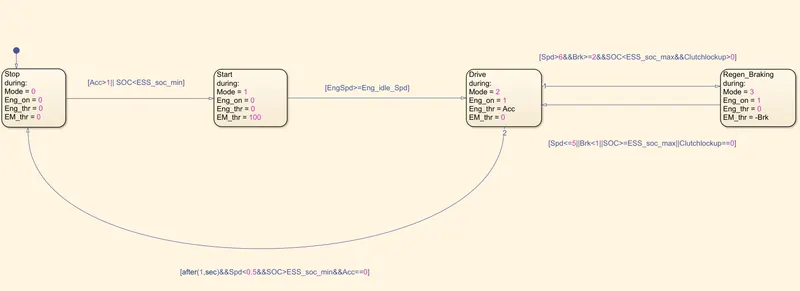
In this chart I used 4 Modes
1st mode:
The engine is in stop mode which means vehicle,engine,electric motor is in stop condition.
2nd Mode:
In this mode vehicle is started through EM_throttle thats why its 100
3rd Mode:
It is drive mode vehicle is continously moving thats why Eng_on = 1,Eng_thr = Acc
4th Mode:
It is regen braking which means that any collision happens infront of us we use brakes by using this breaking in hybrid vehicle
gives power to the Electric motor
output of chart:
I had 4 outputs are Mode,Eng_on,Eng_thr,EM_thr
These outputs are connected to the other blocks
Mode is connected to terminator.
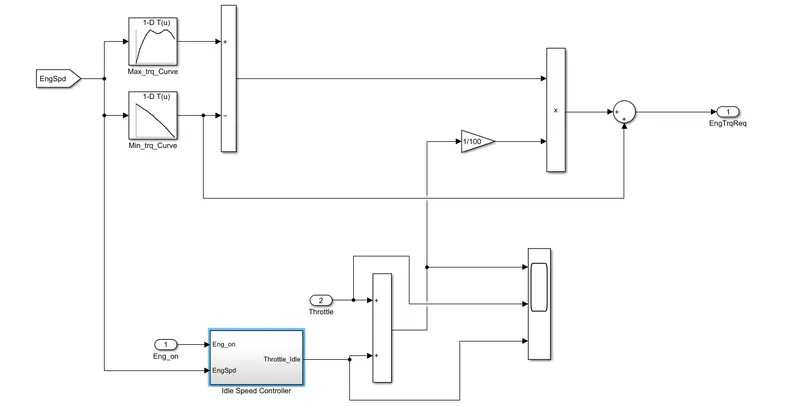
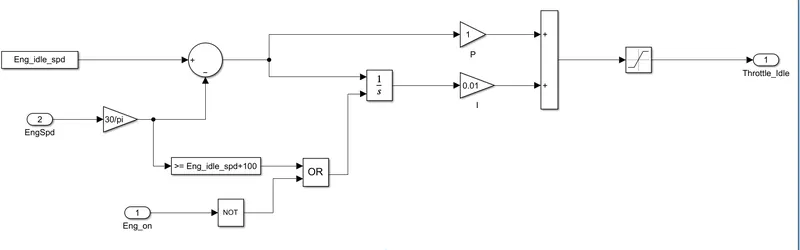
Eng_on is connected to Engine control unit and transmission control unit.
Eng_thr is connected to Engine control unit.
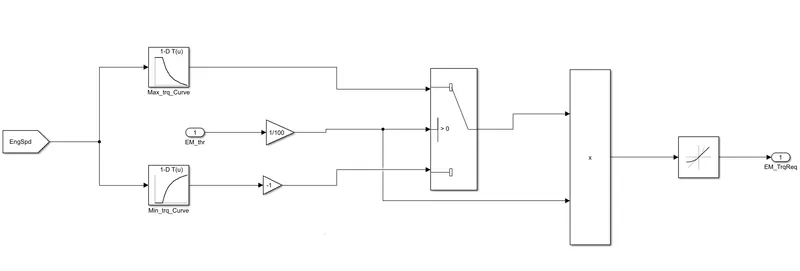
EM_thr is connected to electric motor control unit.
Engine control unit:
Idle speed controller:
Transmission control unit:
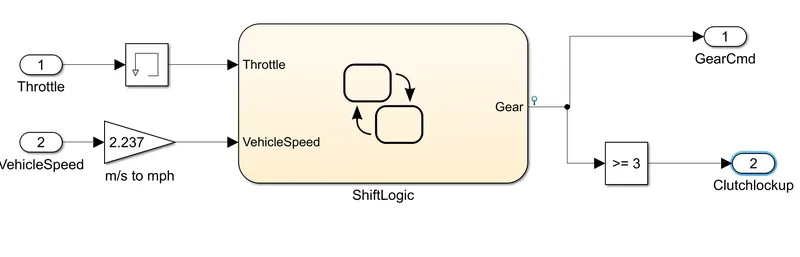
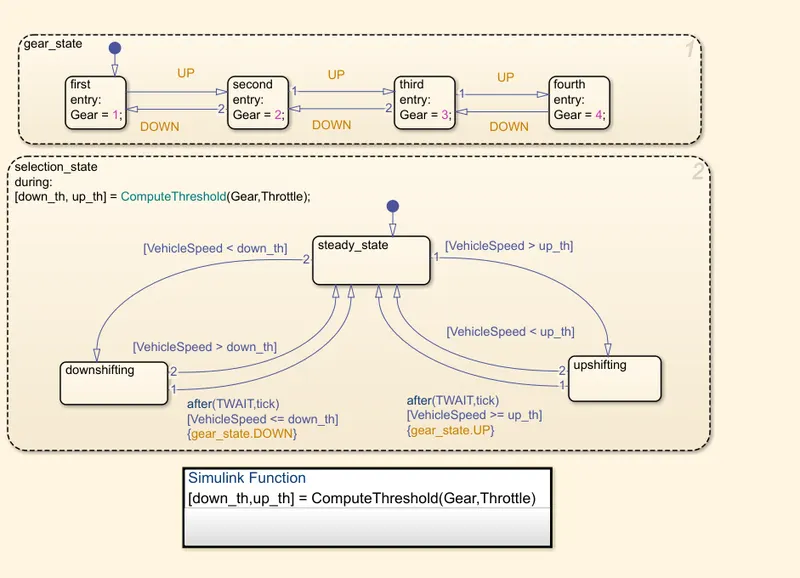
shift logic:
EM control unit:
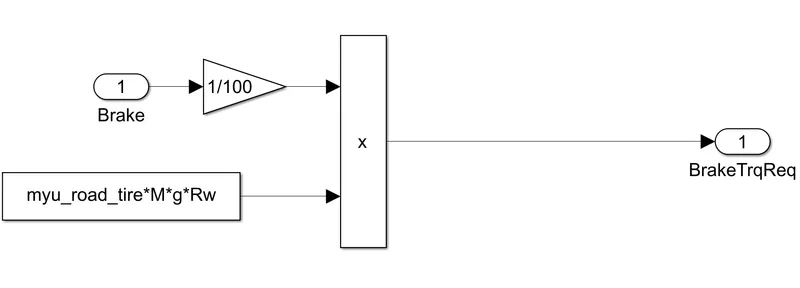
Brake control unit:
Powertrain block:
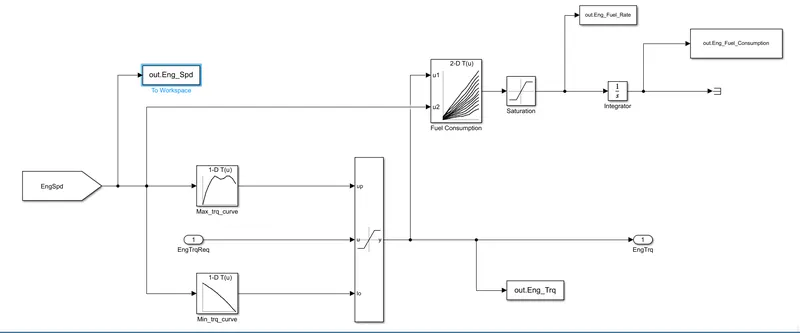
Engine Block:
Electric motor:
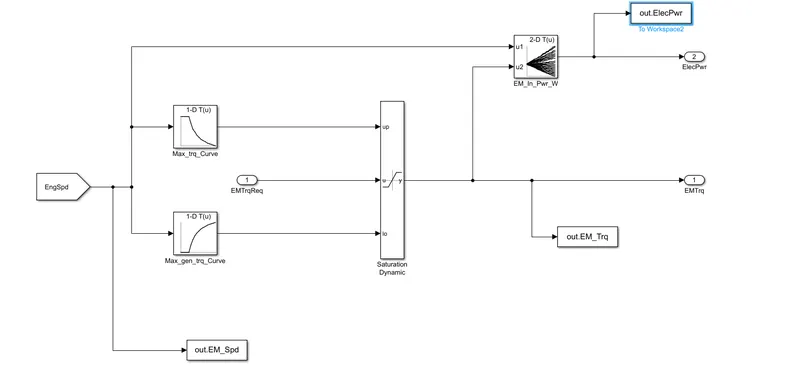
ESS block:
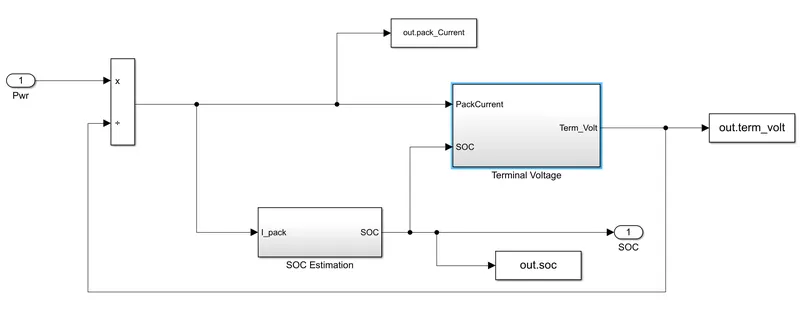
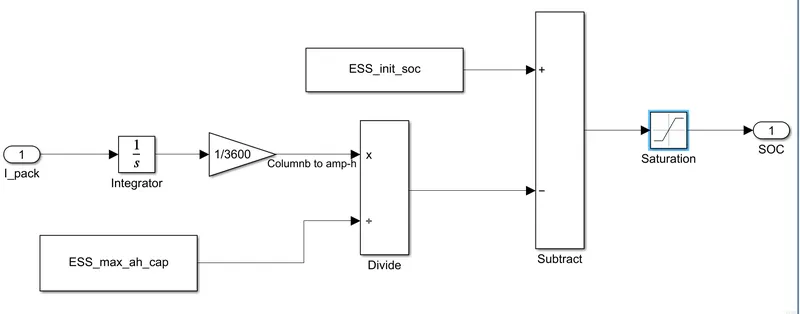
SOC Estimation:
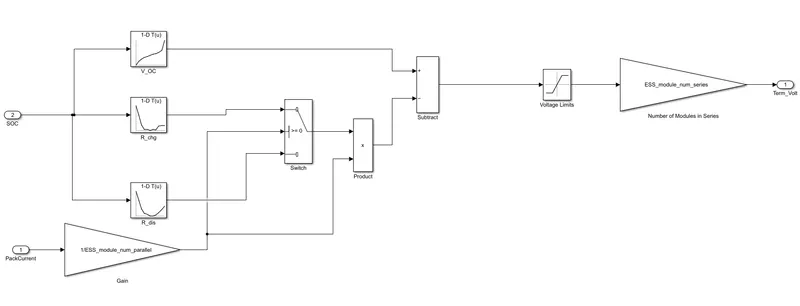
Terminal Voltage:
Transmission:
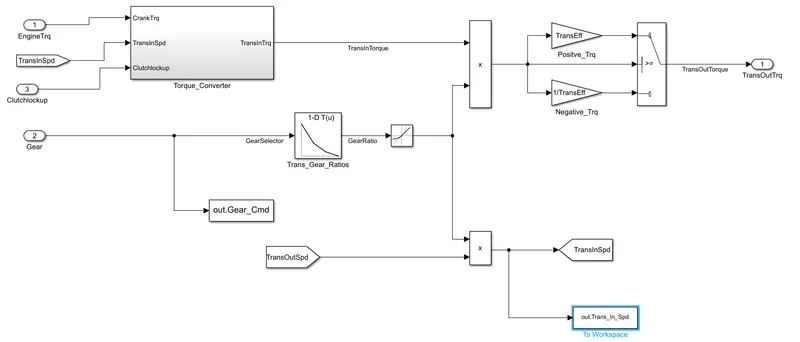
Torque converter:
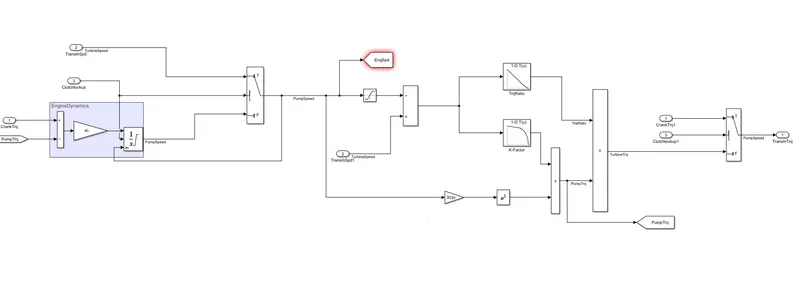
As given in the question downloades files in that m file i got some data by using data I had submitted in these blocks.
From an init file i got values the i run simulink file after i run processiong file all files are submitted.
%% parameters
Time = out.tout;
Acc_Pdl = out.Acc_Pdl; % acceleration pedal
Brk_Pdl = out.Brk_Pdl; %brake pedal
Gear_Cmd = out.Gear_Cmd; %gear
Trans_In_Spd = out.Trans_In_Spd*30/pi; %transmission input speed
Trans_Out_Spd = out.Trans_Out_Spd*30/pi; %transmission output speed
Eng_Trq = out.Eng_Trq; %engine brake torque
Eng_Spd = out.Eng_Spd*30/pi; %Engine speed
Eng_Fuel_Consumption = out.Eng_Fuel_Consumption; %Eng_Fuel_Consumption
Veh_Dist = out.Veh_Dist; %DIstance Travelled by Vehicle in KM
Veh_Spd = out.Veh_Spd*18/5; %%Vehicle Speed in KMph
Eng_Fuel_Rate = out.Eng_Fuel_Rate; % fuel rate
Veh_Desired_Speed = out.Veh_Desired_Speed; % vehicle desired speed
wheel_Spd = out.wheel_spd; %wheel speed
EM_Trq = out.EM_Trq; %Electric Motor torque
EM_spd = out.EM_Spd*30/pi; % Electric motor speed in kmph
ElecPwr = out.ElecPwr; %Electric power
pack_Current = out.pack_Current; %Pack current
term_volt = out.term_volt; %pack voltage
SOC = out.soc;
Eng_Pwr = Eng_Spd*pi/30.*Eng_Trq/1000; %ENGINE BRAKE POWER
rho_petrol = 0.7197; %density of petrol
kmpl = Veh_Dist(end)/(Eng_Fuel_Consumption(end)/1000/rho_petrol);
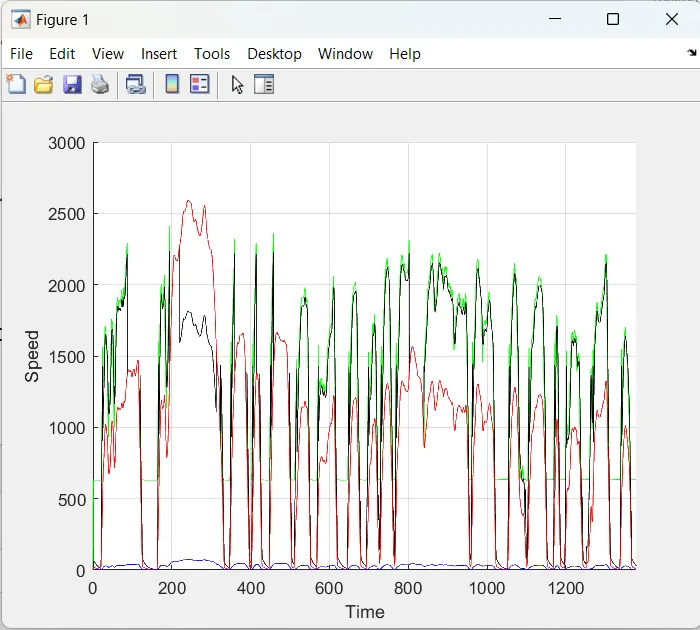
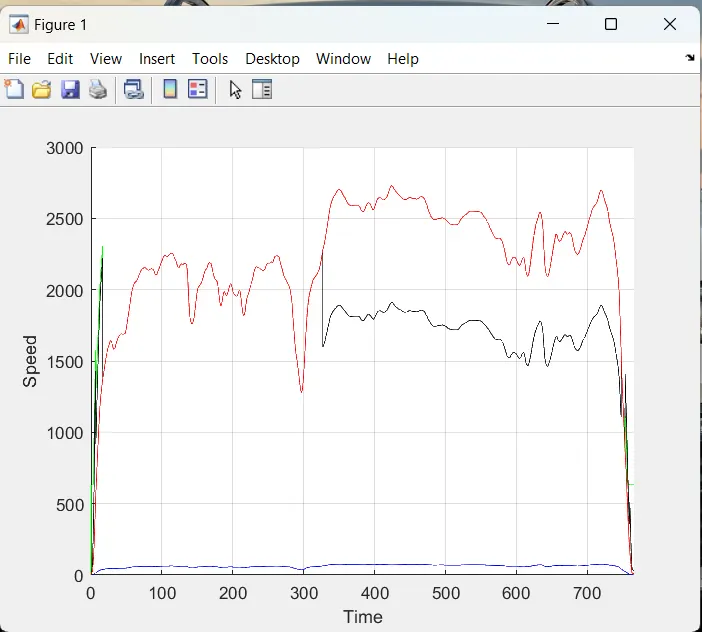
%% plotting Time trace for engine,transmission input speed, transmission out speed,wheel speed
figure(1);
grid on
hold on
plot(Time,Eng_Spd,'green')
plot(Time,Trans_In_Spd,'black')
plot(Time,Trans_Out_Spd,'red')
plot(Time,wheel_Spd,'blue')
xlabel('Time');ylabel('Speed');
xlim([0,Time(end)])
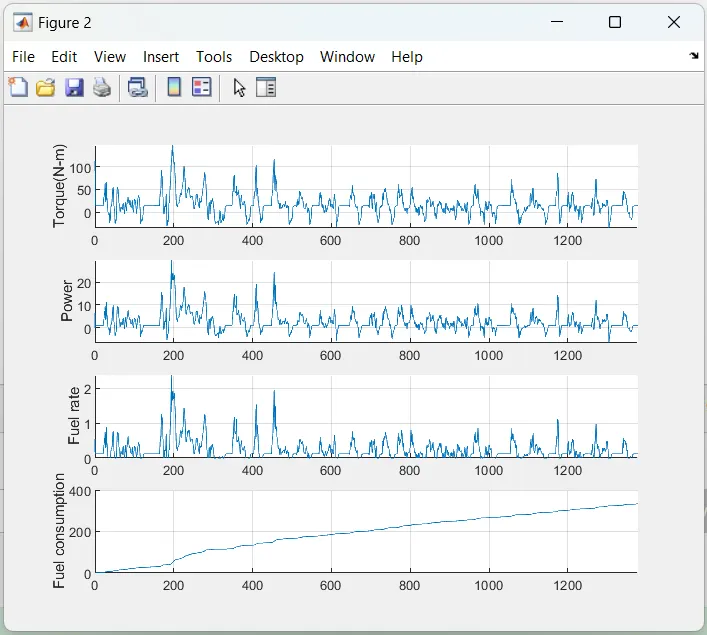
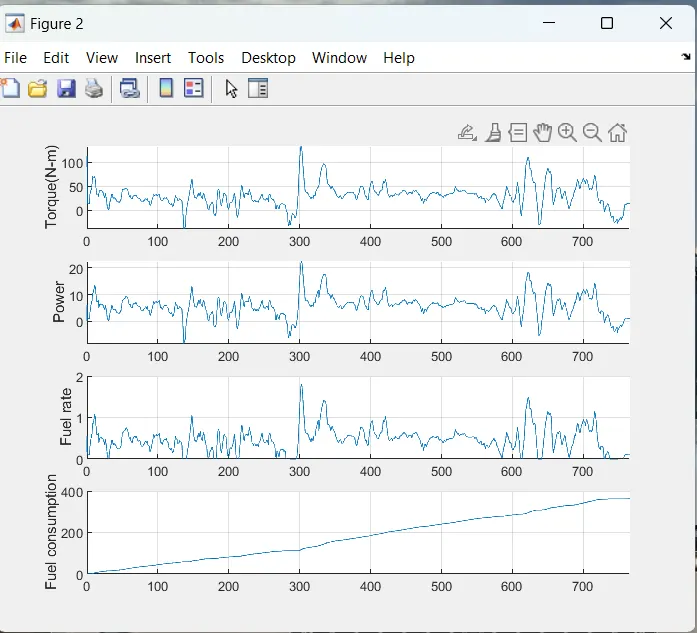
%% Plotting graphs Engine torque,engine power,fuel rate,fuel consumption
figure(2)
subplot(4,1,1)
hold on
grid on
plot(Time,Eng_Trq);ylabel('Torque(N-m)');
xlim([0,Time(end)])
subplot(4,1,2)
hold on
grid on
plot(Time,Eng_Pwr);ylabel('Power');
xlim([0,Time(end)])
subplot(4,1,3)
hold on
grid on
plot(Time,Eng_Fuel_Rate);ylabel('Fuel rate');
xlim([0,Time(end)])
subplot(4,1,4)
hold on
grid on
plot(Time,Eng_Fuel_Consumption);ylabel('Fuel consumption');
xlim([0,Time(end)])
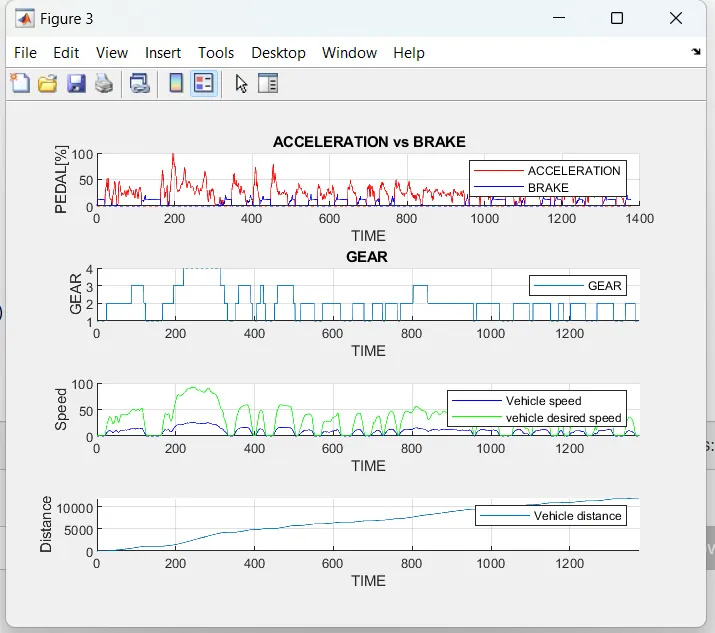
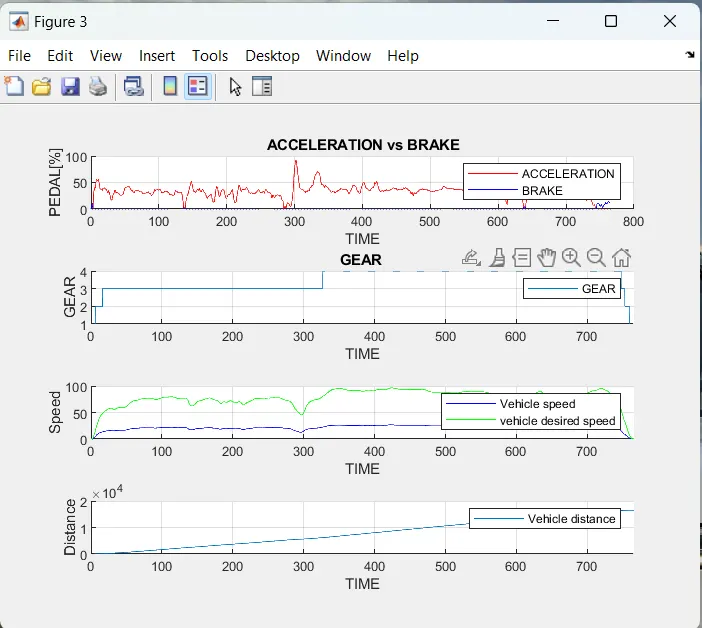
%% Plotting accelaration,brake,gear cmd,veehicle desired and actual speed,vehicle distance
figure(3)
subplot(4,1,1)
hold on
grid on
title('ACCELERATION vs BRAKE')
plot(Time,Acc_Pdl,'r');
plot(Time,Brk_Pdl,'b');
ylabel('PEDAL[%]')
xlabel('TIME')
legend('ACCELERATION','BRAKE');
subplot(4,1,2)
hold on
grid on
plot(Time,Gear_Cmd);
ylabel('GEAR')
xlabel('TIME')
legend('GEAR')
title('GEAR ')
xlim([0,Time(end)])
subplot(4,1,3)
hold on
grid on
plot(Time,Veh_Desired_Speed,'b')
plot(Time,Veh_Spd,'g')
xlim([0,Time(end)])
ylabel('Speed')
xlabel('TIME')
legend('Vehicle speed','vehicle desired speed')
subplot(4,1,4)
hold on
grid on
plot(Time,Veh_Dist)
xlim([0,Time(end)])
ylabel('Distance')
xlabel('TIME')
legend('Vehicle distance')
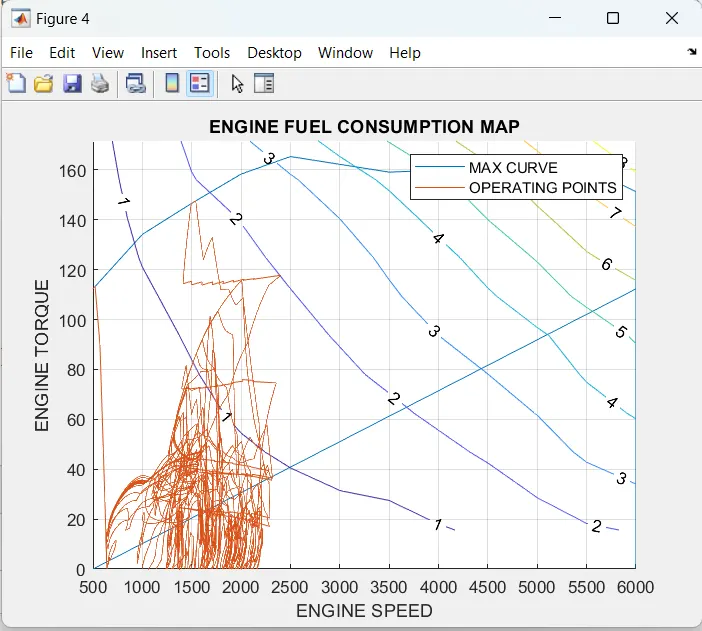
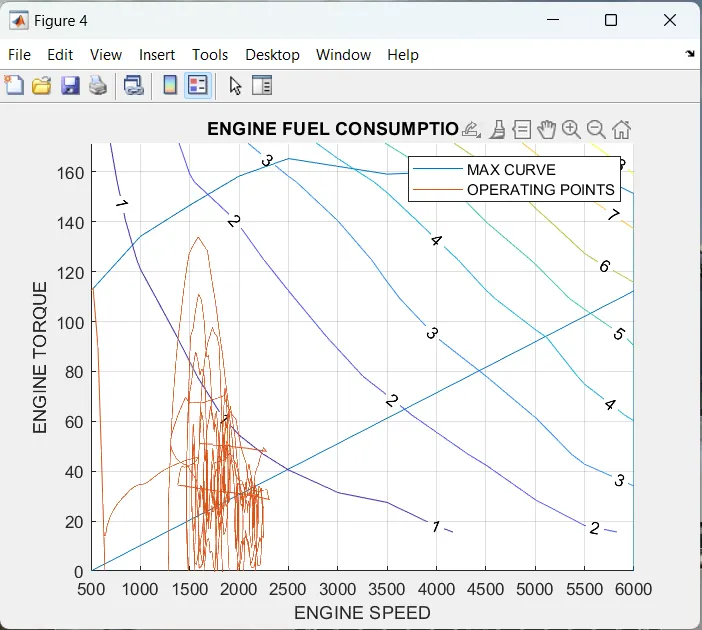
%% FUEL OPERATING POINTS
figure(4);
hold on
grid on
title('Engine Oerating Points')
p1 = plot( Eng_map_spd*30/pi, Eng_max_trq);
p2 = line( [Eng_map_spd(end)*30/pi Eng_map_spd(end)*30/pi] , [0 Eng_max_trq(end)] );
p3 = line( [ Eng_map_spd(1)*30/pi Eng_map_spd(end)*30/pi ] , [ 0 Eng_max_trq(1)] );
[c,h] = contour( Eng_map_spd'*30/pi , Eng_map_trq , Eng_fuel_map');
clabel(c,h);
xlabel('ENGINE SPEED');
ylabel('ENGINE TORQUE');
title('ENGINE FUEL CONSUMPTION MAP');
p4 = plot( Eng_Spd , Eng_Trq);
legend([p1,p4],{'MAX CURVE' , 'OPERATING POINTS'});
axis([Eng_map_spd(1)*30/pi Eng_map_spd(end)*30/pi 0 Eng_map_trq(end)]);
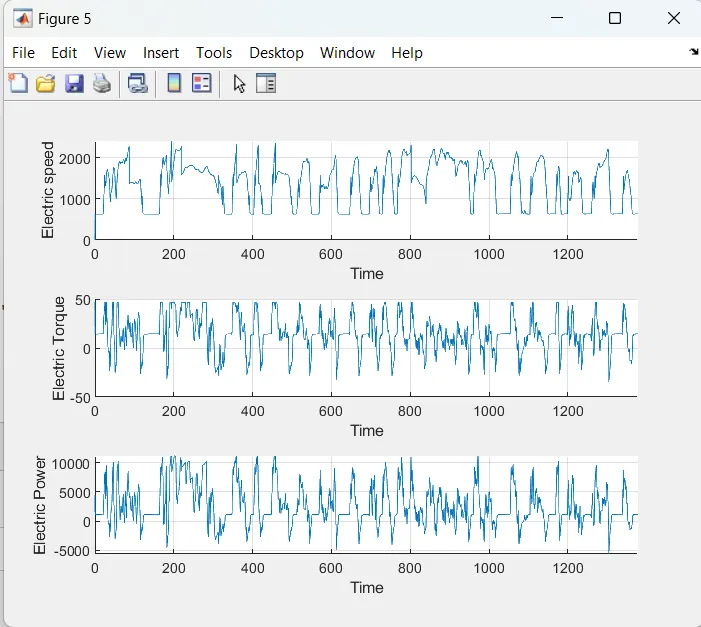
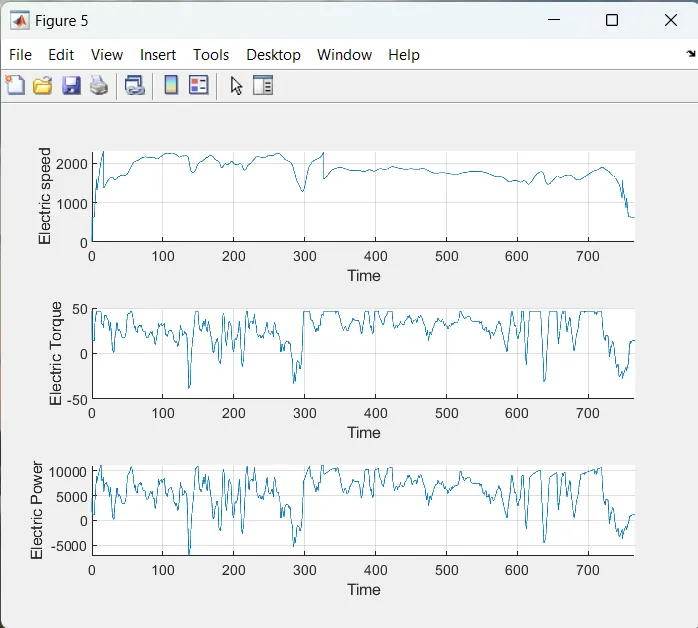
%% plotting Electric motor
figure(5)
subplot(3,1,1)
hold on
grid on
plot(Time,EM_spd)
xlabel('Time');ylabel('Electric speed')
xlim([0,Time(end)])
subplot(3,1,2)
hold on
grid on
plot(Time,EM_Trq)
xlim([0,Time(end)])
xlabel('Time');ylabel('Electric Torque')
subplot(3,1,3)
hold on
grid on
plot(Time,ElecPwr)
xlim([0,Time(end)])
xlabel('Time');ylabel('Electric Power')
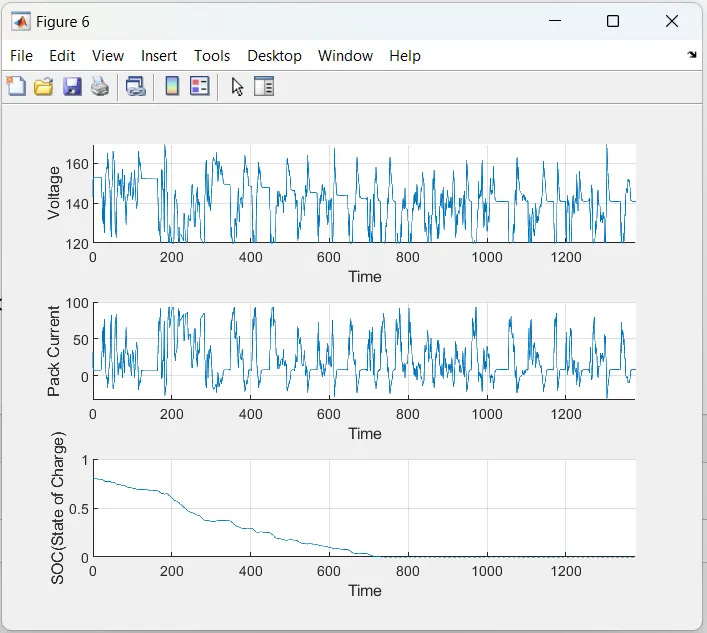
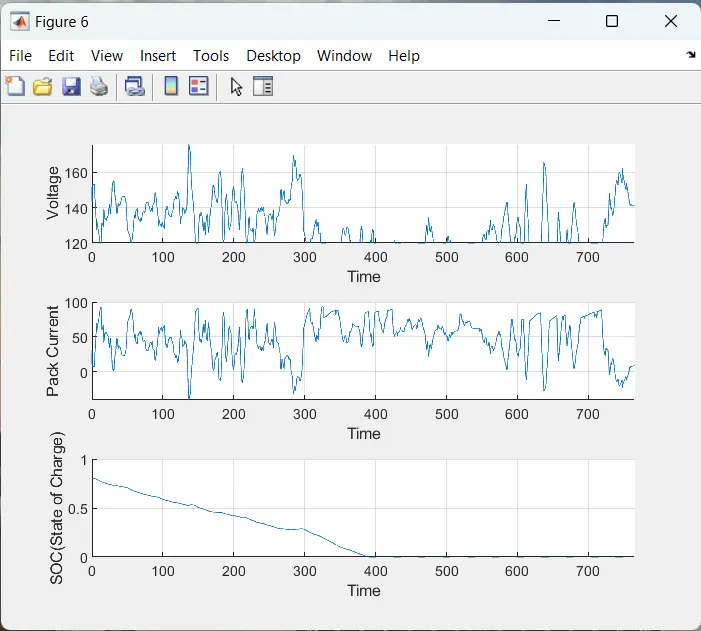
%% plotting voltage,current,SOC
figure(6)
subplot(3,1,1)
hold on
grid on
plot(Time,term_volt)
xlabel('Time');ylabel('Voltage')
xlim([0,Time(end)])
subplot(3,1,2)
hold on
grid on
plot(Time,pack_Current)
xlim([0,Time(end)])
xlabel('Time');ylabel('Pack Current')
subplot(3,1,3)
hold on
grid on
plot(Time,SOC)
xlim([0,Time(end)])
xlabel('Time');ylabel('SOC(State of Charge)')
UDDS Cycle:
1)plotting Time trace for engine,transmission input speed, transmission out speed,wheel speed
2)Plotting graphs Engine torque,engine power,fuel rate,fuel consumption
3)Plotting accelaration,brake,gear cmd,veehicle desired and actual speed,vehicle distance
4) FUEL OPERATING POINTS
5)plotting Electric motor
6)plotting voltage,current,SOC
HWFET Cycle:
1)plotting Time trace for engine,transmission input speed, transmission out speed,wheel speed
2)Plotting graphs Engine torque,engine power,fuel rate,fuel consumption
3)
Plotting accelaration,brake,gear cmd,veehicle desired and actual speed,vehicle distance
4)FUEL OPERATING POINTS
5)plotting Electric motor
6)plotting voltage,current,SOC
conclusion:
After submitting all values i got expected graphs.