Project 2
Aim :-
The main goal of this project is to understand the functionality of a P1 hybrid and be able to model it. To quantify the improvement in fuel economy numbers for the hybrid vehicle (kmpl), compared to the conventional vehicle, on the urban cycle (UDDS) and highway cycle (HWFET). Also, to analyze and understand the vehicle operating points in terms of engine and motor speed, torque, transmission speeds, pedal positions, gear, distance traveled, battery voltage, current, SoC etc.
Objective :-
a. Tabulate the fuel economy numbers (kmpl) for UDDS and HWFET cycle. Compare these numbers with the baseline numbers for conventional vehicle model from Project 1.
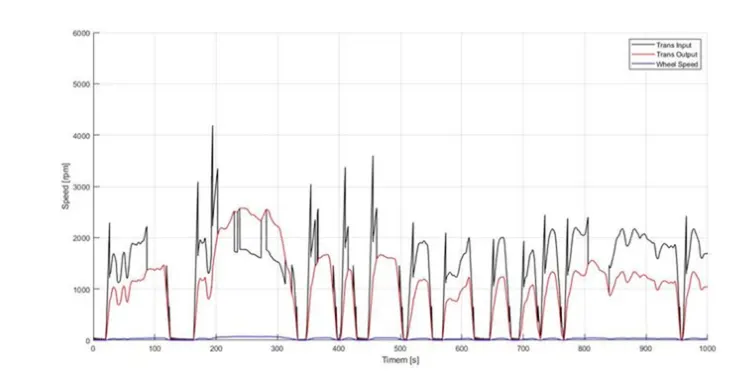
b. Plot the time trace for engine, transmission input, transmission output and wheel speed on one plot.
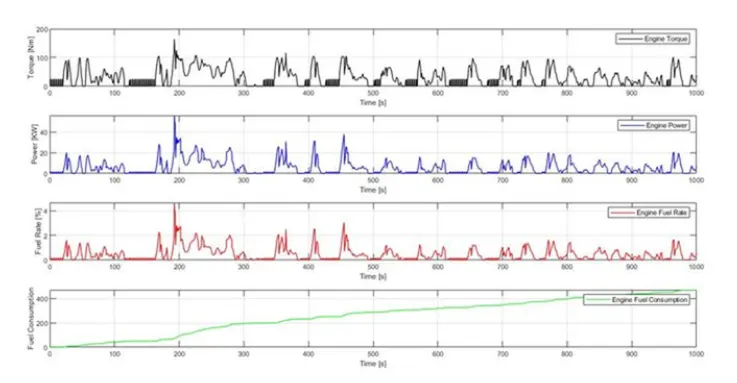
c. Plot engine torque, engine power, fuel rate and fuel consumption using subplots.
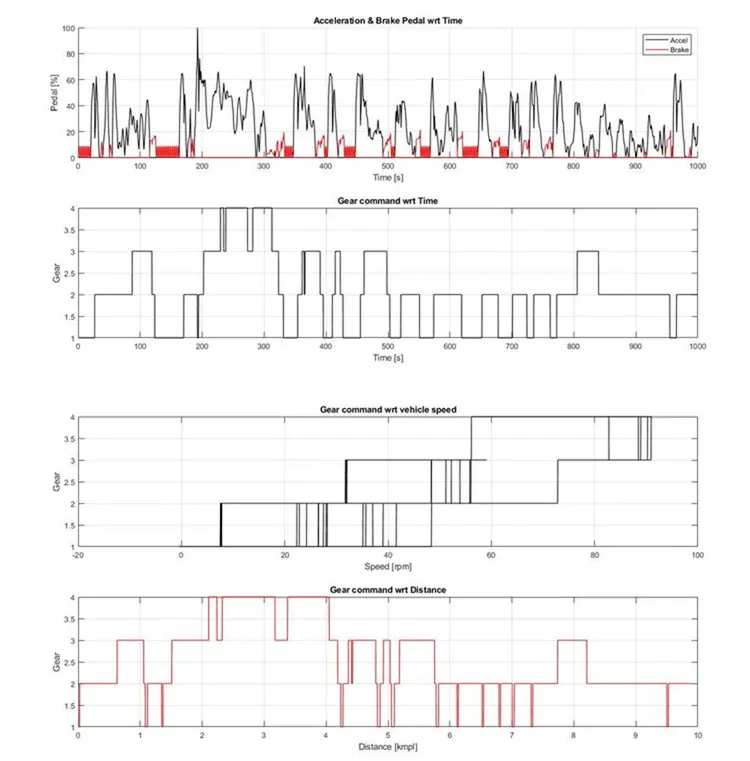
d. Plot accelerator and brake pedal, gear command, vehicle desired and actual speed, vehicle distance using subplots.
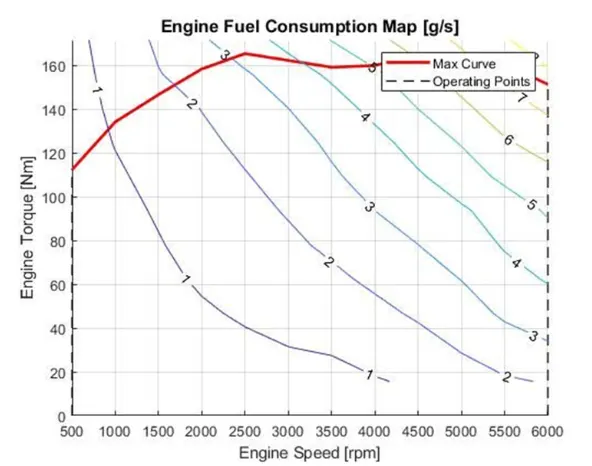
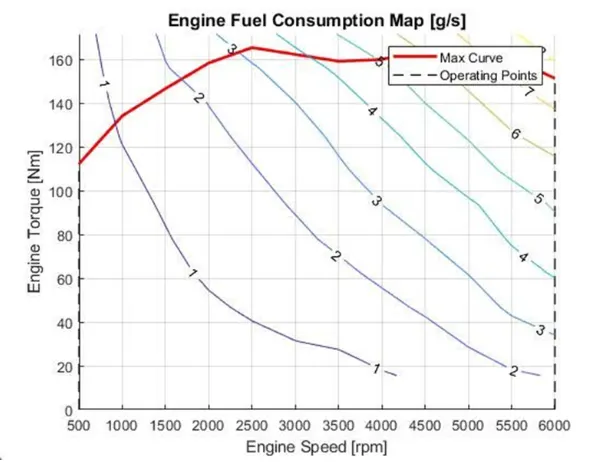
e. Plot the engine operating points on the engine fuel map.
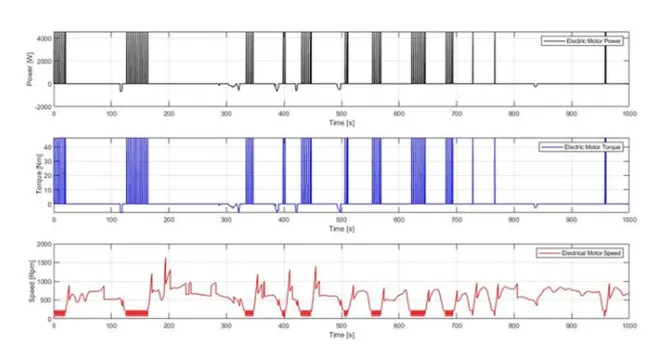
f. Plot motor speed, torque, motor input power using subplots.
g. Plot pack voltage, current and SoC using subplots.
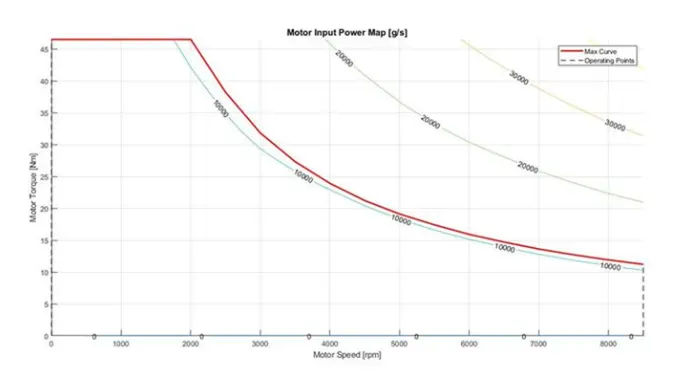
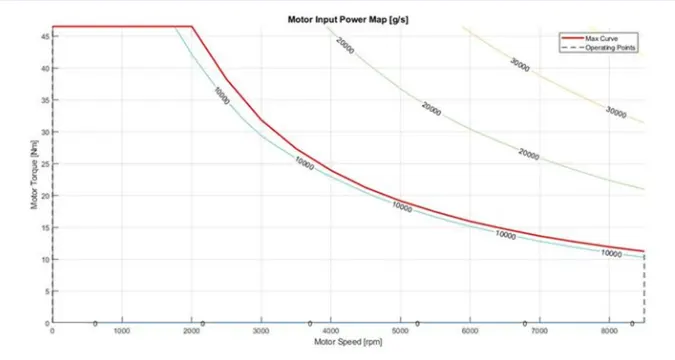
h. Plot the motor operating points on the motor input power map, with the motor max motoring and generating torque curves.
i. Write down appropriate brief comments on each of these plots, describing the vehicle behavior throughout the drive cycle.
j. Generate the plots for both drive cycles.
Theory :-
Crankshaft mounted electric machine (P1) :
The P1 architecture with the electic machine connected directly to the crankshaft, is the solution adopted by honda on their first generation integrated motor assist (IMA) technology. The electric motor function as an engine starter and as a motor (to assist the engine) during vehicle accelerations.
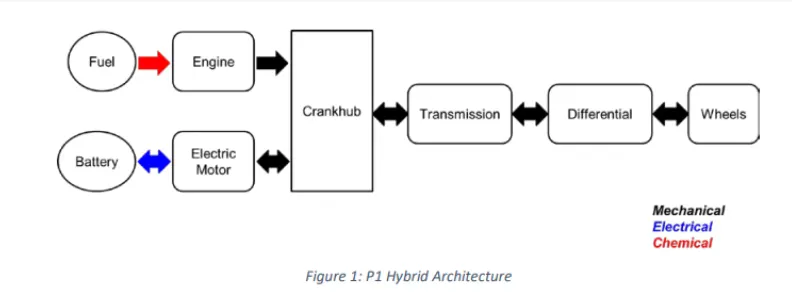
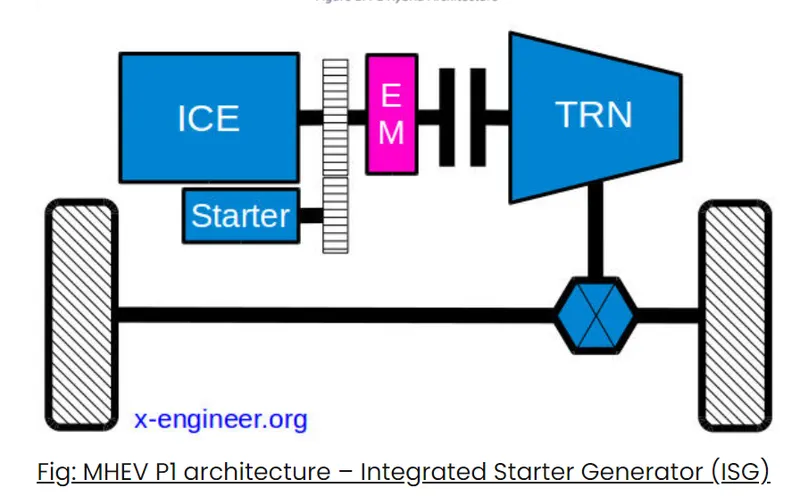
One of the biggest advantage of this solution is that the electric motor can provide higher torque than the BiSG, since there is no belt limitation (due to slip). However, since there is no speed/torque ratio between the electric machine and crankshaft, the torque requirement on the electric motor can be quite demanding.
Example of P1 MHEV architecture is :
Honda insight hybrid 2009 (with integrated motor assist technology)

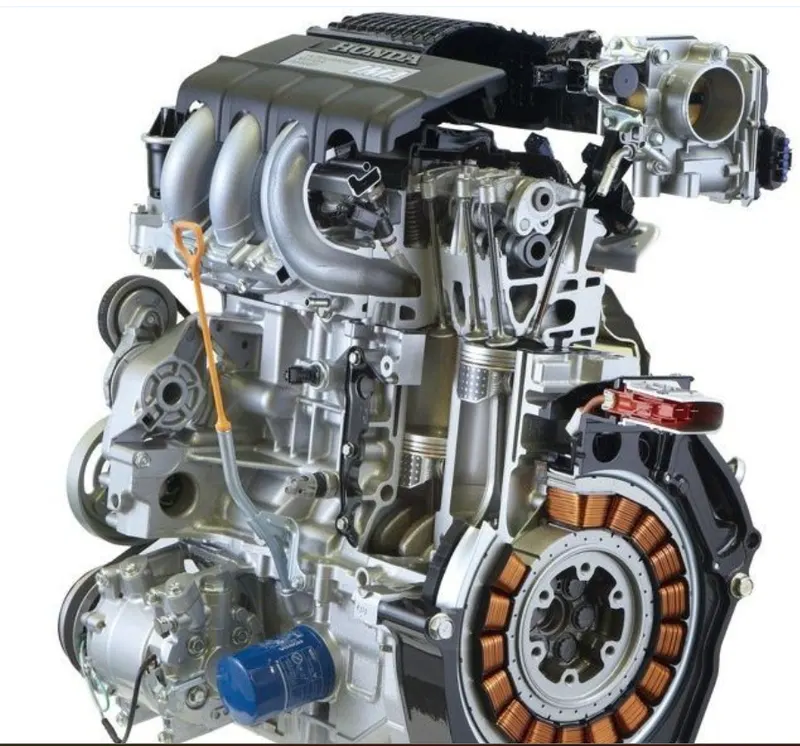
Fig: Internal Motor Assist (IMA) for mild hybrid, credit honda.
The primary advantage of a P1 mild hybrid architecture compared with P0, is the removal of the belt drive. This means that the efficiency increases a bit (no more belt losses) and the electric machine torque can be higher in term of amplitude and response.
The functions (modes) performed by this mild hybrid topology are similar with those of a BiSG (P0), but overall P1 configurations have two big disadvantages : higher cost and higher impact on the existing vehicle architecture. Therefore vehicle manufacturers and system suppliers are not investing in the further development of crankshaft mounted integrated starter generator solution for MHEV applications.
Vehicle Model:(Pre processing MATLAB File):
For this simulink model first need to load the all required variable using MARLAB initialization script which is given in the challange. So first we load this file and run this data and then creating simulink model for this vehicle. Drive cycle selection is also done from here.
%%%%%%%%%%%%%%%%%%%%%%%%%%%%%%%%%%%%%%%%%%%%%%%%%%%%%%%%%%%%%%%%%%%%%
%% Skill-Lync -> Hybrid Drives Development
% Project 1 - Conventional Vehicle Model
% By - Ullekh Gambhira

% Description:

%% Initialization File
% Initialization file for loading the variables for the Conventional vehicle simulation model

%% Vehicle Parameters
M = 1500;       % Vehicle weight [kg]
Cr = 0.015;     % Rolling resistance coefficient
Rw = 0.35;      % Rolling radius [m]
Cd = 0.33;      % Drag coefficient
Af = 2;         % Frontal area [m2]
rhoa = 1.225;   % Air density [kg/m3]
Vwind = 0;      % Wind velocity [kmph]
g = 9.81;       % Gravitational acceleration [m/s2]
theta = 0;      % Slope [deg]
myu_road_tire = 1; % Coefficient of friction between tire - road interface

%% Powertrain Parameters
FDR = 3.73;                         % Final Drive Ratio / Diff Ratio
DiffEff = 0.99;                     % Differential efficiency (assumed independent of operating conditions)

NumGear = 4;                        % Number of gears in transmission
TransGear = [1:NumGear];            % Transmission Gears
TransRatio = [3.06, 1.62, 1, 0.7];  % Corresponding Transmission ratios
TransEff = 0.90;                    % Transmission efficiency (assumed independent of operating conditions)

TC_SR = [0, .5, .6, .7, .8, .87, .92, .94, .96, .97, 1];   % Torque Converter Speed Ratio (Matlab default) -> TurbSpd/PumpSpd
TC_TR = [2.232, 1.5462, 1.4058, 1.2746, 1.1528, 1.0732, 1.0192, 1, 1, 1, 1];   % Torque Converter Torque Ratio (Matlab default) -> TurbTrq/PumpTrq
TC_Cf = 1e-4 * [.72558, .66322, .63463, .59042, .51331, .4144, .29287, .22444, .12186, .04386, 0]; % Torque Converter Capacity Factor (Matlab default) -> PumpTrq/PumpSpd^2 [Nm/rpm^2]

load Vehicle_Data/Engine_data_1_9L_Saturn_95kW
load Vehicle_Data/Trans_Shift_map

%% Driver Parameters
Kp = 10;                    % P gain for driver PI model
Ki = 1;                     % I gain for driver PI model
Drive_Cycle_Select = 2;     % Drive cycle selection

% Drive cycle values in m/s

if Drive_Cycle_Select == 1
    load DriveCycles/UDDS;

elseif Drive_Cycle_Select == 2
    load DriveCycles/HWFET;

elseif Drive_Cycle_Select == 3
    load DriveCycles/FTP;

elseif Drive_Cycle_Select == 4
    load DriveCycles/US06;

elseif Drive_Cycle_Select == 5
    load DriveCycles/NEDC;

elseif Drive_Cycle_Select == 6
    load DriveCycles/WLTP;

end

time_end = cyc_time(end);
vel_end = cyc_vel(end);
There are different drive cycle which is selected by entering the number of drive cycle in 'Drive_cycle_select
Here the number is defined for different drive cycle as per below details
1. UDDS
2. HWFET
3. FTP
4. US06
5. NEDC
6. WLTP
Now for this vehicle the simulink model is created as per below
Simulink Model :-
The simulink model is same as project_1 here the model contains three major blocks.
These three blocks are subsystem contais 1)Driver 2)Controller 3)Power Train
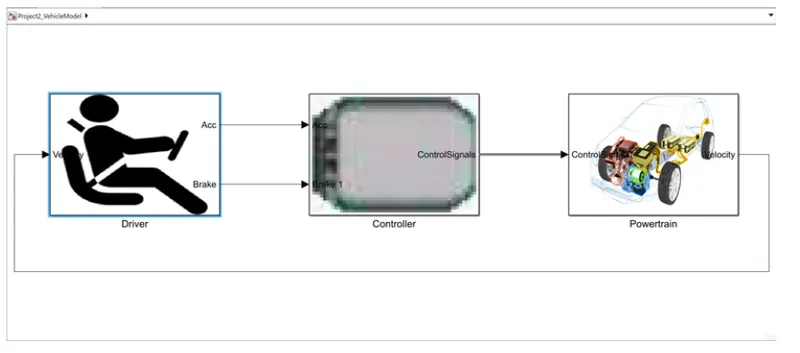
Here in the above model the driver block is given the input to controller as acceleration and brake and then controller give the different control signals as a input to the powertrain subsystem and in last the driver subsystem get the feedback as a actual velocity from the pwertrain block.
Driver Model :-
The driver model generates the output brakes and accelerator using input as velocity. Here for this use the drive cycle data in 1-D lookup table as an input.
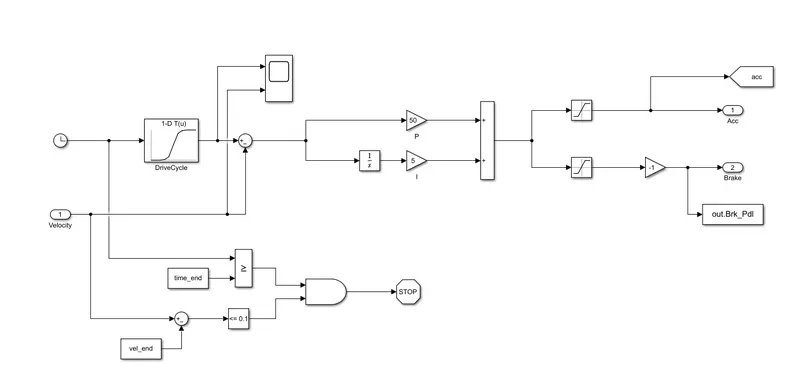
The PI controller controls the error between the required drive cycle and actual vehicle speed by providing acceleration and brake pedal output to the controller.
Controller :
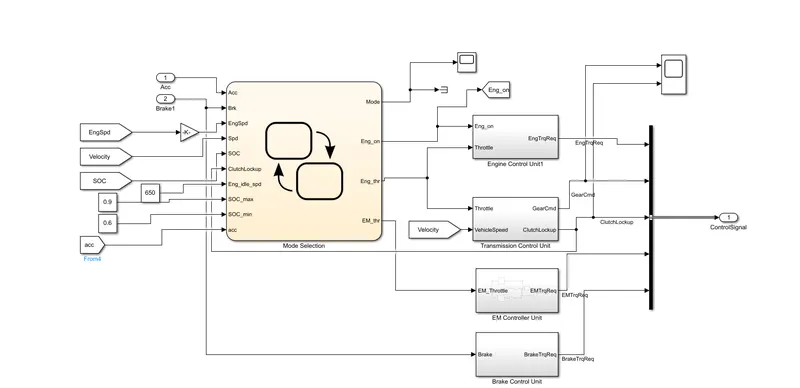
In this subsystem the all control is doing here so this is the heart of the vehicle. There are 4 subsystem blocks added in controller model and there are engine control unit, Transmission control unit, EMotor control unit and brake control unit. Also the stateflow block is used which is for mode selection.
The controller generates engine torque,motor,torque,transmission,gear and brake torque. These inputs are fed to the powertrain block using bus bar which represnts the drivetrain of the vehicle.
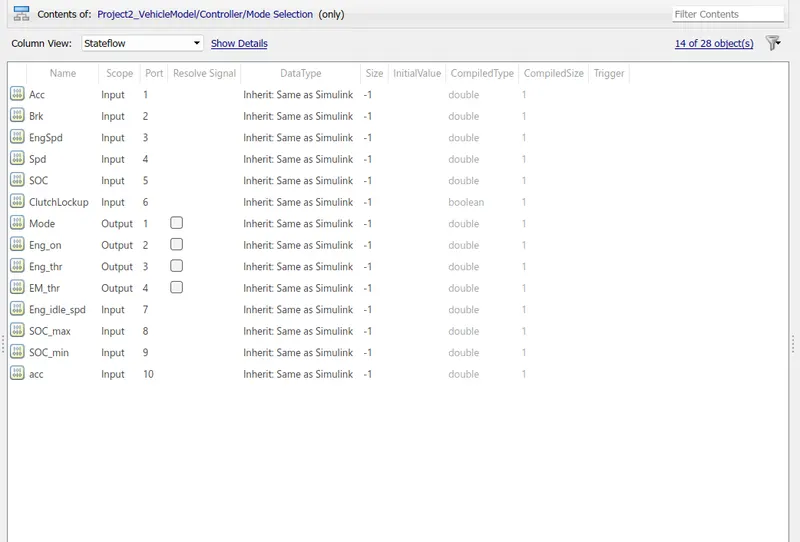
in the mode selection blocks the input and output is define as below figure. The below image shows the model explorer for mode selection stateflow. Here three constant inputs are used SOC_min, SOC_max and Eng_idle_spd.
Mode Selection :
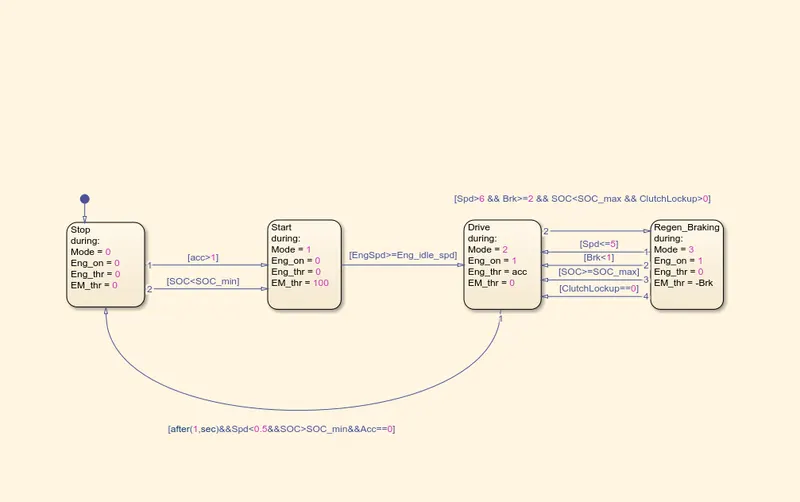
State flow block is used to represent the mode selection unit which decides the operating mode. while it is start/stop mode or drive mode or regen braking mode for each modes the engine drive and the e-motor drive are controlled.
The input to the stateflow chart is acceleration,brake, Engine speed, vehicle speed, SOC and clutch lockup. The state flow output to the individual controllers are the mode, engine on/off, engine input throttle and electric motor input throttle.
In the stateflow the condition are given as below and inputs are given as below image.
Engine control unit :
Engine control unit contains the blocks lookup table and subsystem block and gain, sum, product and saturation blocks.
Engine control unit take input as a lookup table for the maximum torque curve and minimum torque curve and using this it is product with the throttal idel which is output from the idle speed controller and then after using gain block the both are devided and given output as a engine required torque.
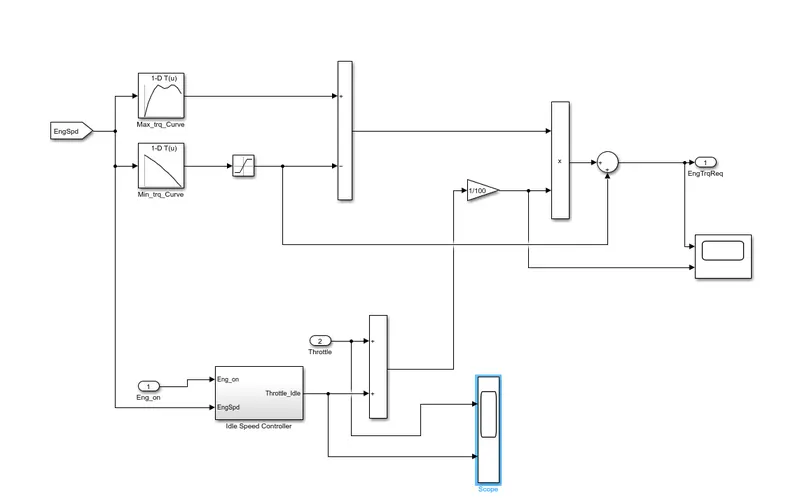
In engine idle speed controller subsystem using engine idle speed as input and engine actual it is calculated the idle throttal as output and this is used as a input in the engine controll unit,
Transmision control unit :-
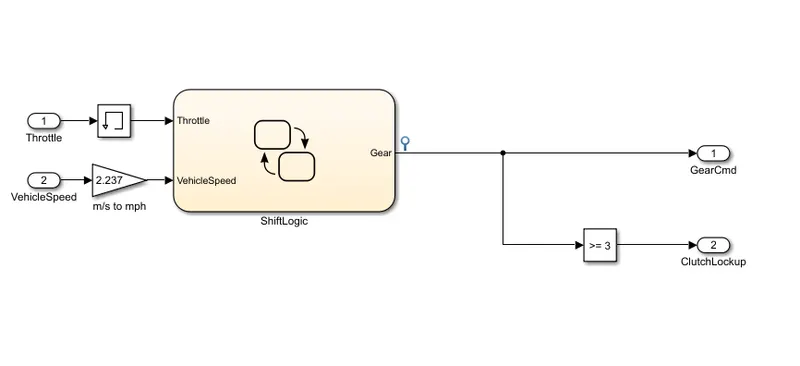
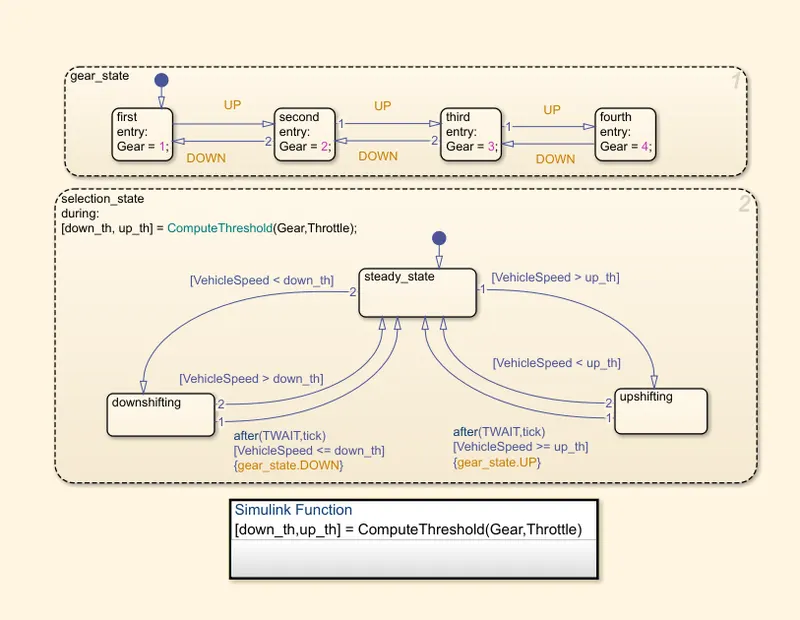
In this unit we create steady flow variable state for controlling of gears of vehicle as in ascending order with respect to time, speed,distance and give input to this steady state is vehicle speed in m/s to mph
shift logic in this unit :-
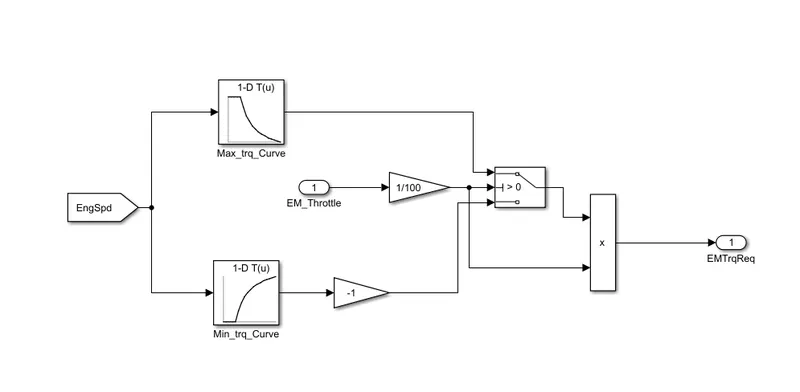
Electric motor control unit :-
Brake control unit :
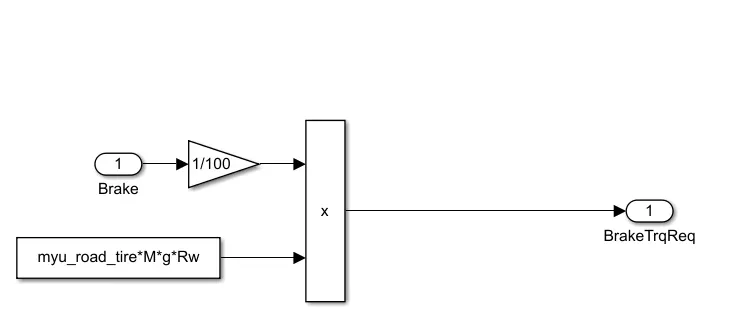
Engine :-
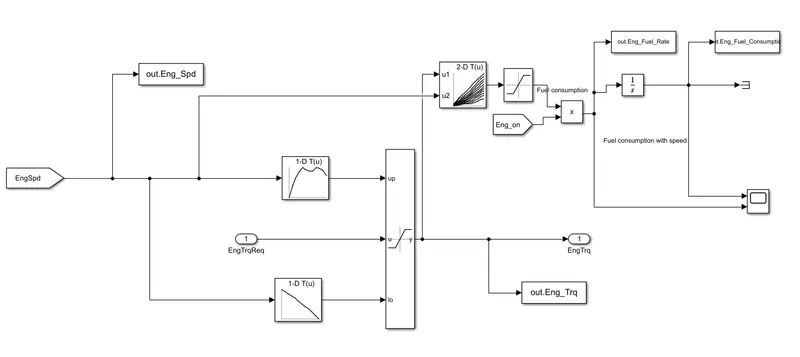
In this model we used map based model to model the fuel consumption of engine. It is based on maximum torque and minimum torque from controller and then it saturated torque and give output then saturated torque and speed map give fuel consumption takes the speed and torqud then the output goes into saturated then it integrated.
Electric motor :
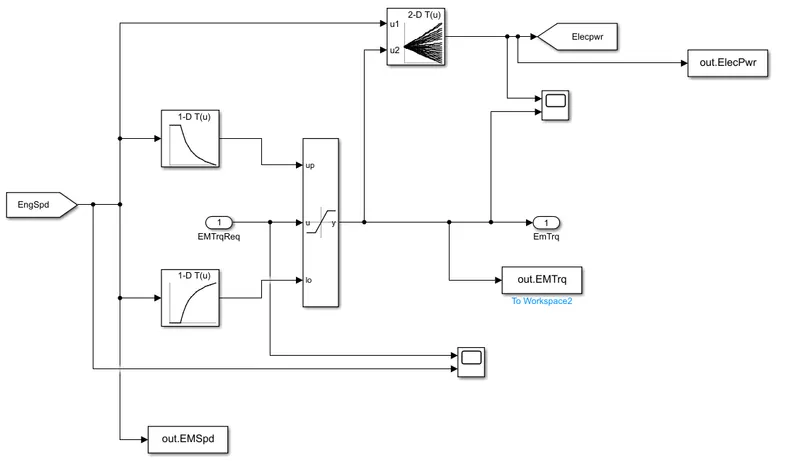
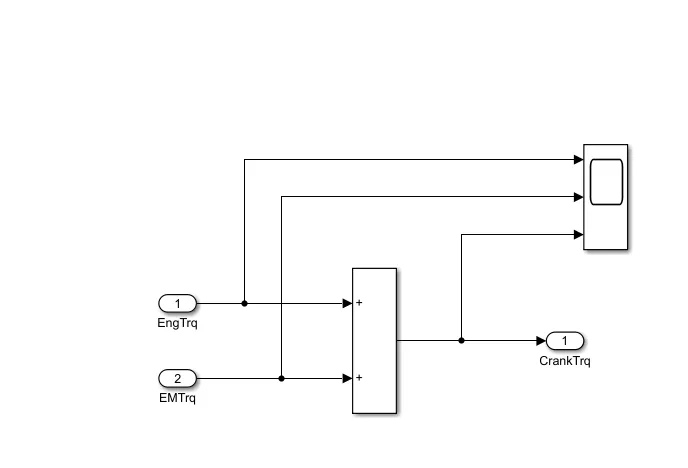
Crank hub:
Transmision :
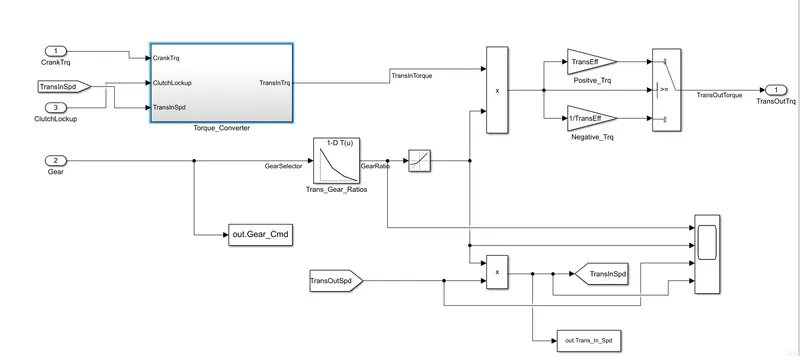
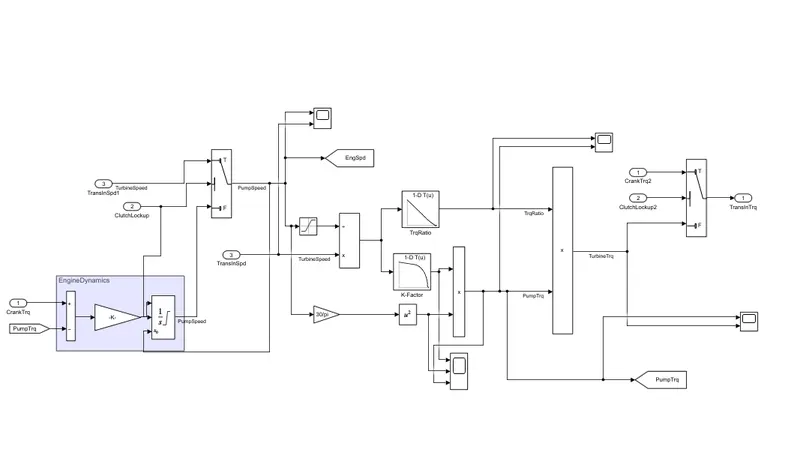
Torque Convertor :
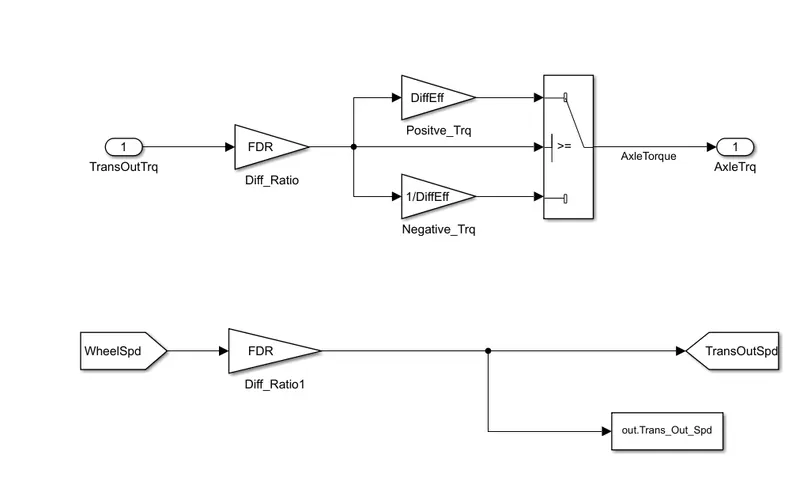
Differential :
Wheel :
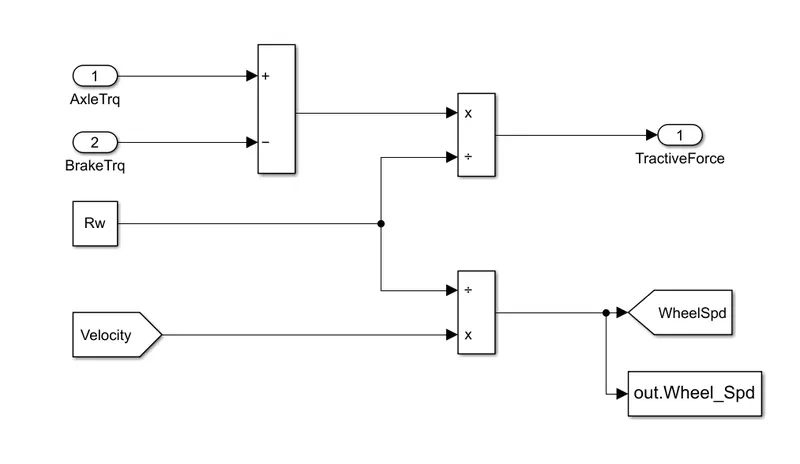
Vehicle Dynamics :-
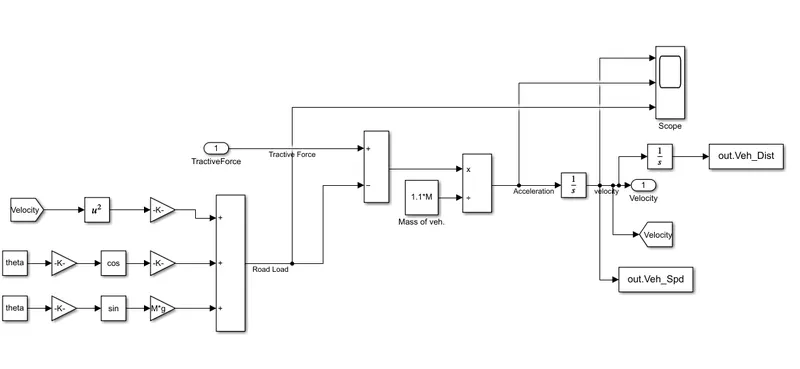
Battery modeling :
Estimated storage sysytem
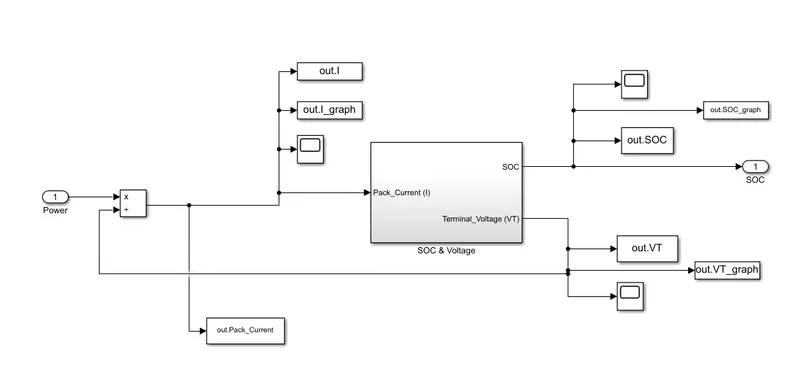
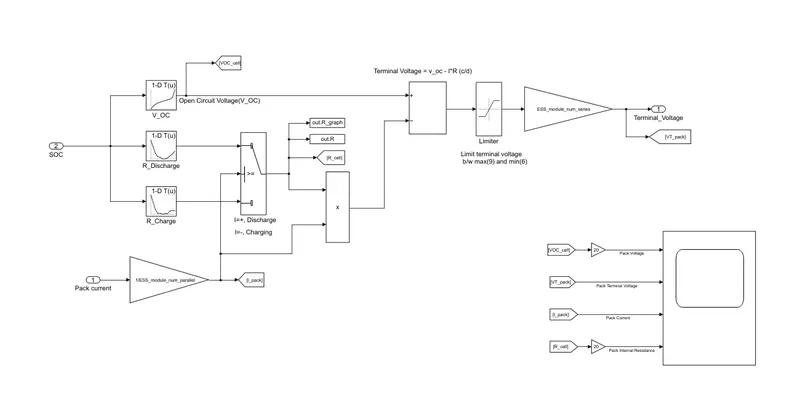
Terminal Vltage :
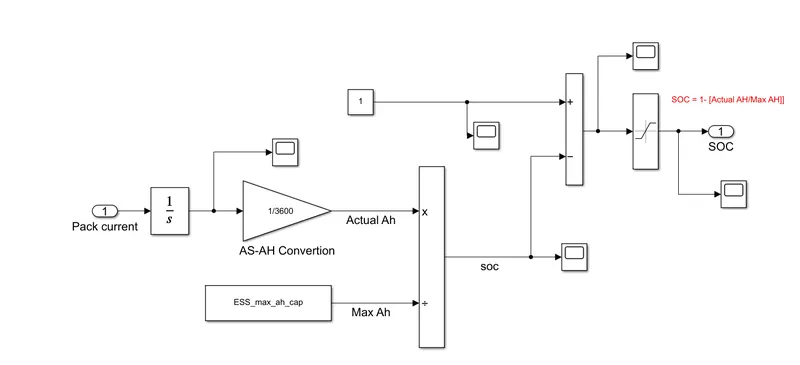
Pack current :
Processing File to evaluate the results :-
% Post processing file of P1 hybrid vehicle
Time = out.tout;
Acc_Pdl = out.Acc_Pdl; %Accelerator pedal [%]
Brk_Pdl = out.Brk_Pdl; %Brake pedal [%]
Gear_Cmd = out.Gear_Cmd;   %transmision gear3
Trans_In_Spd = out.Trans_In_Spd*30/pi; %transmission input speed rpm
Trans_Out_Spd = out.Trans_Out_Spd*30/pi; %transmission output speed rpm
Eng_Trq = out.Eng_Trq; %engine brake torque [NM]
Eng_Spd = out.Eng_Spd*30/pi; %engine speed rpm
Eng_Fuel_Consump = out.Eng_Fuel_Consumption; %engine fuel consumption [g]
Eng_Fuel_Rate = out.Eng_Fuel_Rate;
Veh_Dist = out.Veh_Dist/1000; %Distance traveled by vehicle [Km]
Veh_Spd = out.Veh_Spd*18/5; %Vehicle Speed [kmph]
EM_Power= out.ElecPwr;
Term_Volt = out.VT;
Wheel_Spd = out.Wheel_Spd*30/pi; %wheel speed in rpm
Desired_Spd = out.Desired_Velocity*18/5; %Desired speed in KMPH
EM_Speed = out.EMSpd*18/5; %electric motor speed in rpm
EM_Torque = out.EMTrq; %electric motor torque Nm
Pack_Current = out.Pack_Current; %pack current of battery
Soc = out.SOC; % state of charge
%% Data Analysis
Eng_Pwr = Eng_Spd*pi/30*Eng_Trq/1000; %Engine brake power Kw
rho_petrol = 0.7197; % Petrol density Kg/L
kmpl = Veh_Dist(end)/(Eng_Fuel_Consump(end)/1000/rho_petrol); %Fuel economy kmpl

%%plotting vehicle characterstics time trace to engine speed, Engine Torque, Engine power and engine fuel ratio
%Data conversion from double timeseries
Eng_Spd = Eng_Spd.Data(:,1); %Engine speed
Eng_trq = Eng_Trq.Data(:,1); %engine torque
Eng_pwr = Eng_Pwr.Data(:,1); %Engine power
Eng_fuel_consumption = Eng_Fuel_Consump.Data(:,1); %Engine fuel rate
Eng_fuel_rate = Eng_Fuel_Rate.Data(:,1); %Emgine fuel rate
EM_Speed = EM_Speed.Data(:,1); %Motor Speed
EM_power = EM_Power.Data(:,1); %Motor Power
EM_torque = EM_Torque.Data(:,1); %Motor Torque
Pack_Current = Pack_Current.Data(:,1); %pack current of battery
Term_Voltage = Term_Volt; % Terminal voltage of battery
State_of_charge = Soc;
Vehicle_Spd =Veh_Spd.Data(:,1);
Vehicle_Dist =Veh_Dist.Data(:,1);
%%PLot the time trace for engine,tansmission input,
figure (1)
hold on
grid on
plot (Time,Trans_In_Spd,'linewidth',2,'color','b')
plot(Time,Trans_Out_Spd,'Linewidth',2,'color','red')
plot(Wheel_Spd,'linewidth',2,'color','blue')
xlabel('Time [S]')
ylabel('Speed [rpm]');
xlim([0,Time(end)]);
legend('Transmission Input','Transmission Outpu','Wheel Speed');

%% Plot engine torque, engien power, fuel rate and fuel consumption
figure (2)
subplot(4,1,1)
plot(Time,Eng_trq,'linewidth',2);
xlabel('Time [s]')
ylabel('Torque [Nm]')
legend ('Engine Torque')
grid on
subplot(4,1,2)
plot(Time,Eng_pwr,'linewidth',2);
xlabel('Time [s]');
ylabel('Power [KW]');
legend ('Engine Power');
grid on
subplot(4,1,3)
plot(Time,Eng_fuel_rate,'linewidth',2);
xlabel ('Time [s]');
ylabel('Fuel Rate [%]');
legend('Engine Fuel Rate');
grid on
subplot(4,1,4)
plot(Time,Eng_fuel_consump,'linewidth',2)
xlabel('Time [s]');
ylabel('Fuel Consumption');
legend('Engine Fuel Consumption');
grid on

%Plotting fuel economy Vs Engine Fuel consumption
figure (3)
plot(Eng_fuel_consumption,Eng_fuel_rate','color','r')
xlabel('Fuel consumption')
ylabel('Fuel rate %')
title('Fuel economy Vs fuel consumption')
grid on

%Plotting accelerator pedal,Brake pedal and gear command with respect to
%time
figure(4)
subplot(2,1,1)
hold on
plot(Time,Acc_Pdl,'linewidth',1,'color','b');
plot(Time,Brk_Pdl,'linewidth',1,'color','r');
ylabel('Pedal %')
xlabel('Time [s]')
grid on
legend('Accel','Brake')
title('Acceleration and brake pedal wrt time')

subplot(2,1,2)
plot(Time,Gear_Cmd,'linewidth',1,'color','b')
xlabel('Time')
ylabel('Gear')
grid on
title('Gear command wrt time')

%plotting gear command vehicle desired with actual speed
figure(5)
subplot(2,1,1)
plot(Vehicle_Spd,Gear_Cmd,'linewidth',1,'color','b')
xlabel('speed [rpm]')
ylabel('Gear')
grid on
title('Gear command wrt vehicle speed')

subplot(2,1,2)
plot(Vehicle_Dist,Gear_Cmd,'linewidth',1,'color','r')
xlabel('Distance [kmpl]')
ylabel('Gear')
grid on

%plotting engine operating points on engine fuel map
figure('Name','Engine Operating Points')
hold on
grid on
title('Engine Operating Points')
p1=plot(Eng_map_spd*30/pi,Eng_max_trq,'linewidth',2,'color','r');
p2=line([Eng_map_spd(end)*30/pi Eng_map_spd(end)*30/pi],[0 Eng_max_trq(1)]);
set(p2,'linewidth',1,'linestyle','--','color','k');
p3 = line([Eng_map_spd(1)*30/pi Eng_map_spd(1)*30/pi],[0 Eng_max_trq(1)]);
set(p3,'linewidth',1,'linestyle','--');
%[c,h] = contour(Eng_map_spd/pi,Eng_fuel_map,Eng_map_trq);
%clabel(c,h);
xlabel('Motor Speed [rpm]')
ylabel('Motor Torque [NM]')
title('Engine Fuel consumption map [g/s]')
legend([p1 p3],{'Max Curv','Operating Points'});
%axis([Eng_map-spd(1)*30/pi Eng_map-spd(1)*30/pi Eng_map_trq(end)]);

%%State of charge,pack current and terminal voltage with respect to time
figure (6)
subplot(3,1,1)
plot(Time,Pack_Current,'linewidth',1,'color','b')
legend ('pack current')

subplot(3,1,2)
plot(Time,State_of_charge,'linewidth',1,'color','blue')
xlabel('Time')
ylabel('Charging[%]')
legend('State of charge')
grid on

subplot(3,1,3)
plot(Time,Term_Voltage,'linewidth',1,'color','red')
xlabel('Time [s]')
ylabel('Voltage [V]')
legend('Terminal Voltage')
grid on

%% Plotting EM Operating points on motor input power map
figure('Name','Electric Motor operating points')
hold on
grid on
title('Electric Motor operating points')
p1=plot(EM_map_spd*30/pi,EM_max_trq,'linewidth',2,'color','r');
p2 =line([EM_map_spd(end)*30/pi EM_map_spd(end)*30/pi],[0 EM_max_trq(end)]);
set(p2,'linewidth',1,'linestyle','color','k')
[c,h] =contour(EM_map_spd(1)*30/pi,EM_map_trq,Em_inpwr_map);
clabel(c,h)
xlabel('Motor speed [rpm}')
ylabel('Motor Torque [Nm]')
title('Motor input power map [g/s]')
legend([p1 p3],{'Max Curve','Operating Points'});
axis([EM_map_spd(1)*30/pi EM_map_spd(end)*30/pi 0 EM_map_trq(end)]);
Question :- Tabulate the fuel economy numbers (kmpl) for UDDS and HWFET cycle. Compare these numbers with the baseline numbers for conventional vehicle model from Project 1.
Ans -
Fuel economy numbers for projwct 2
Sr no Drive cycle Fuel Economy Number(kmpl)
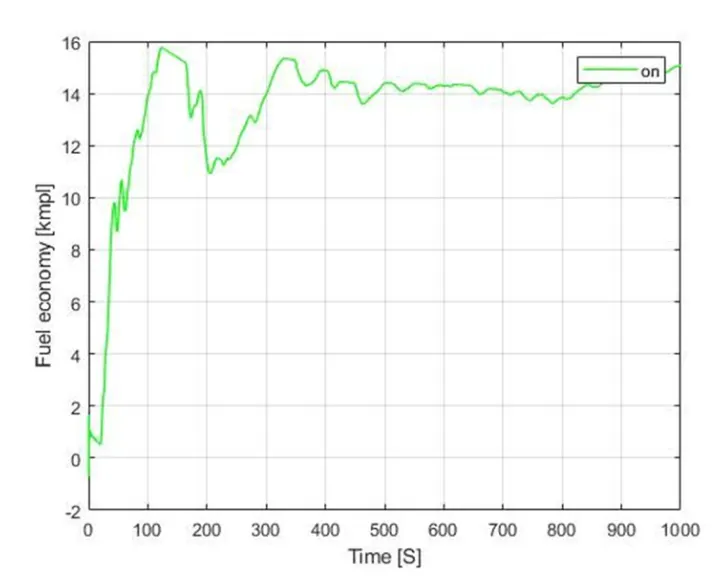
1 UDDS 15.0773
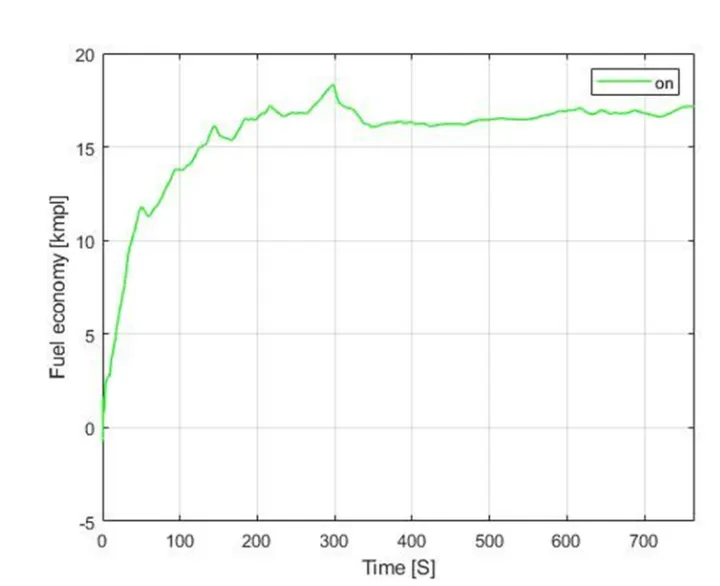
2 HWFET 17.1613
as we see the fuel economy is high in HWFET compared to UDDS.
Comparing with fuel economy numbers for project 1
Sr no Drive cycle Fuel Economy Number(kmpl)
1 UDDS 13.209
2 HWFET 15.503
Question :-Plot the time trace for engine, transmission input, transmission output and wheel speed on one plot.
Ans :-
1) For UDDS drive cycle
2) For HWFET drive cycle :-
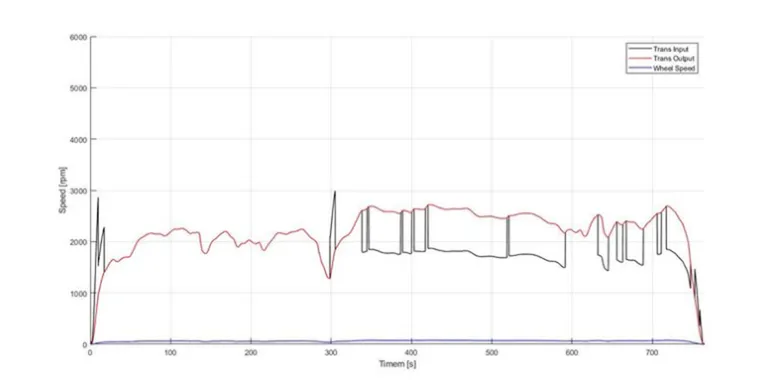
In this we can see the graph is more fluctuare into UDDS drive cycle compared to HWFET drive cycle. It is because UDDS has more starts and stops and in HWFET less starts and stops.
Braking is high in UDDS compared to HWFET
Question 2 - Plot engine torque, engine power, fuel rate and fuel consumption using subplots.
Answer -
1)For UDDS Drive cycle :-
For HWFET Drive cycle :-
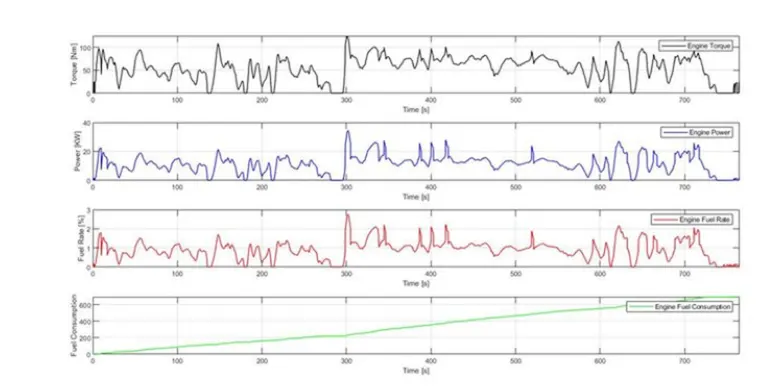
vehicle consumed more power in UDDS drive cycle because in urban area the vehicle require many starts and stops so it require more power compared to HWFET.
Engine power required in UDDS drive cycle compared to HWFET drive cycle because the starting from rest the vehicle requireds more torque to overcome the static friction.
The fuel rate is high in HWFET drive cycle compared to UDDS drive cycle because it will be in continues movement. So it consumes more fuel.
The fuel economy is high in HWFET because in UDDS cycle many starts and stops so more fuel consumed and the engine is in idle position.
Question :- Plot accelerator and brake pedal, gear command, vehicle desired and actual speed, vehicle distance using subplots.
Answer -
1] For UDDS drive cycle :-
2] For HWFET drive cycle :-
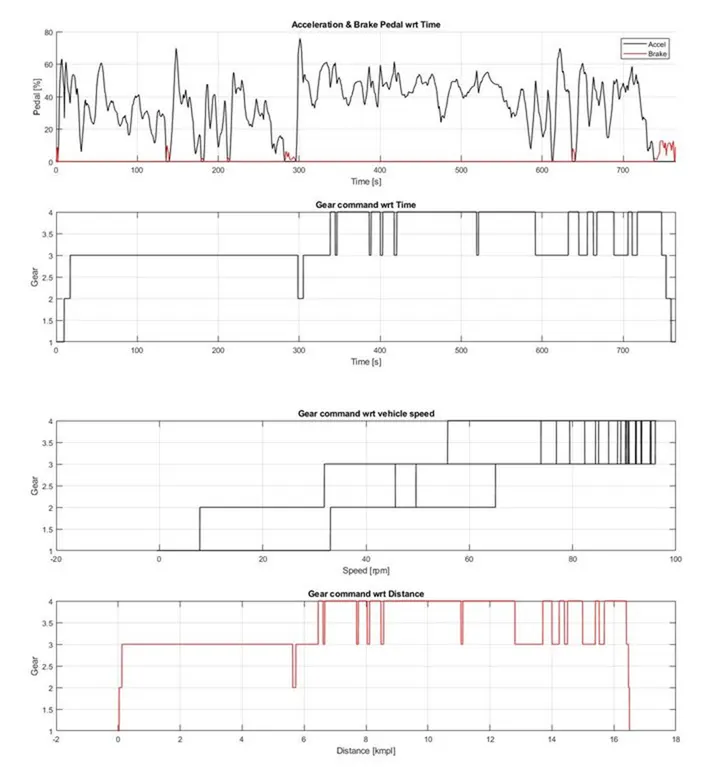
In UDDS The acceleration and brake pedal have more fluctuations because of frequent starts and stops but in HWFET the brake pedal fluctuations are almost near the zero line as there will be no frequent stops.
Question :-Plot the engine operating points on the engine fuel map.
Answer :
1] For UDDS drive cycle :-
2] For HWFET drive cycle :-
Question :- Plot pack voltage, current and SoC using subplots.
Ans -
1] For UDDS drive cycle :-
2)For HWFET drive cycle :-
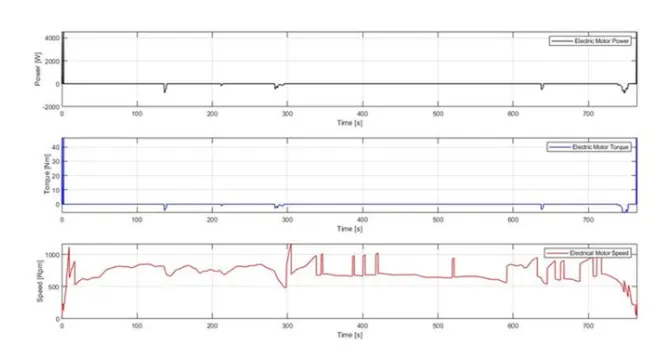
The fluctuations will be more in UDDS cycle compared to HWFET cycle because UDDS has many starts and stops due to traffic as the purpose of motor in P1 hybti in initiation of crank rotation and they are more in UDDS cycle when compared to HWFET cycle.
Question :- motor speed, torque, motor input power using subplots.
Answer :-
1] For UDDS drive cycle :-
2] For HWFET drive cycle :-
Question - Fuel Economy wrt Tim :-
1] For UDDS Drive cycle :-
2] For HWFET drive cycle :-
Conclusion :-
The various performance of characterstics and operating points of UDDS drive cycle and HWFET drive cycle are analysed and the graphs are plotted
- Time trace for engine, Transmission input, Transmission output and wheelspeed with respect to time.
- Engine torque, Engine power, Fuel rate and Fuel consumption with respect to time.
- Acceleration and brake pedal, gear command and vehicle desired, actual speed, vehicle distance with respect to time
- Engine operating points on the engine fuel map with respect to time.
- Motor speed, Torque, Motor input power with respect to time.
- Pack voltage, Currebt and state of charging with respect to time.
- The motor operating points on the motor input power map with respect to time.
and also it comparing with HWFET drive cycle and their numbers also compared.