Project 2
Simulate the hybrid model on the desired drive cycles.
With the awakening of social, environmental awareness, and high energy prices, people's requirements for vehicles are no longer just high power, high trafficability, and high comfort. On the contrary, more and more people pay more attention to the environmental protection and fuel-saving performance of vehicles when choosing vehicles. So far, there are three primary technical schemes to meet the requirements of vehicle environmental protection and energy-saving, namely hybrid electric vehicle, pure electric vehicle, and fuel cell vehicle
%%%%%%%%%%%%%%%%%%%%%%%%%%%%%%%%%%%%%%%%%%%%%%%%%%%%%%%%%%%%%%%%%%%%%
%% Skill-Lync -> Hybrid Drives Development
% Project 1 - Conventional Vehicle Model
% By - Ullekh Gambhira

% Description:

%% Initialization File
% Initialization file for loading the variables for the Conventional vehicle simulation model

%% Vehicle Parameters
M = 1500;       % Vehicle weight [kg]
Cr = 0.015;     % Rolling resistance coefficient
Rw = 0.35;      % Rolling radius [m]
Cd = 0.33;      % Drag coefficient
Af = 2;         % Frontal area [m2]
rhoa = 1.225;   % Air density [kg/m3]
Vwind = 0;      % Wind velocity [kmph]
g = 9.81;       % Gravitational acceleration [m/s2]
theta = 0;      % Slope [deg]
myu_road_tire = 1; % Coefficient of friction between tire - road interface

%% Powertrain Parameters
FDR = 3.73;                         % Final Drive Ratio / Diff Ratio
DiffEff = 0.99;                     % Differential efficiency (assumed independent of operating conditions)

NumGear = 4;                        % Number of gears in transmission
TransGear = [1:NumGear];            % Transmission Gears
TransRatio = [3.06, 1.62, 1, 0.7];  % Corresponding Transmission ratios
TransEff = 0.90;                    % Transmission efficiency (assumed independent of operating conditions)

TC_SR = [0, .5, .6, .7, .8, .87, .92, .94, .96, .97, 1];   % Torque Converter Speed Ratio (Matlab default) -> TurbSpd/PumpSpd
TC_TR = [2.232, 1.5462, 1.4058, 1.2746, 1.1528, 1.0732, 1.0192, 1, 1, 1, 1];   % Torque Converter Torque Ratio (Matlab default) -> TurbTrq/PumpTrq
TC_Cf = 1e-4 * [.72558, .66322, .63463, .59042, .51331, .4144, .29287, .22444, .12186, .04386, 0]; % Torque Converter Capacity Factor (Matlab default) -> PumpTrq/PumpSpd^2 [Nm/rpm^2]

load Vehicle_Data/Engine_data_1_9L_Saturn_95kW
load Vehicle_Data/Trans_Shift_map
load Vehicle_Data/EM_Honda_Insight_10kW
load Vehicle_Data/ESS_NiMH6


ESS_init_soc = 0.8;
ESS_soc_max = 0.9;
ESS_soc_min = 0.6;


%% Driver Parameters
Kp = 10;                    % P gain for driver PI model
Ki = 1;                     % I gain for driver PI model
Drive_Cycle_Select = 2;     % Drive cycle selection

% Drive cycle values in m/s

if Drive_Cycle_Select == 1
    load DriveCycles/UDDS;

elseif Drive_Cycle_Select == 2
    load DriveCycles/HWFET;

elseif Drive_Cycle_Select == 3
    load DriveCycles/FTP;

elseif Drive_Cycle_Select == 4
    load DriveCycles/US06;

elseif Drive_Cycle_Select == 5
    load DriveCycles/NEDC;

elseif Drive_Cycle_Select == 6
    load DriveCycles/WLTP;

end

time_end = cyc_time(end);
vel_end = cyc_vel(end);
After the system simulation begins, the parameters such as ideal vehicle speed u I, ideal torque Ti and ideal acceleration time ti should be preset. After the simulation starts, according to the parameters such as simulation measured vehicle speed u, simulation engine torque Tm, simulation motor torque Te and simulation battery management system SOC, the energy management strategy will choose the driving mode to give the engine and electric motor. The machine sends torque instructions, and then outputs vehicle speed, motor torque, and engine torque through transmission system model and vehicle dynamics model simulation, calculates acceleration time, outputs acceleration curve, and ends the simulation. Among them, the equivalent fuel consumption method is used to calculate the SOC parameters, that is, the equivalent energy consumption of the engine and the battery pack at each time is calculated, and then the consumption to meet the driver's needs at that time is calculated.
Simulink model
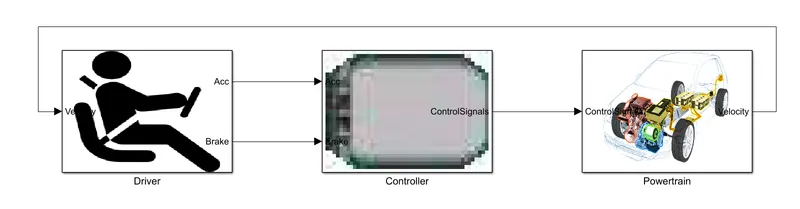
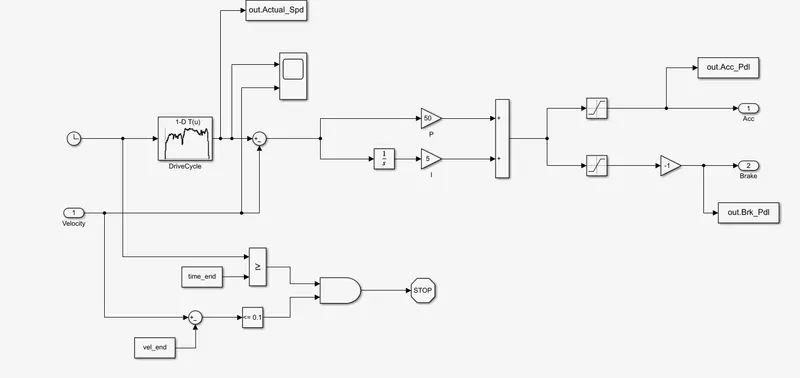
Driver subsystem
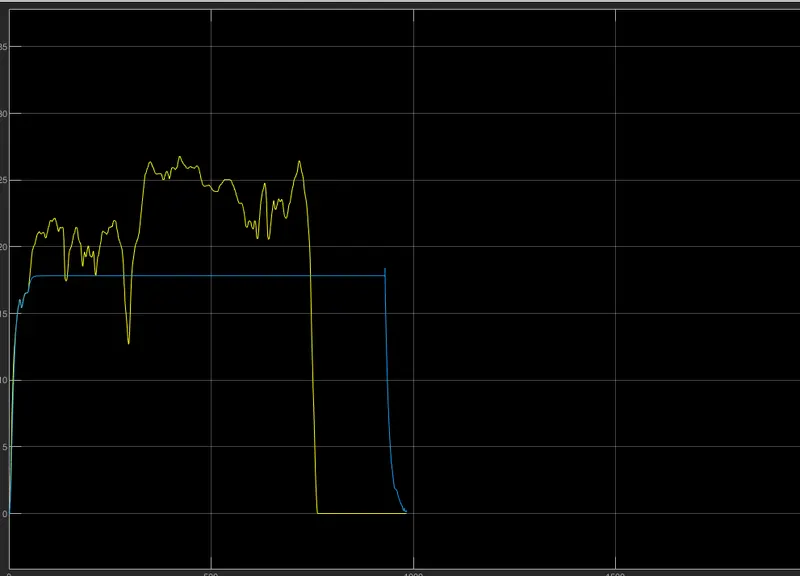
The drive cycle and the velocity of the vehicle are in resemblence with each other which shows the effective working of the model.
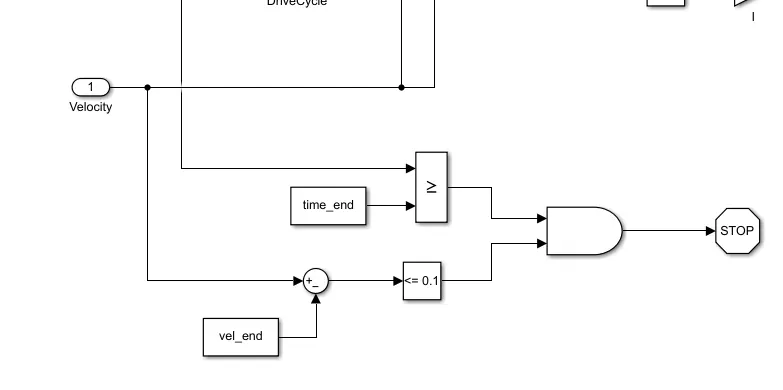
responsible for limiting the cycle according to drive cyccle.
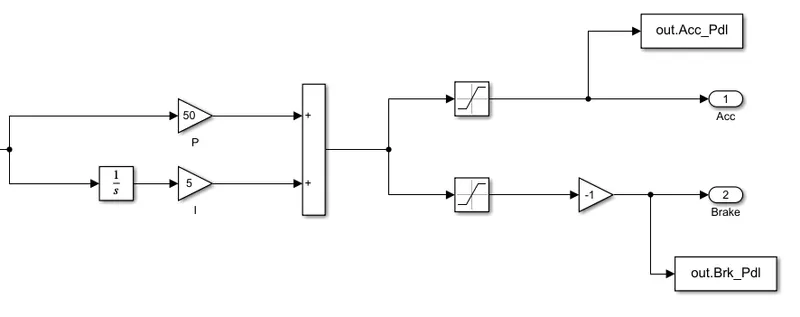
pi controller for controlling the input values with saturation block 0-100 for accerelator pedal.
0 to -100 for brake pedal.
Controller
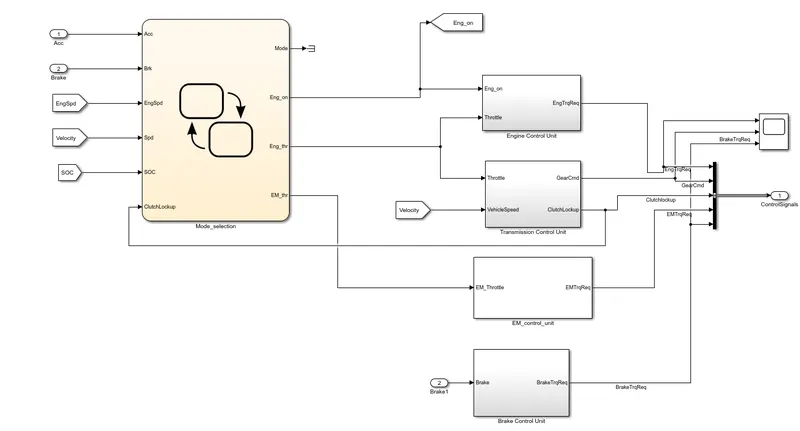
The state flow chart is used for selecting the mode of drive, eng on or off condition,engine throttle value.
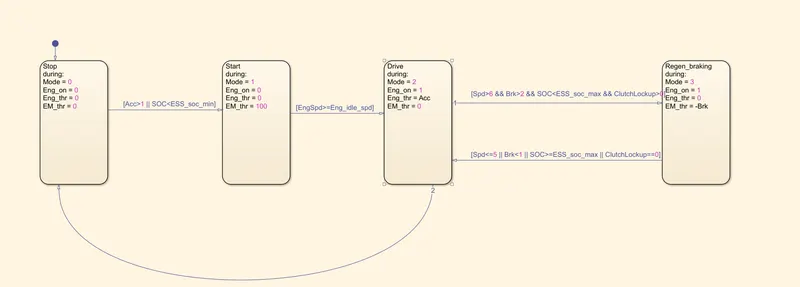
powertrain
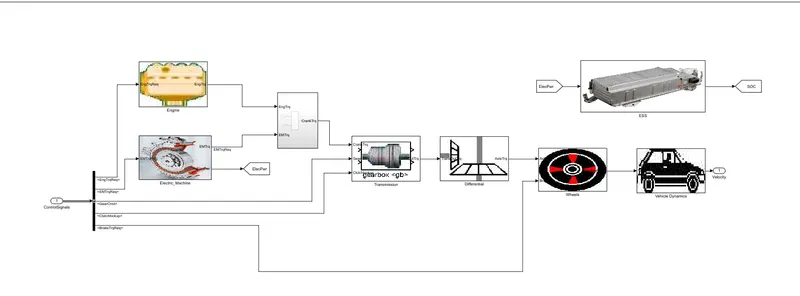
for HWFET drive cycle.
%% Post-Processing File
%  File for post-processing the hybrid vehicle simulation model data

%% Renaming variables
Time = out.tout;
Acc_Pdl = out.Acc_Pdl;          % Accelerator pedal [%]
Brk_Pdl = out.Brk_Pdl;          % Brake pedal [%]
Gear_Cmd = out.Gear_Cmd;        % Transmission gear
Trans_In_Spd = out.Trans_In_Spd.*30/pi;  % Transmission input speed [rpm]
Trans_Out_Spd = out.Trans_Out_Spd.*30/pi;% Transmission output speed [rpm]
Eng_Trq = out.Eng_Trq;          % Engine brake torque [Nm]
Eng_Spd = out.Eng_Spd.*30/pi;    % Engine speed [rpm]
Eng_Fuel_Consump = out.Eng_Fuel_Consumption;    % Engine fuel consumption [g]
Veh_Dist = out.Veh_Dist./1000;   % Distance traveled by vehicle [km]
Veh_Spd = out.Veh_Spd.*18/5;     % Vehicle speed [kmph]
wheelspd = out.wheelspd;
Actual_spd = out.Actual_Spd;

SOC = out.soc;
Voltage = out.terminal_voltage;
Current = out.packcurrent;
Motor_Trq = out.EmTrq;


%% Data Analysis
Eng_Pwr = (pi/30*Eng_Spd) *Eng_Trq/1000;   % Engine brake power [kW]
rho_petrol = 0.7197;                    % Density of petrol [kg/L]
kmpl = Veh_Dist(end)/(Eng_Fuel_Consump(end)/1000/rho_petrol)   % Fuel economy [kmpl]

figure('Name','UDDS DRIVING CYCLE');
plot(cyc_time,cyc_vel);
xlabel('Time [sec]');
ylabel('Speed ');
title('UDDS DRIVE CYCLE');
 %% Plotting vehicle characteristics time trace
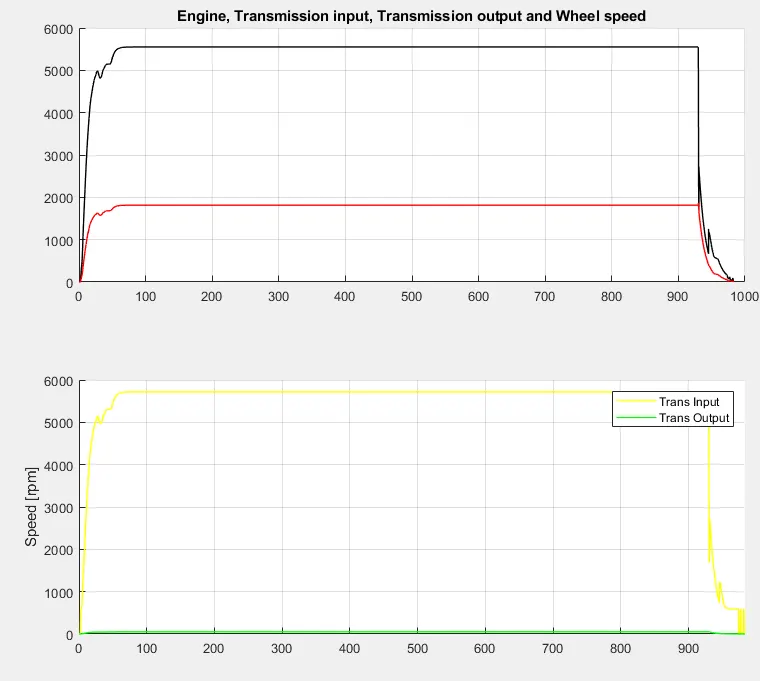
figure('Name','engine, transmission input, transmission output and wheel speed')
subplot(2,1,1)
hold on
grid on
plot(Trans_In_Spd, 'linewidth', 1, 'Color', 'black');
plot(Trans_Out_Spd, 'linewidth', 1, 'Color', 'red');
title('Engine, Transmission input, Transmission output and Wheel speed');

subplot(2,1,2)
hold on
grid on
plot(Eng_Spd, 'linewidth', 1, 'Color', 'yellow');
plot(wheelspd, 'linewidth', 1, 'Color', 'green');
ylabel('Speed [rpm]')
xlim([0, Time(end)]);
ylim([0, 6000]);
legend('Trans Input','Trans Output');

%%
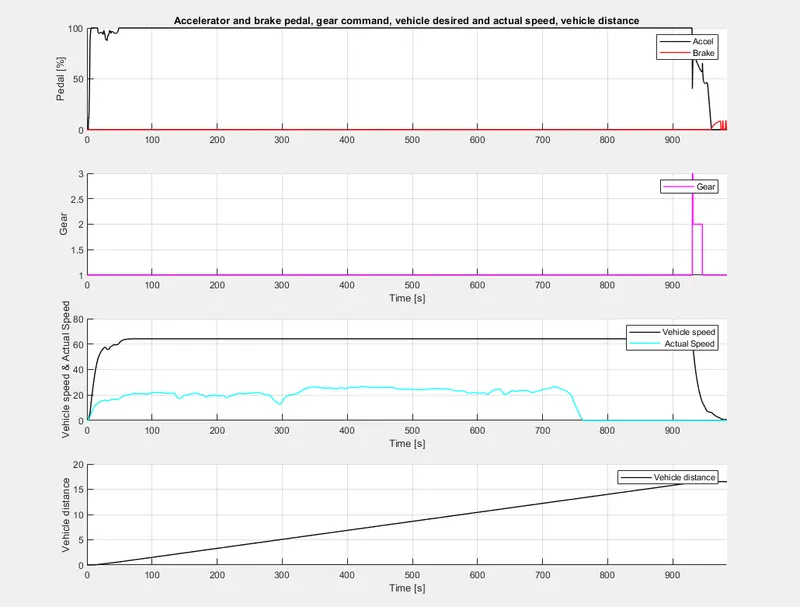
figure('Name','accelerator and brake pedal, gear command, vehicle desired and actual speed, vehicle distance')
subplot(4,1,1)
hold on
grid on
plot(Time, Acc_Pdl, 'linewidth', 1, 'Color', 'black');
plot(Time, Brk_Pdl, 'linewidth', 1, 'Color', 'red');
ylabel('Pedal [%]')
xlim([0, Time(end)]);
legend('Accel','Brake');
title('Accelerator and brake pedal, gear command, vehicle desired and actual speed, vehicle distance');

subplot(4,1,2)
hold on
grid on
plot(Gear_Cmd, 'linewidth', 1, 'Color', 'magenta');
xlim([0, Time(end)]);
xlabel('Time [s]');
ylabel('Gear');
legend('Gear');

subplot(4,1,3)
hold on
grid on
plot(Veh_Spd, 'linewidth', 1, 'Color', 'black');
plot(Actual_spd, 'linewidth', 1, 'Color', 'cyan');
xlim([0, Time(end)]);
xlabel('Time [s]');
ylabel('Vehicle speed & Actual Speed');
legend('Vehicle speed',' Actual Speed');

subplot(4,1,4)
hold on
grid on
plot(Veh_Dist, 'linewidth', 1, 'Color', 'black');
xlim([0, Time(end)]);
xlabel('Time [s]');
ylabel('Vehicle distance');
legend('Vehicle distance');

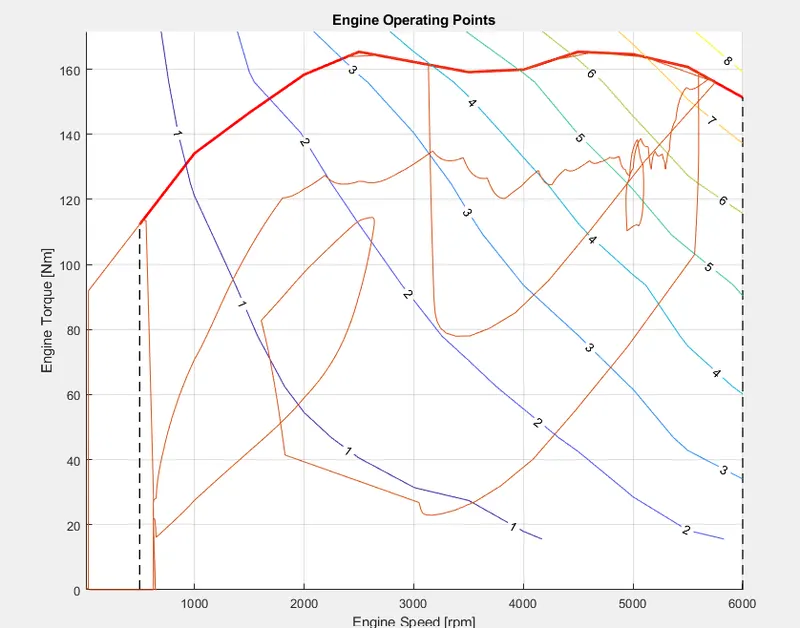
%% Plotting engine operating points on engine fuel map
figure('Name','Engine Operating Points');
hold on
grid on
title('Engine Operating Points');
p1=plot(30/pi*Eng_map_spd,Eng_max_trq,'linewidth',2,'color','r');
p2=line([Eng_map_spd(end)*30/pi Eng_map_spd(end)*30/pi],[0 Eng_max_trq(end)]);
set(p2,'linewidth',1,'linestyle','--','color','k');
p3=line([Eng_map_spd(1)*30/pi Eng_map_spd(1)*30/pi],[0 Eng_max_trq(1)]);
set(p3,'linewidth',1,'linestyle','--','color','k');
[c,h] = contour(Eng_map_spd'*30/pi,Eng_map_trq,Eng_fuel_map');
clabel(c,h);
xlabel('Engine Speed [rpm]');
ylabel('Engine Torque [Nm]');

% title('Engine Fuel Consumption Map [g/s]');
% p4 = plot(Eng_Spd,Eng_Trq(end),'.','color','k');
% legend([p1 p4],{'Max Curve','Operating Points'});
% axis([Eng_map_spd(1)*30/pi Eng_map_spd(end)*30/pi 0 Eng_map_trq(end)]);
data = xlsread('spd_trq.xlsx')
eng_spd1 = data(:,2);
eng_trq1 = data(:,5);
plot(eng_spd1,eng_trq1);
%%
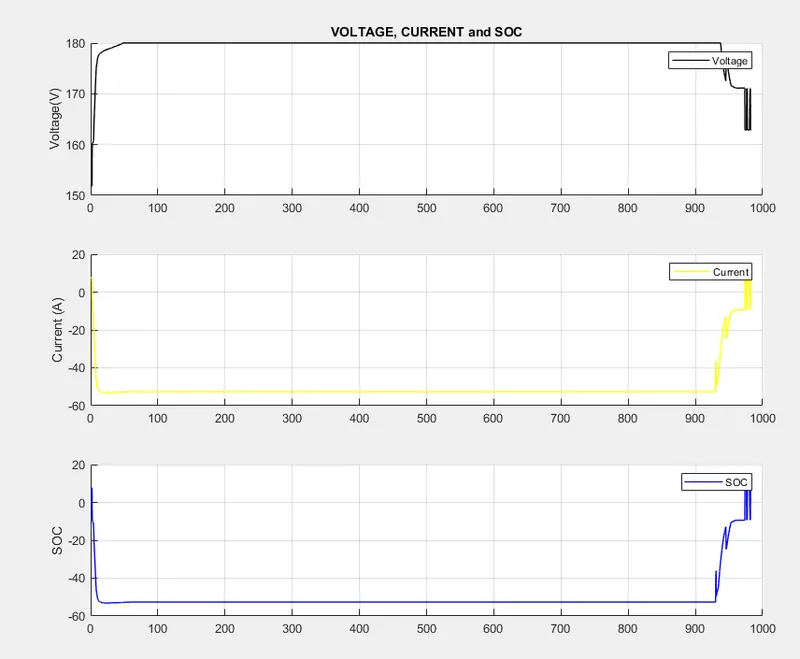
figure('Name','VOLTAGE, CURRENT and SOC')
subplot(3,1,1)
hold on
grid on
plot(Voltage, 'linewidth', 1, 'Color', 'black');
ylabel('Voltage(V)');
legend('Voltage');
title('VOLTAGE, CURRENT and SOC');

subplot(3,1,2)
hold on
grid on
plot(Current, 'linewidth', 1, 'Color', 'yellow');
ylabel('Current (A)');
legend('Current');


subplot(3,1,3)
hold on
grid on
plot(Current, 'linewidth', 1, 'Color', 'blue');
ylabel('SOC');
legend('SOC');
the required as shown below
KMPL VALUES OF ICE VS HYBRID
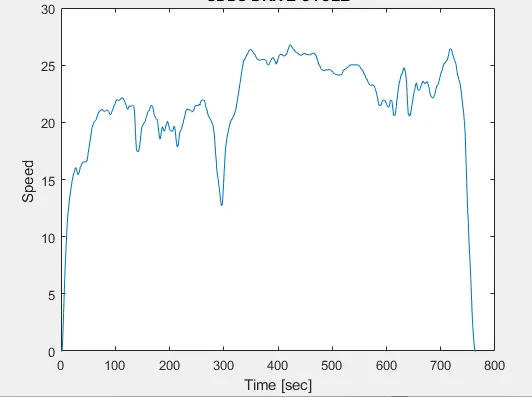
udds drive cycle
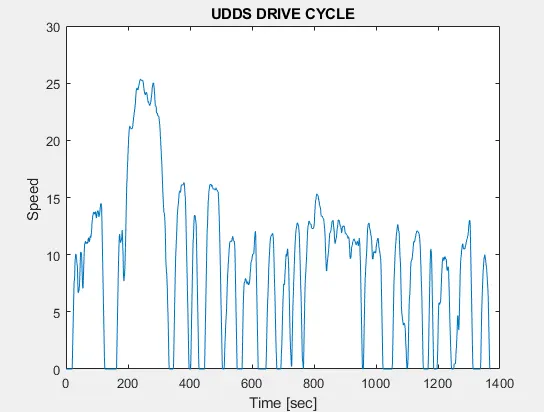
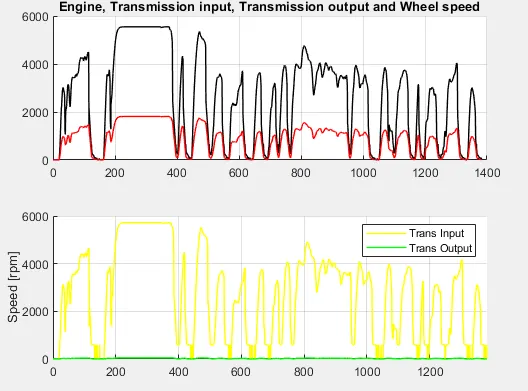
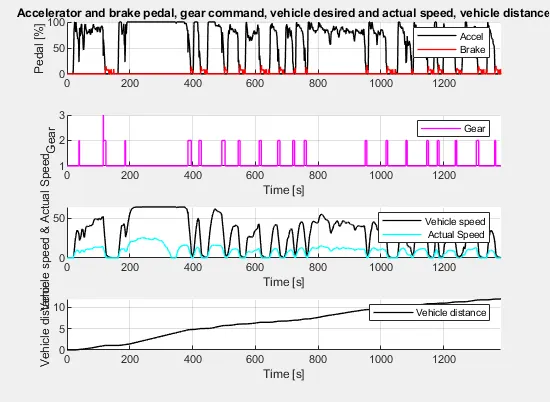
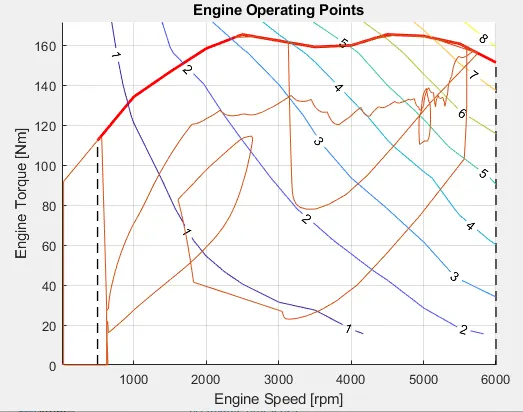
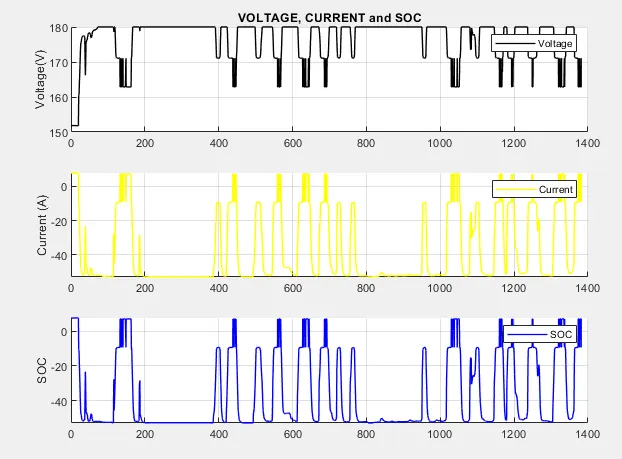
as can be inferred that all the variables follow the drive cycle