Project 2
Aim: To develop of a forward energy-based fuel consumption model of a P1 hybrid vehicle.
Objectives:
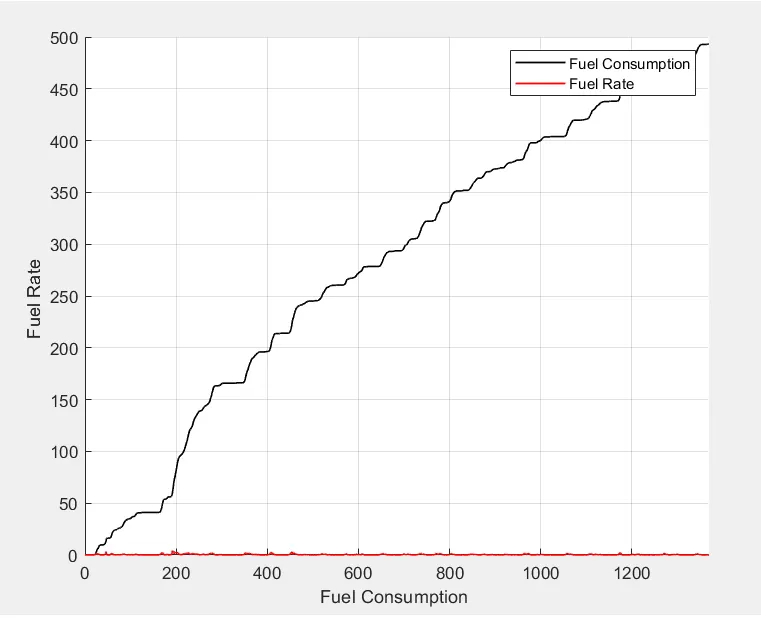
1) Tabulate the fuel economy numbers (kmpl) for UDDS and HWFET cycle. Compare these numbers with the baseline numbers for conventional vehicle model.
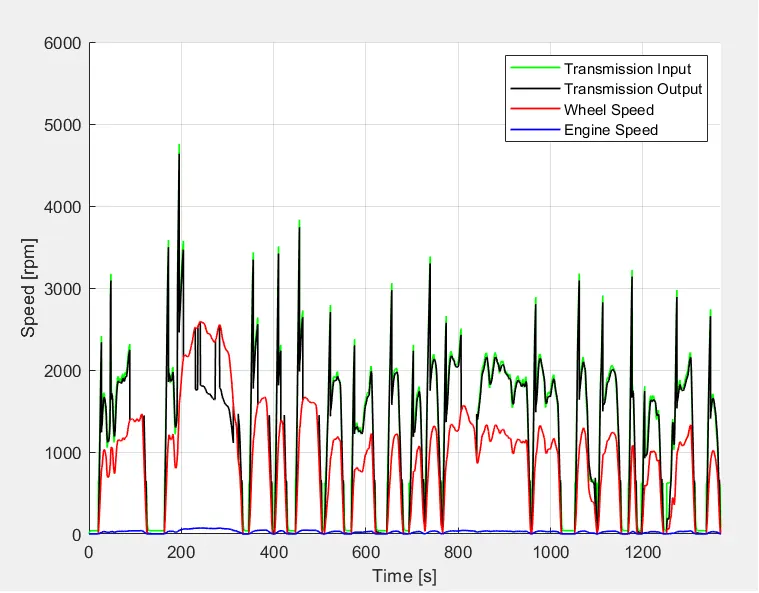
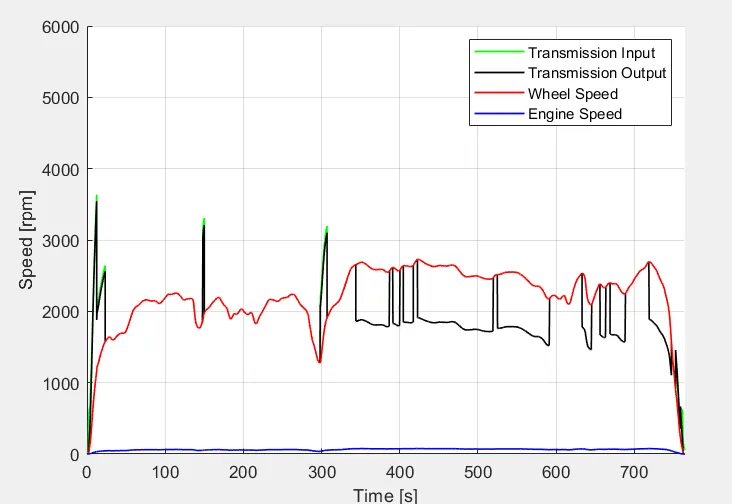
2) Plot the time trace for engine, transmission input, transmission output and wheel speed on one plot.
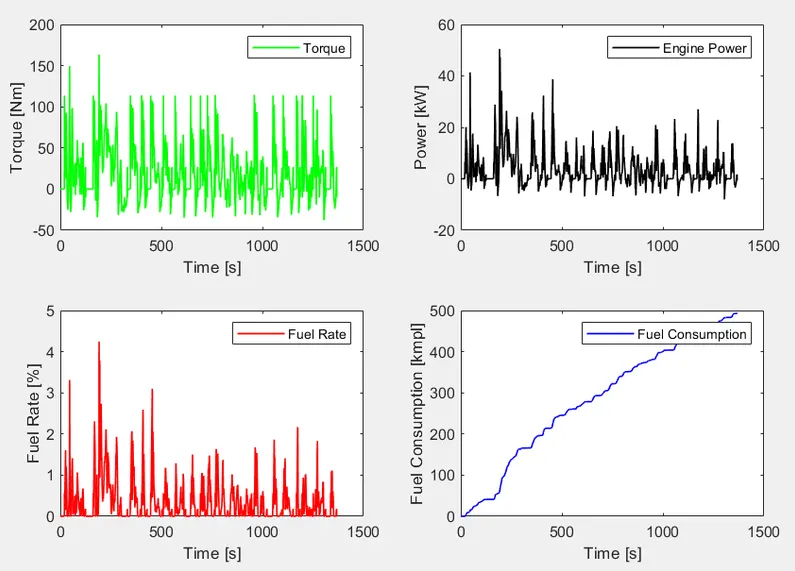
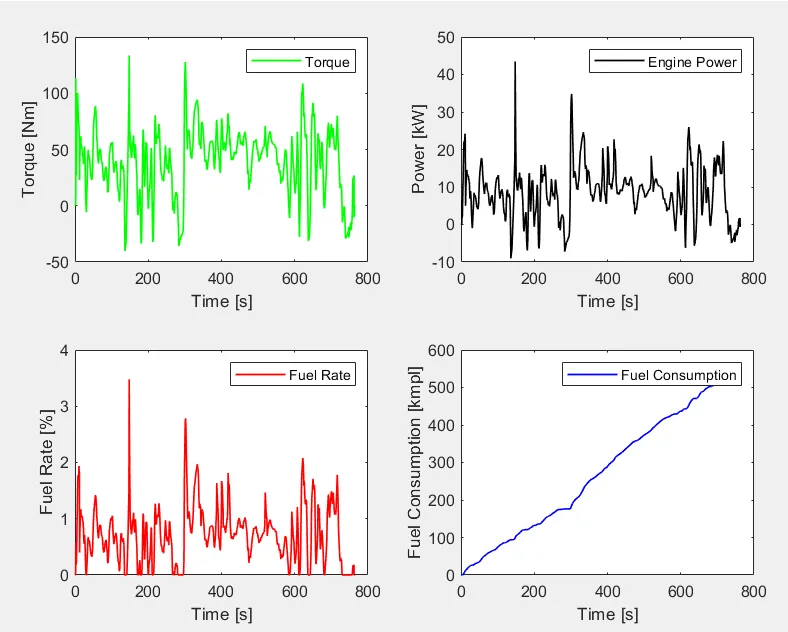
3) Plot engine torque, engine power, fuel rate and fuel consumption using subplots.
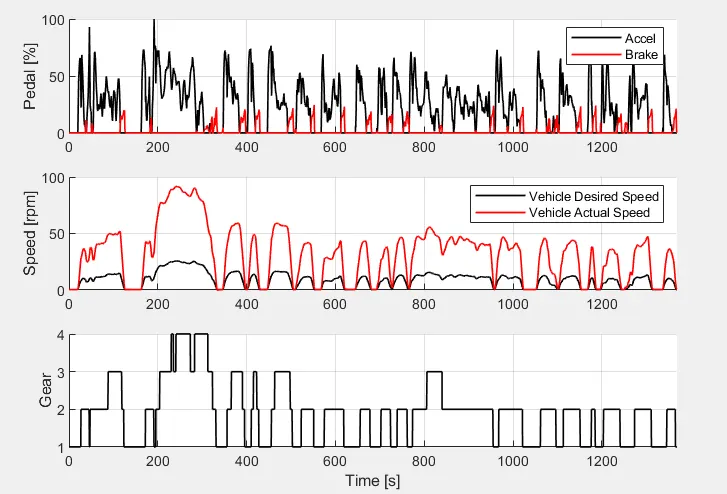
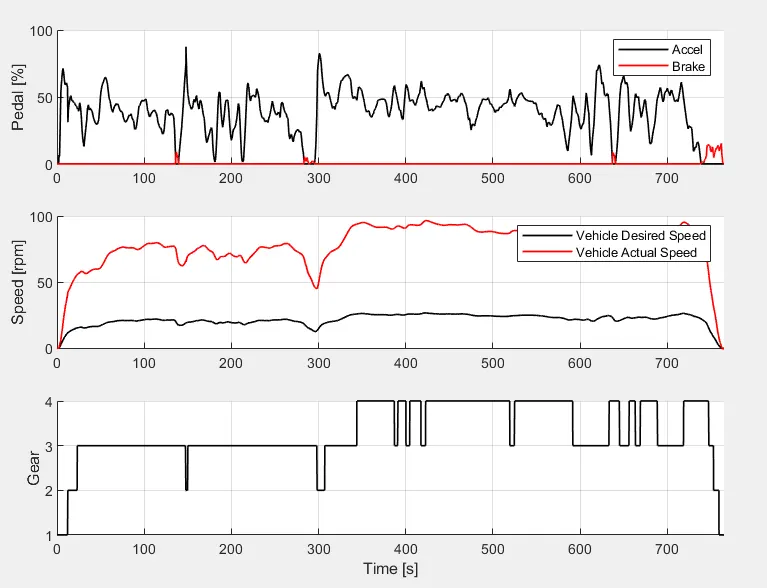
4) Plot accelerator and brake pedal, gear command, vehicle desired and actual speed, vehicle distance using subplots.
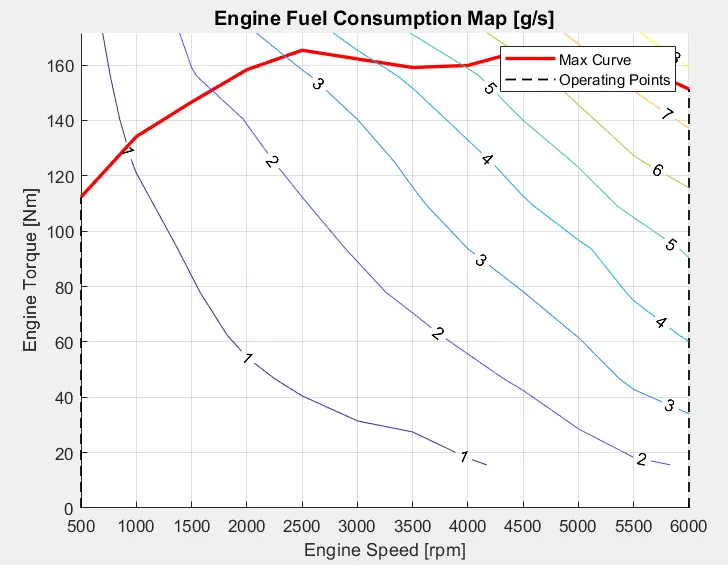
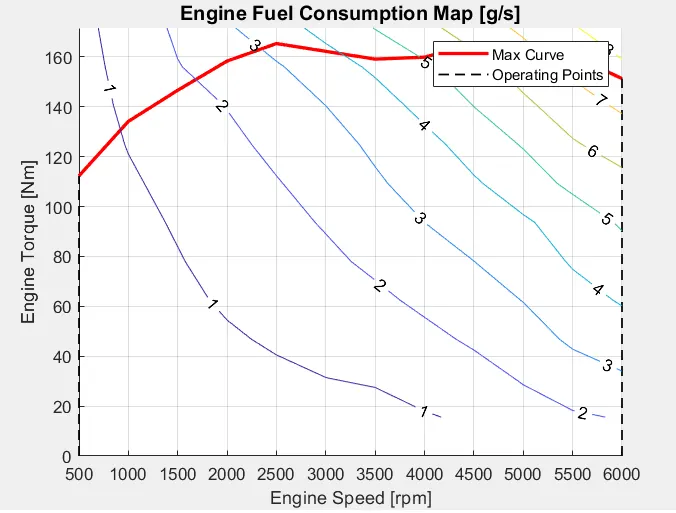
5) Plot the engine operating points on the engine fuel map.
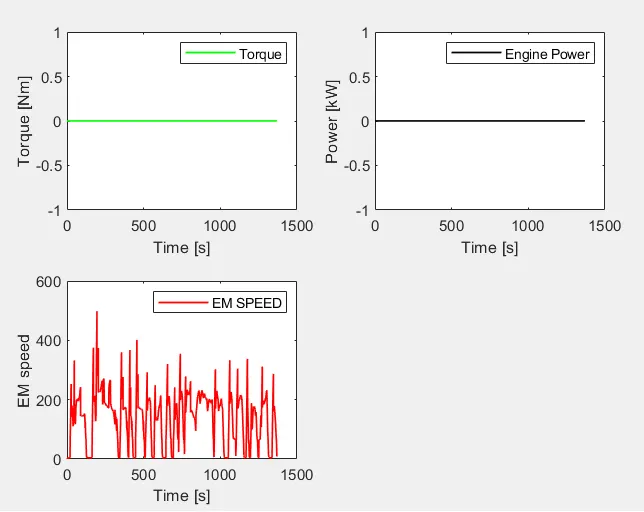
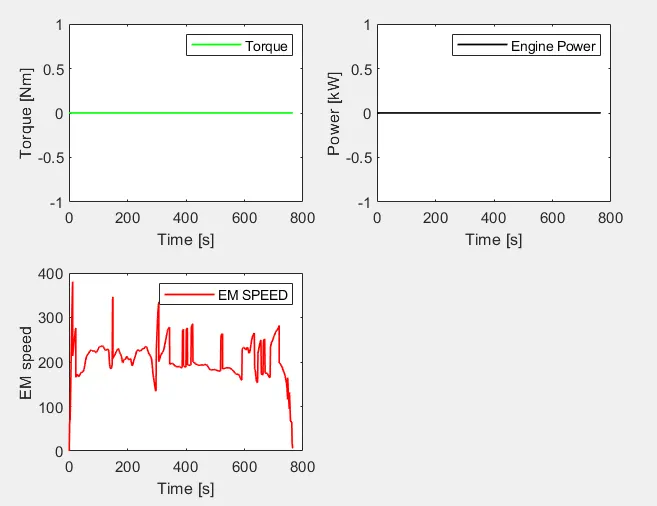
6) Plot motor speed, torque, motor input power using subplots.
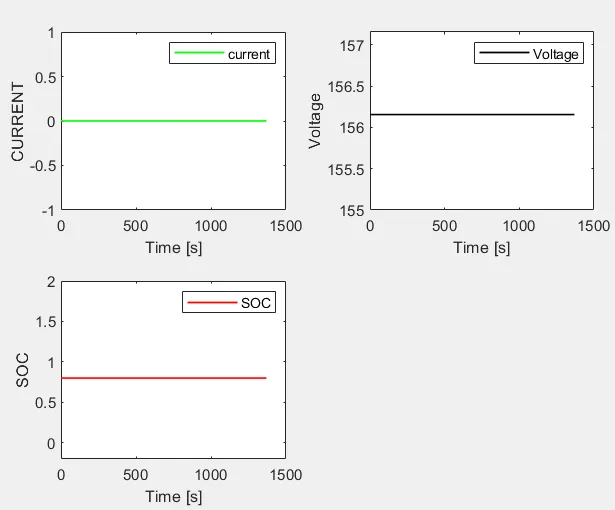
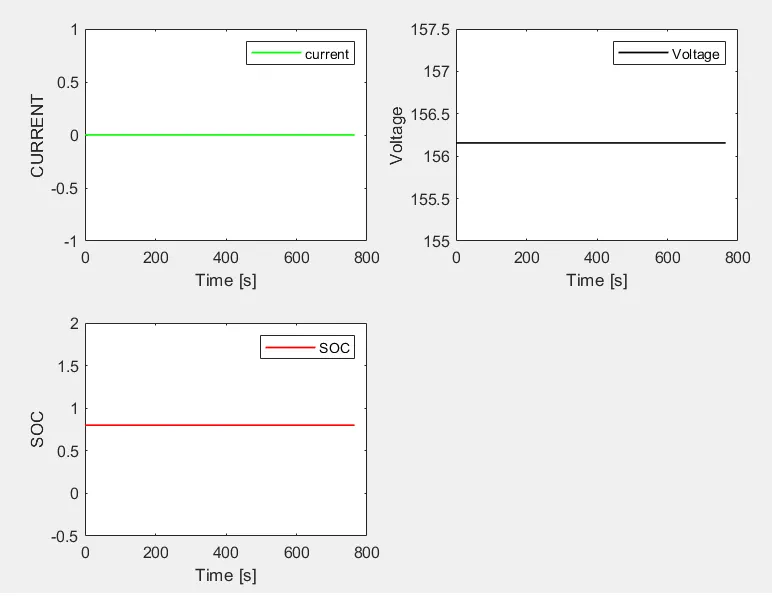
7) Plot pack voltage, current and SoC using subplots.
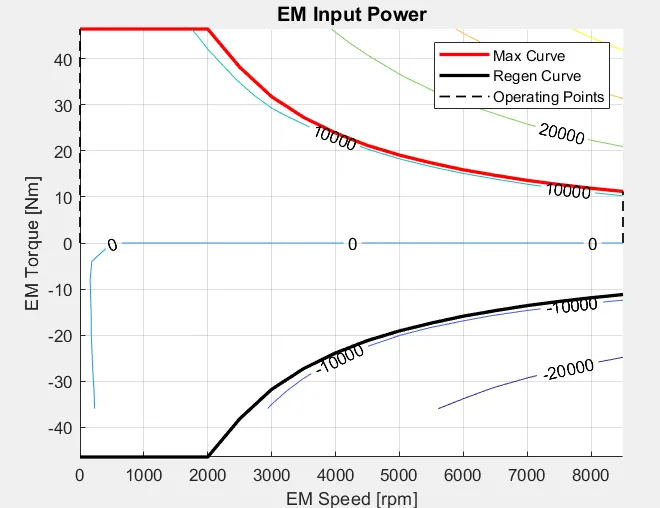
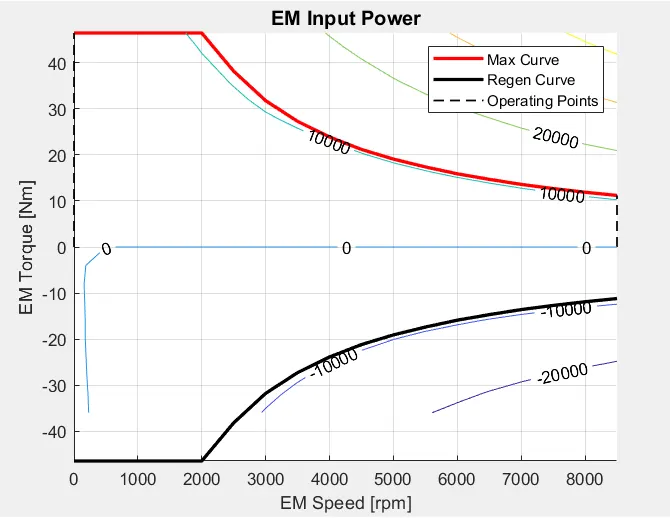
8) Plot the motor operating points on the motor input power map, with the motor max motoring and generating torque curves.
9) Write down appropriate brief comments on each of these plots, describing the vehicle behavior throughout the drive cycle.
10) Generate the plots for both drive cycles.
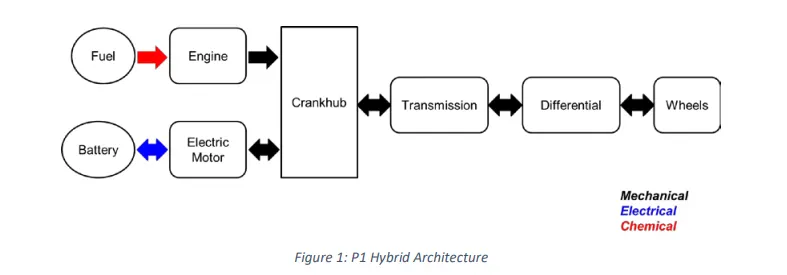
Theory-
Hybrid vehicles offer potential for significantly reduced fuel consumption and emissions during normal operation because of the scope for operating the prime mover at its optimum and the ability to meet sudden power demands from a combination of the prime mover and stored energy. Hybrid vehicles also can operate with zero emissions in sensitive urban environments.
Thus, despite the extra cost associated with hybrid vehicle systems, there will be circumstances in which the increased capital cost is justified. Compared to fuel cells, these vehicles use existing technology and can be produced more cheaply. They also offer the highest "well to wheel" efficiency.Parallel and series hybrid configurations are well established, but a dual hybrid system that combines features of series and parallel hybrid operation.
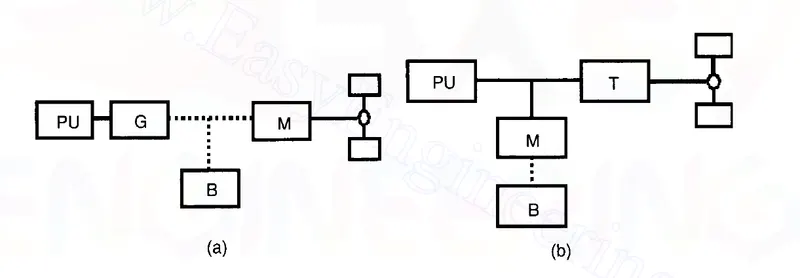
Figure shows the two basic types of hybrid electric vehicles: (1) series, and (2) parallel. Series hybrids have no mechanical connection between the engine and the road. The engine, or power unit (PU), instead drives a generator (G), producing electricity that thenis used to propel the vehicle via an electric motor (M). Any power excess or shortage is routed to onboard batteries (B), which also allow the vehicle to run as an EV
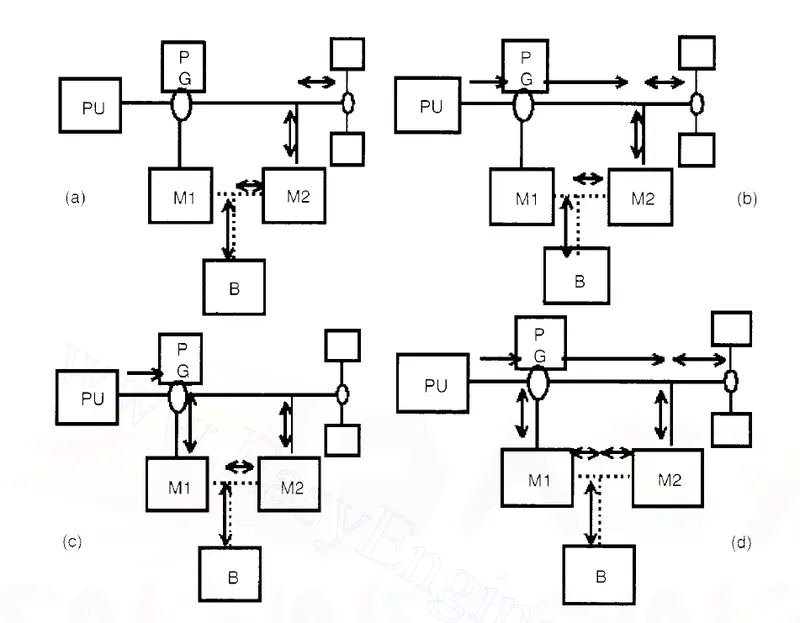
Electric Mode - (Fig.a) The engine is switched off, and Machine 1 acts as a "virtual clutch," keeping the engine speed at zero. Torque and regenerative braking are provided by Machine 2.
Parallel Mode - (Fig.b) Machine 1 is stationary (perhaps with a brake applied), and the configuration is a simple parallel one, with a fixed engine-to-road gear ratio.
Charging Mode - (Fig.c)The vehicle is stationary, and all of the engine power is used to drive Machine 1 and charge the batteries. Torque is still transferred to the wheels, allowing the car to "creep."
Dual Mode - (Fig.d) Some power is used to drive the wheels directly, while the remainder
powers Machine 1. The speed of Machine 1 determines the engine operating speed.
The charging and parallel modes are effectively subsets of the dual mode, and this continuity
in control is the real strength of the configuration. The dual hybrid configuration combines
the advantages of both series and parallel, as follows:
a. Optimal engine operating point at all times.
Alternative Vehicles and Case Studies
b. Much of the power (especially at cruising speeds) is delivered mechanically to the wheels,
thereby increasing efficiency.
c. Charging is possible, even when the vehicle is stationary.
d. The combined torque of the engine and Machine 2 is available, improving performance.
Compared to a series hybrid (where the electrical machines must be rated for the prime mover and the vehicle power requirement), only a fraction of the prime mover power is transmitted electrically in the dual hybrid system. The main difficulty with the dual hybrid is in the design of a control system, which must resolve the two degrees of freedom (engine speed and engine torque) and the associated transients into an optimal and robust control strategy. System modeling is essential for optimizing this.
Process-
Load the Project2 folder as the current folder in MATLAB. Run the 'Project_2InitFile.m' MATLAB script.
Initial MATLAB script-
%%%%%%%%%%%%%%%%%%%%%%%%%%%%%%%%%%%%%%%%%%%%%%%%%%%%%%%%%%%%%%%%%%%%%
%% Skill-Lync -> Hybrid Drives Development
% Project 1 - Conventional Vehicle Model
% By - Harsh Sahu

% Description:

%% Initialization File
% Initialization file for loading the variables for the Conventional vehicle simulation model

%% Vehicle Parameters
M = 1500;       % Vehicle weight [kg]
Cr = 0.015;     % Rolling resistance coefficient
Rw = 0.35;      % Rolling radius [m]
Cd = 0.33;      % Drag coefficient
Af = 2;         % Frontal area [m2]
rhoa = 1.225;   % Air density [kg/m3]
Vwind = 0;      % Wind velocity [kmph]
g = 9.81;       % Gravitational acceleration [m/s2]
theta = 0;      % Slope [deg]
myu_road_tire = 1; % Coefficient of friction between tire - road interface

%% Powertrain Parameters
FDR = 3.73;                         % Final Drive Ratio / Diff Ratio
DiffEff = 0.99;                     % Differential efficiency (assumed independent of operating conditions)

NumGear = 4;                        % Number of gears in transmission
TransGear = [1:NumGear];            % Transmission Gears
TransRatio = [3.06, 1.62, 1, 0.7];  % Corresponding Transmission ratios
TransEff = 0.90;                    % Transmission efficiency (assumed independent of operating conditions)

TC_SR = [0, .5, .6, .7, .8, .87, .92, .94, .96, .97, 1];   % Torque Converter Speed Ratio (Matlab default) -> TurbSpd/PumpSpd
TC_TR = [2.232, 1.5462, 1.4058, 1.2746, 1.1528, 1.0732, 1.0192, 1, 1, 1, 1];   % Torque Converter Torque Ratio (Matlab default) -> TurbTrq/PumpTrq
TC_Cf = 1e-4 * [.72558, .66322, .63463, .59042, .51331, .4144, .29287, .22444, .12186, .04386, 0]; % Torque Converter Capacity Factor (Matlab default) -> PumpTrq/PumpSpd^2 [Nm/rpm^2]

load Vehicle_Data/Engine_data_1_9L_Saturn_95kW
load Vehicle_Data/Trans_Shift_map
load Vehicle_Data/EM_Honda_Insight_10kW
load Vehicle_Data/ESS_NiMH6


ESS_init_soc = 0.8;
ESS_soc_max = 0.9;
ESS_soc_min = 0.6;


%% Driver Parameters
Kp = 10;                    % P gain for driver PI model
Ki = 1;                     % I gain for driver PI model
Drive_Cycle_Select = 1;     % Drive cycle selection

% Drive cycle values in m/s

if Drive_Cycle_Select == 1
    load DriveCycles/UDDS;

elseif Drive_Cycle_Select == 2
    load DriveCycles/HWFET;

elseif Drive_Cycle_Select == 3
    load DriveCycles/FTP;

elseif Drive_Cycle_Select == 4
    load DriveCycles/US06;

elseif Drive_Cycle_Select == 5
    load DriveCycles/NEDC;

elseif Drive_Cycle_Select == 6
    load DriveCycles/WLTP;

end

time_end = cyc_time(end);
vel_end = cyc_vel(end);
After running this coding file open simulink model.
Simulink Model:
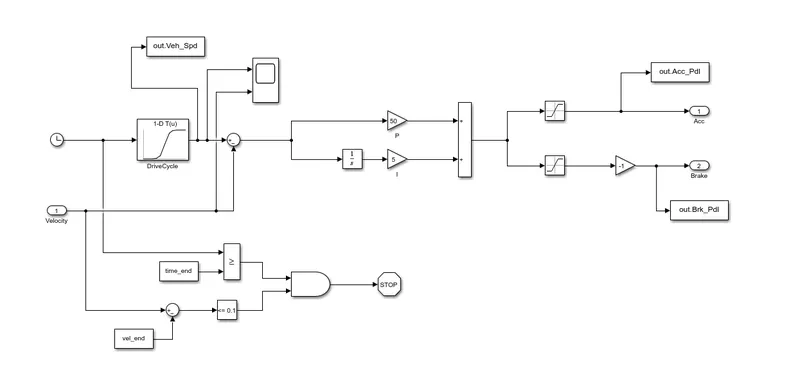
a)It is modeled using a 'Driver' block, which is a basic PI controller that generates accelerator and brake pedal outputs to match the desired and actual vehicle speeds.
b)the accelerator and brake pedal data is generated using the drive cycle data in which is fed through lookup table.
Driver block:
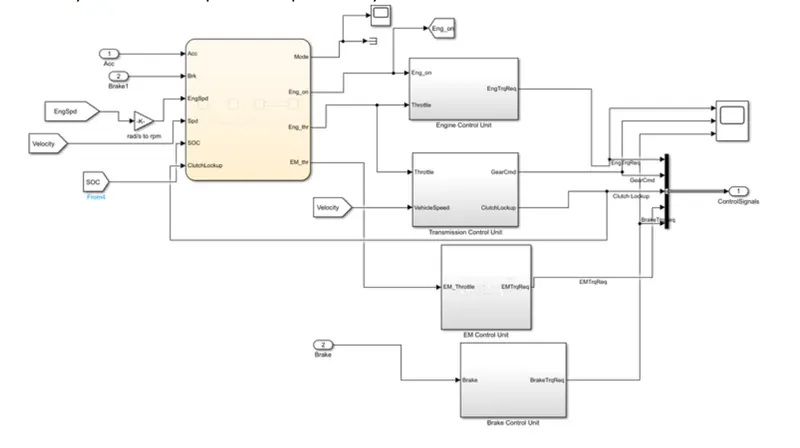
Contoller block: The controller block is the brain of the, representing the electronic control units. Based on the driver inputs, It generates desired engine torque desired transmission gear and desired brake torque, Electric motor torque and clutch lock by with the help of suervisory controller.
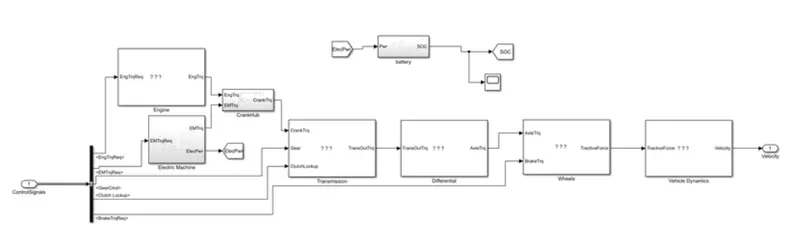
Powertrain block: The data inputs are fed to the powertrain block which represents the drivetrain of the vehicle. It consists of an 'engine' connected to automatic transmission through a 'Torque Converter'. The output of the transmission is connected to the 'Differential', which powers the 'Wheels' that provides the tractive force for vehicle acceleration. The longitudinal dynamics of the vehicle along with the road load is represented in the 'Vehicle Dynamics' block. The solver selected is ode3 with a fixed step size of 0.01 sec.
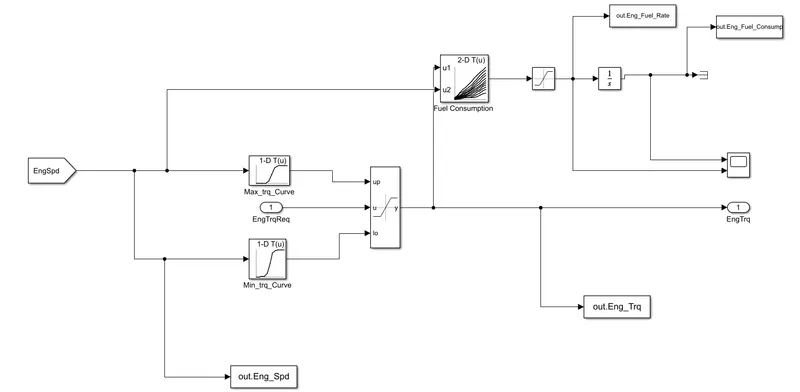
The engine block:
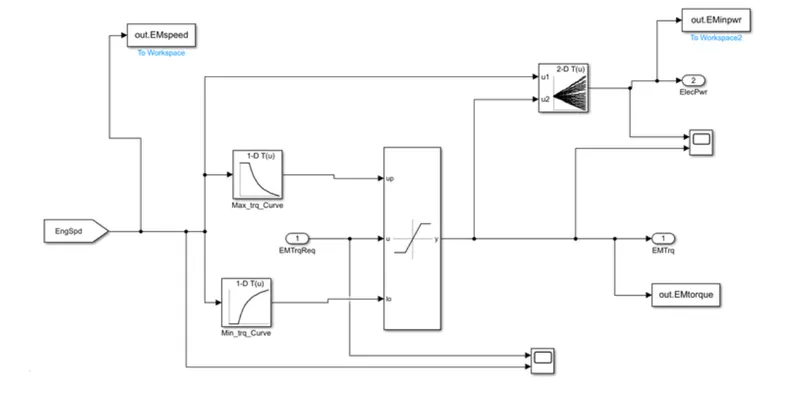
The electric motor block:
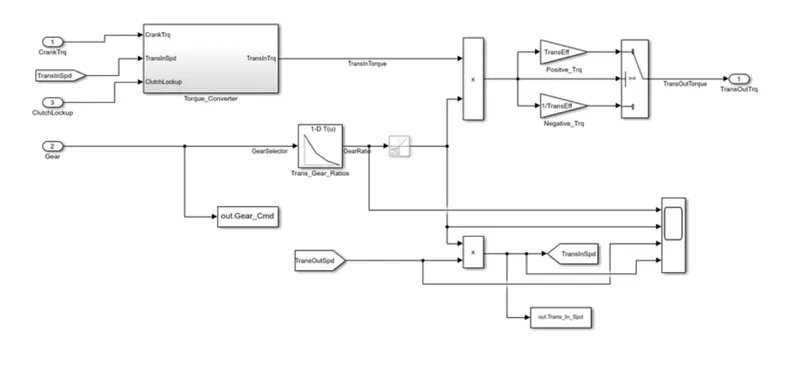
The transmission block:
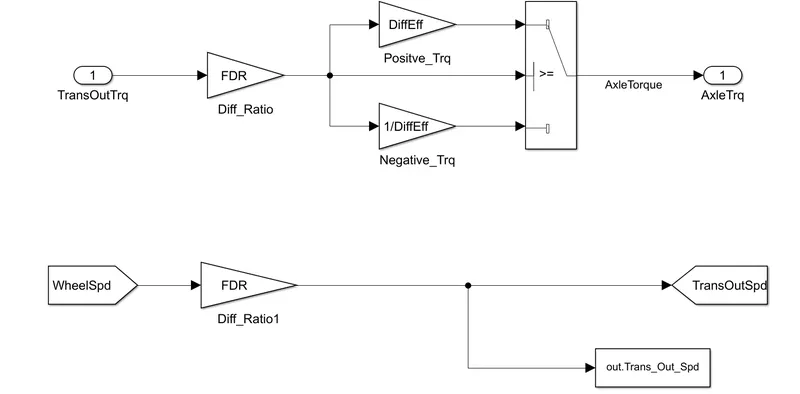
The differential block:
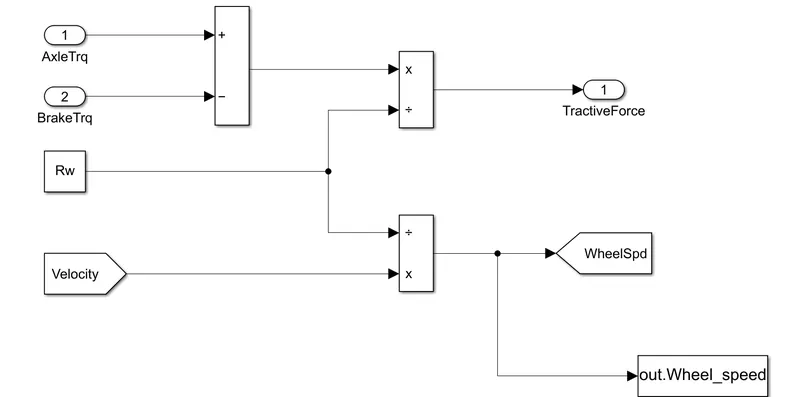
The wheels block:
The vehicle dynamics block:
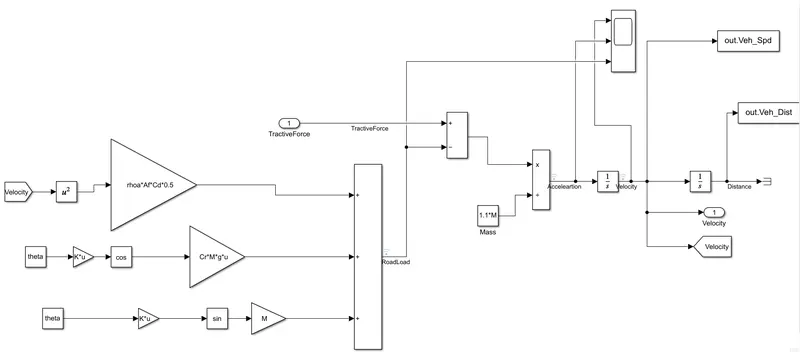
The equation used here is:

Post processing:
a)The data from the simulink model was transferred to MATLAB workspace using 'To workspace' block.
b)A post processing MATLAB code was used to generate the necessary plots.
The Post processing MATLAB scripts:
%%%%%%%%%%%%%%%%%%%%%%%%%%%%%%%%%%%%%%%%%%%%%%%%%%%%%%%%%%%%%%%%%%%%%
%% Skill-Lync -> Hybrid Drives Development
% Project 1 - Conventional Vehicle Model
% By - Harsh Sahu

% Description:
% The following file is to used with the Initialization file and Simulink
% results for post-processing of the data.
% The file is incomplete, has some examples of how the data is imported
% into a readable format, data analysis and plotting examples.
% Based on the project task, use commands in a similar format as given
% below, to analyse the data and generate required plots.
% You can change variable names if desired

%% Post-Processing File
%  File for post-processing the Conventional vehicle simulation model data

%% Renaming variables
Time = out.tout;
Acc_Pdl = out.Acc_Pdl;          % Accelerator pedal [%]
Brk_Pdl = out.Brk_Pdl;          % Brake pedal [%]
Gear_Cmd = out.Gear_CMD;        % Transmission gear
Trans_In_Spd = out.Trans_In_Spd*30/pi;  % Transmission input speed [rpm]
Trans_Out_Spd = out.Trans_Out_Spd*30/pi;% Transmission output speed [rpm]
Eng_Trq = out.Eng_Trq;          % Engine brake torque [Nm]
Eng_Spd = out.Eng_Spd*30/pi;    % Engine speed [rpm]
Eng_Fuel_Consump = out.Eng_Fuel_Consumption;    % Engine fuel consumption [g]
Veh_Dist = out.Veh_Dist/1000;   % Distance traveled by vehicle [km]
Veh_Spd = out.Veh_Spd*18/5;     % Vehicle speed [kmph]
Wheel_speed = out.WheelSpeed; % Wheel speed [kmph]
Eng_Fuel_rate = out.Eng_Fuel_Rate; % Engine Fuel Rate [%]
Veh_Desired_Speed= out.Veh_Desired_Speed;% Desired Vehicle speed [kmph]

EM_Speed = out.EMSpd*18/5;   % Electric motor speed
EM_Power = out.EMPwr;        % Electric motor power
EM_Torque = out.EMTrq;       % Electric motor torque
Term_Volt = out.term_volt;   % Terminal voltage of battery
SOC = out.SOC;               % State of charge
Pack_Current = out.Pack_Current; % Pack current of battery

%% Data Analysis
Eng_Pwr = Eng_Spd*pi/30*Eng_Trq/1000;   % Engine brake power [kW]
rho_petrol = 0.7197;                    % Density of petrol [kg/L]
%kmpl = Veh_Dist(end)/(Eng_Fuel_Consump(end)/1000/rho_petrol);    % Fuel economy [kmpl]


%Eng_Trq = Eng_Trq.Data(:,1);                       % Engine torque [Nm]
%Eng_Spd = Eng_Spd.Data(:,1);                       % Engine speed [rpm]
%Eng_Pwr = Eng_Pwr.Data(:,1);                       % Engine power
%Eng_Fuel_Consump = Eng_Fuel_Consumption.Data(:,1); % Engine fuel consumption [g]
%Eng_Fuel_rate = Eng_Fuel_Rate.Data(:,1);           % Engine Fuel Rate [%]


%EM_Speed = EM_Speed.Data(:,1);                     % Electric motor speed
%EM_Power = EM_Power.Data(:,1);                     % Electric motor power
%EM_Torque = EM_Torque.Data(:,1);                   % Electric motor torque
%Term_Volt = out.term_volt;                         % Terminal voltage of battery
%SOC = SOC.Data(:,1);                               % State of charge
%Pack_Current = Pack_Current.Data(:,1);             % Pack current of battery


% Plotting Fuel consumption vs Fuel rate
figure(1)
hold on
grid on
plot(Time, Eng_Fuel_Consump.Data,'linewidth',1,'color','black');
plot(Time, Eng_Fuel_rate.Data,'linewidth',1,'color','red');
xlabel('Fuel Consumption')
ylabel('Fuel Rate')
xlim([0,time_end(end)]);
legend('Fuel Consumption','Fuel Rate');


% Plotting vehicle characteristics time trace Engine, Transmission Input, Transmission Output and Wheel speed
figure(2)
hold on
grid on
plot(Eng_Spd,'linewidth',1,'Color','g');
plot(Trans_In_Spd,'linewidth',1,'Color','black');
plot(Trans_Out_Spd,'linewidth',1,'Color','red');
plot(Wheel_speed,'linewidth',1,'Color','blue');
xlabel('Time [s]')
ylabel('Speed [rpm]')
xlim([0,time_end(end)]);
ylim([0,6000]);
legend('Engine Speed','Transmission Input','Transmission Output','Wheel Speed');


% Plotting vehicle characteristics time trace engine torque, engine power, fuel rate and fuel consumption

figure(3)
subplot(2,2,1)
plot(Time,Eng_Trq.Data,'linewidth',1,'Color','g');
xlabel('Time [s]');
ylabel('Torque [Nm]');
legend('Torque')

subplot(2,2,2)
plot(Time,Eng_Pwr.Data,'linewidth',1,'Color','black');
xlabel('Time [s]');
ylabel('Power [kW]');
legend('Engine Power')

subplot(2,2,3)
plot(Time, Eng_Fuel_rate.Data, 'linewidth', 1, 'Color', 'red');
xlabel('Time [s]');
ylabel('Fuel Rate [%]');
legend('Fuel Rate')

subplot(2,2,4)
plot(Time,Eng_Fuel_Consump.Data,'linewidth',1,'Color','blue');
xlabel('Time [s]');
ylabel('Fuel Consumption [kmpl]');
legend('Fuel Consumption')

% Plotting vehicle characteristics time trace accelerator and brake pedal, gear command, vehicle desired and actual speed.
figure(4)
subplot(3,1,1)
hold on
grid on
plot(Time,Acc_Pdl,'LineWidth',1,'Color','black');
plot(Time,Brk_Pdl,'LineWidth',1,'Color','red');
ylabel('Pedal [%]')
xlim([0,time_end(end)]);
legend('Accel','Brake');

subplot(3,1,2)
hold on
grid on
plot(Veh_Desired_Speed,'LineWidth',1,'Color','black');
%plot(Time,Veh_Spd,'LineWidth',1,'Color','red');
ylabel('Speed [rpm]')
xlim([0, time_end(end)]);
legend('Vehicle Desired Speed','Vehicle Actual Speed');

subplot(3,1,3)
hold on
grid on
plot(Time,Gear_Cmd,'LineWidth',1,'Color','black');
plot(Time,Brk_Pdl,'LineWidth',1,'Color','red');
xlim([0, cyc_time(end)]);
xlabel('Time [s]')
ylabel('Gear')


% Plotting engine operating points on engine fuel map
figure('Name','Engine Operating Points');
hold on
grid on
title('Engine Operating Points','fontsize',12);
p1=plot(Eng_map_spd*30/pi,Eng_max_trq,'linewidth',2,'color','r');
p2=line([Eng_map_spd(end)*30/pi Eng_map_spd(end)*30/pi],[0 Eng_max_trq(end)]);
set(p2,'linewidth',1,'linestyle','--','color','k');
p3=line([Eng_map_spd(1)*30/pi Eng_map_spd(1)*30/pi],[0 Eng_max_trq(1)]);
set(p3,'linewidth',1,'linestyle','--','color','k');
[c,h] = contour(Eng_map_spd'*30/pi,Eng_map_trq,Eng_fuel_map');
clabel(c,h);
xlabel('Engine Speed [rpm]');
ylabel('Engine Torque [Nm]');
title('Engine Fuel Consumption Map [g/s]');
%p4 = plot(Eng_Spd,Eng_Trq,'.','color','k');
legend([p1 p3],{'Max Curve','Operating Points'});
axis([Eng_map_spd(1)*30/pi Eng_map_spd(end)*30/pi 0 Eng_map_trq(end)]);

%Plotting Motor speed,Torque,Motor input power
figure(6)
subplot(2,2,1)
grid on
plot(EM_Torque,'linewidth',1,'color','g');
xlabel('Time[s]')
ylabel('EM Torque[Nm]')
xlim([0,time_end(end)]);
legend('Torque');

subplot(2,2,2)
grid on
plot(EM_Power,'linewidth',1,'color','black');
xlabel('Time[s]')
ylabel('EM Power[kW]')
xlim([0,time_end(end)]);
legend('EM Power');

subplot(2,2,3)
grid on
plot(EM_Speed,'linewidth',1,'color','red');
xlabel('Time[s]')
ylabel('EM Speed')
xlim([0,time_end(end)]);
legend('EM Speed');

% Plotting Pack Voltage, Current, SOC
figure(7)
subplot(2,2,1)
grid on
plot(Pack_Current,'linewidth',1,'color','g');
xlabel('Time[s]')
ylabel('Current')
xlim([0,time_end(end)]);
legend('Current');

subplot(2,2,2)
grid on
plot(Term_Volt,'linewidth',1,'color','black');
xlabel('Time[s]')
ylabel('Voltage[V]')
xlim([0,time_end(end)]);
legend('Voltage');

subplot(2,2,3)
grid on
plot(SOC,'linewidth',1,'color','red');
xlabel('Time[s]')
ylabel('SOC')
xlim([0,time_end(end)]);
legend('SOC');


% Plotting EM operating points on EM map
figure('Name','EM Operating Points');
hold on
grid on
title('Engine Operating Points','fontsize',12);
p1=plot(EM_map_spd*30/pi,EM_max_trq,'linewidth',2,'color','r');
p4=plot(EM_map_spd*30/pi,EM_max_gen_trq,'LineWidth',2,'Color','black');
p2=line([EM_map_spd(end)*30/pi EM_map_spd(end)*30/pi],[0 EM_max_trq(end)]);
set(p2,'linewidth',1,'linestyle','--','color','k');
p3=line([EM_map_spd(1)*30/pi EM_map_spd(1)*30/pi],[0 EM_max_trq(1)]);
set(p3,'linewidth',1,'linestyle','--','color','k');
[c,h] = contour(EM_map_spd'*30/pi,EM_map_trq,EM_inpwr_map');
clabel(c,h);
xlabel('EM Speed [rpm]');
ylabel('EM Torque [Nm]');
title('EM Input Power');
%p4 = plot(Eng_Spd,Eng_Trq,'.','color','k');
legend([p1 p4 p3],{'Max Curve','Regen Curve','Operating Points'});
axis([EM_map_spd(1)*30/pi EM_map_spd(end)*30/pi 0 EM_map_trq(end)]);
Plots for UDDS cycle-
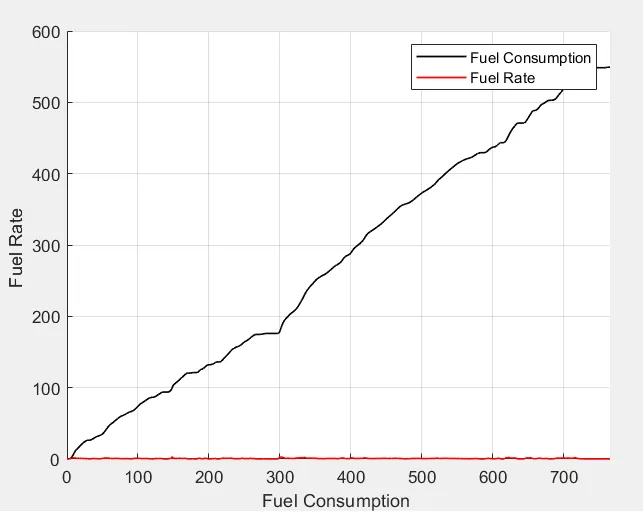
1)Fuel consumption vs Fuel rate:
2) Vehicle characteristics time trace Engine, Transmission input, Transmission output and Wheel Speed:
3) Vehicle characteristics time trace Engine torque, Engine power, Fuel rate, and fuel consumption:
4) Vehicle characteristics time trace accelerator and brake pedal, Gear command, Vehicle desired and actual speed:
5) Engine operating points on engine fuel map:
6) Motor speed, Torque, Motor input power characteristics:
7) Pack Voltage, Pack Current, SOC Characteristics:
8) EM Operating Points:
Plots for HWFET cycle-
1)Fuel consumption vs Fuel rate:
2) Vehicle characteristics time trace Engine, Transmission input, Transmission output and Wheel Speed:
3) Vehicle characteristics time trace Engine torque, Engine power, Fuel rate, and fuel consumption:
4) Vehicle characteristics time trace accelerator and brake pedal, Gear command, Vehicle desired and actual speed:
5) Engine operating points on engine fuel map:
6) Motor speed, Torque, Motor input power characteristics:
7) Pack Voltage, Pack Current, SOC Characteristics:
8) EM Operating Points:
Conclusion:The forward energy-based fuel consumption model of a P1 hybrid electric vehicle was developed using MATLAB and SIMULINK and the plots were obtained for UDDS and HWFET cycles.