Project 2
1) UDDS cycle:
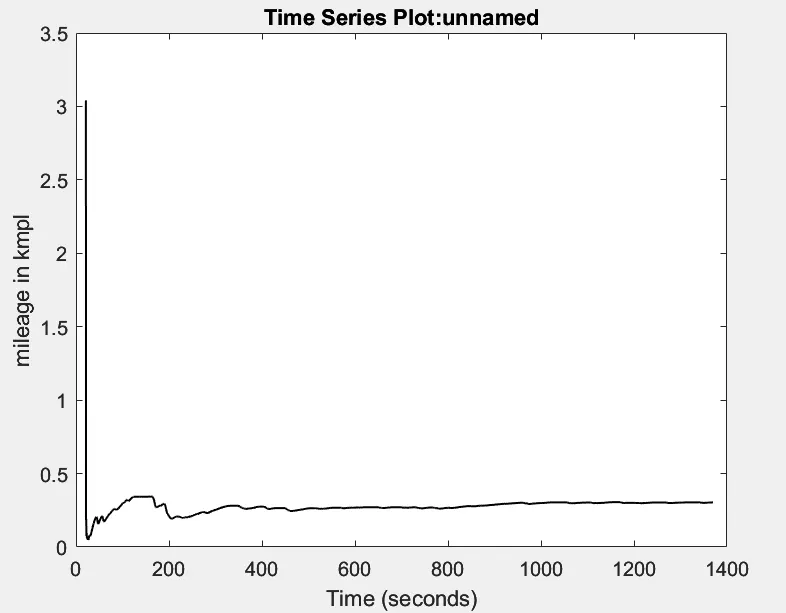
- Fuel economy (kmpl)
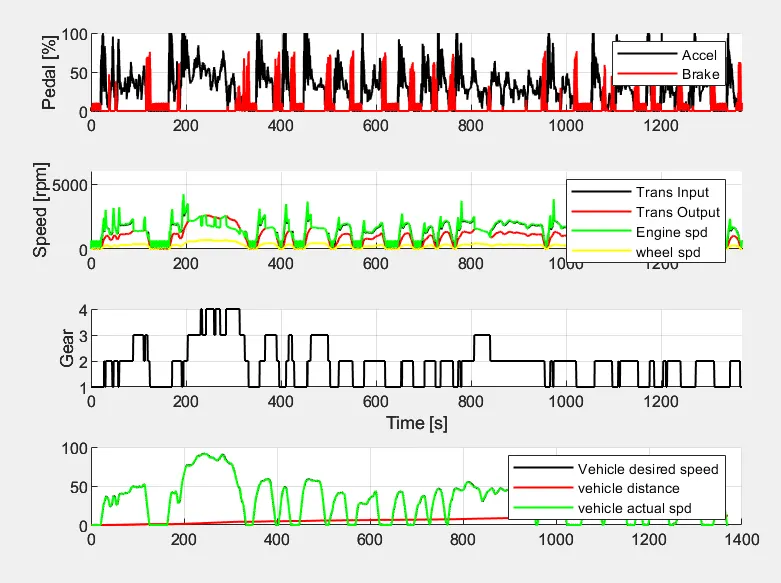
- Plot the time trace for engine, transmission input, transmission output and wheel speed on one plot.
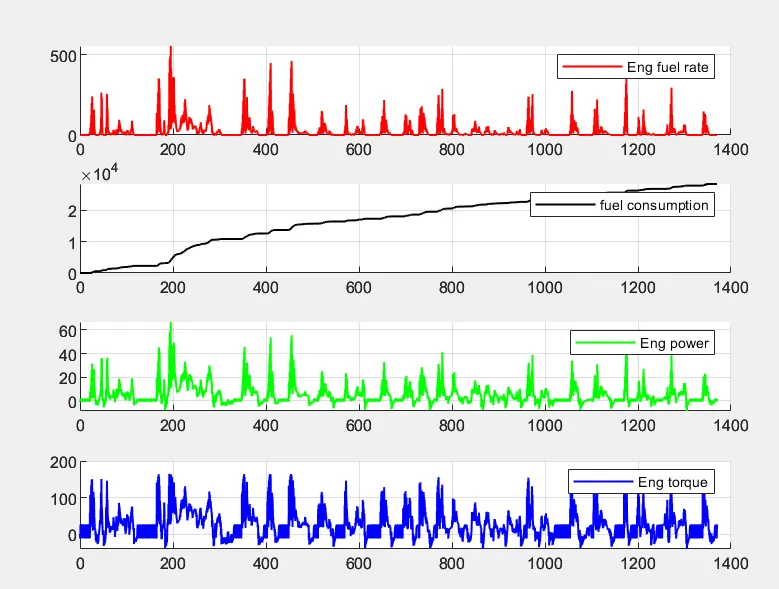
- Plot engine torque, engine power, fuel rate and fuel consumption using subplots.
- Plot accelerator and brake pedal, gear command, vehicle desired and actual speed, vehicle distance using subplots.
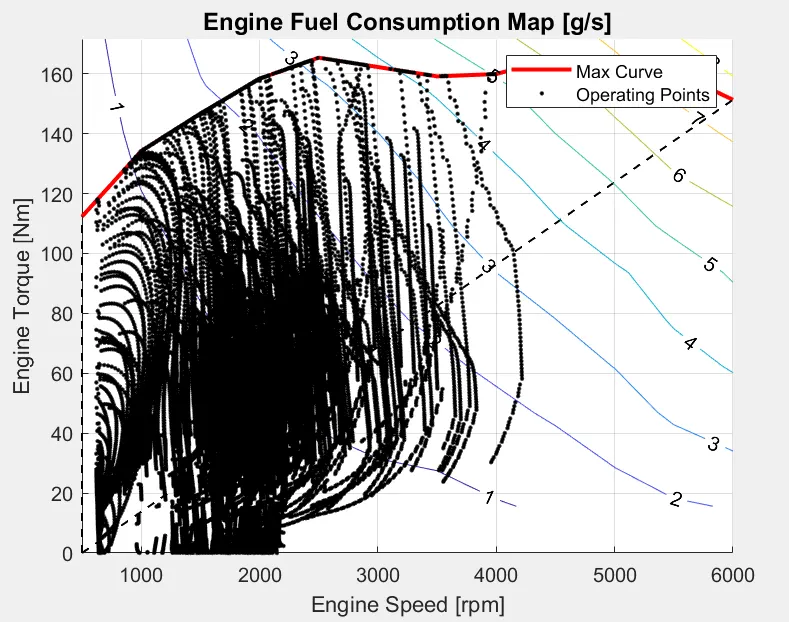
- Plot the engine operating points on the engine fuel map.
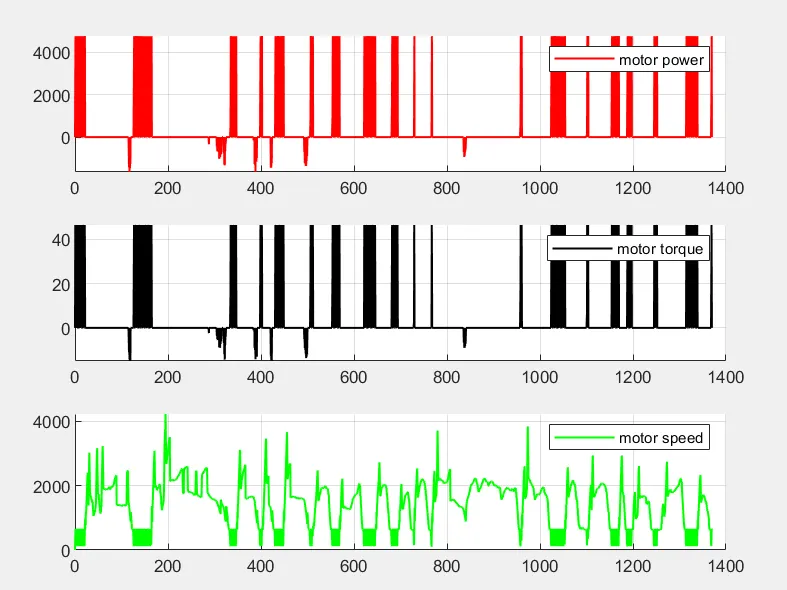
- Plot motor speed, torque, motor input power using subplots.
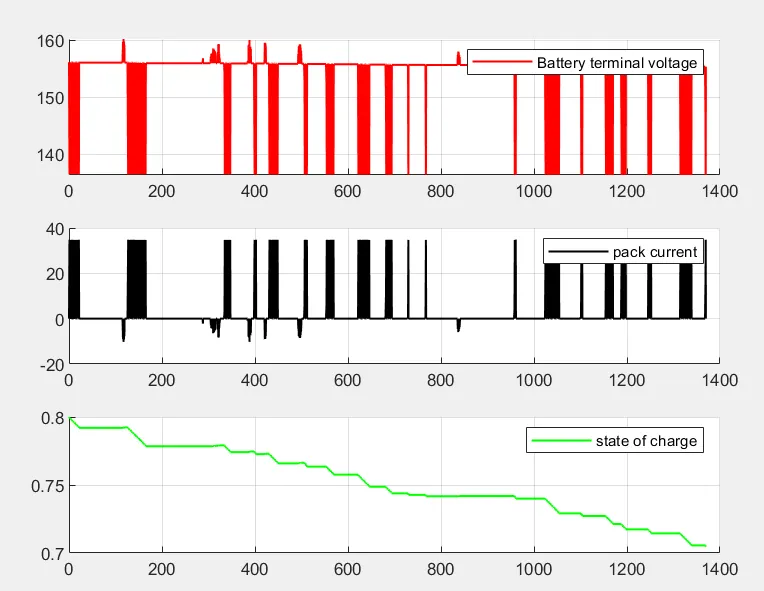
- Plot pack voltage, current and SoC using subplots.
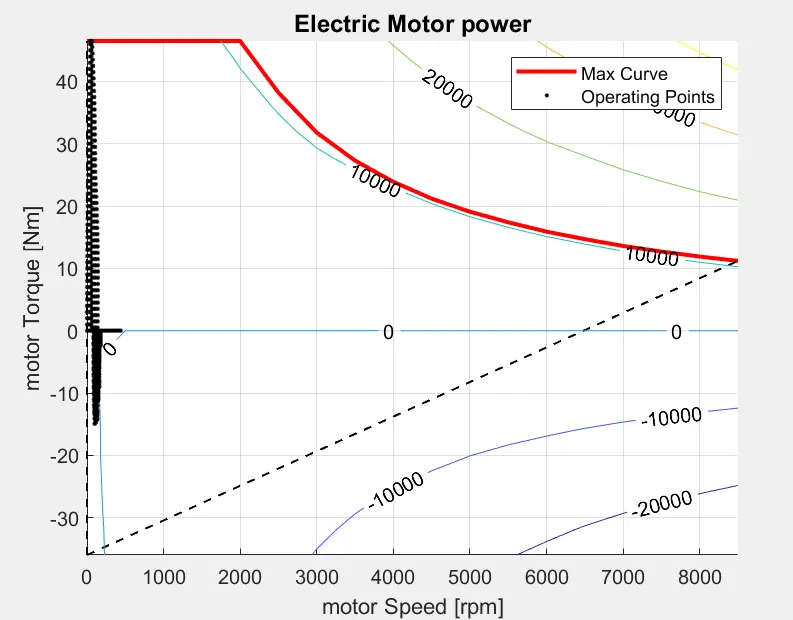
- Plot the motor operating points on the motor input power map, with the motor max motoring and generating torque curves.
2) HWFET drive cycle:
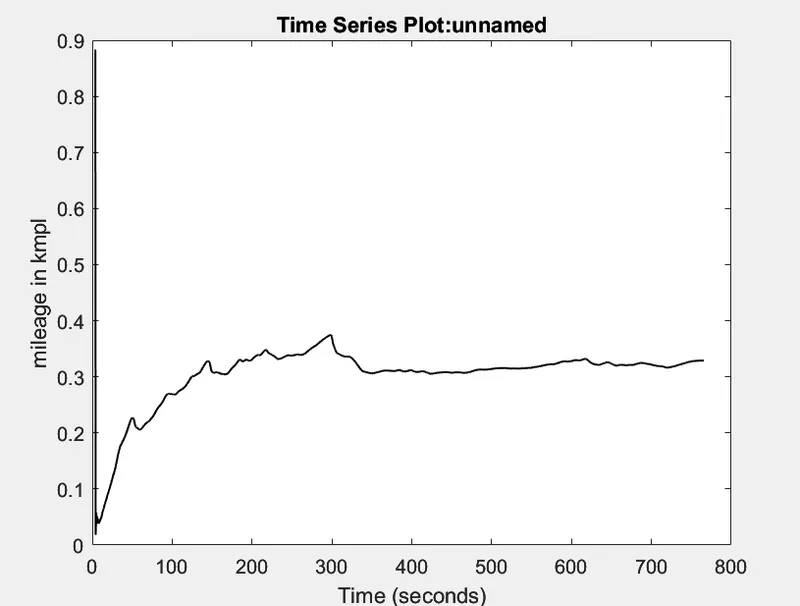
- Fuel economy (kmpl)
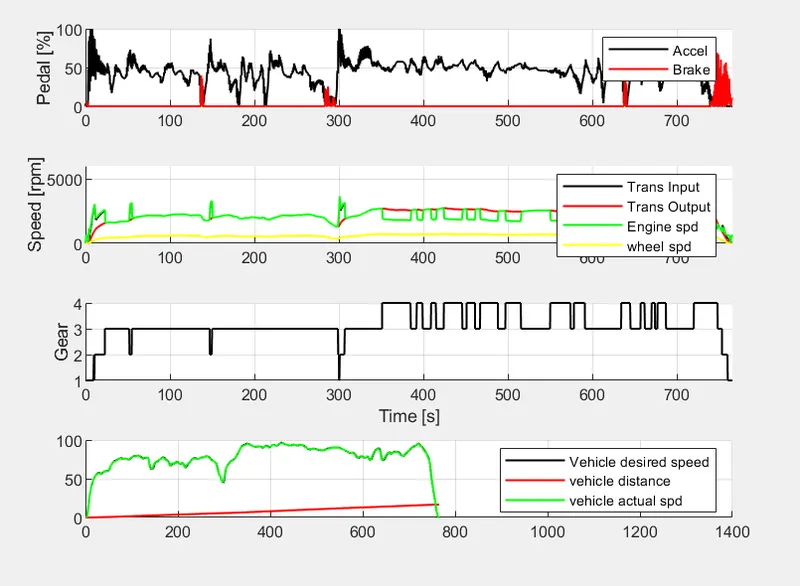
- Plot the time trace for engine, transmission input, transmission output and wheel speed on one plot.
- Plot engine torque, engine power, fuel rate and fuel consumption using subplots.
- Plot accelerator and brake pedal, gear command, vehicle desired and actual speed, vehicle distance using subplots.
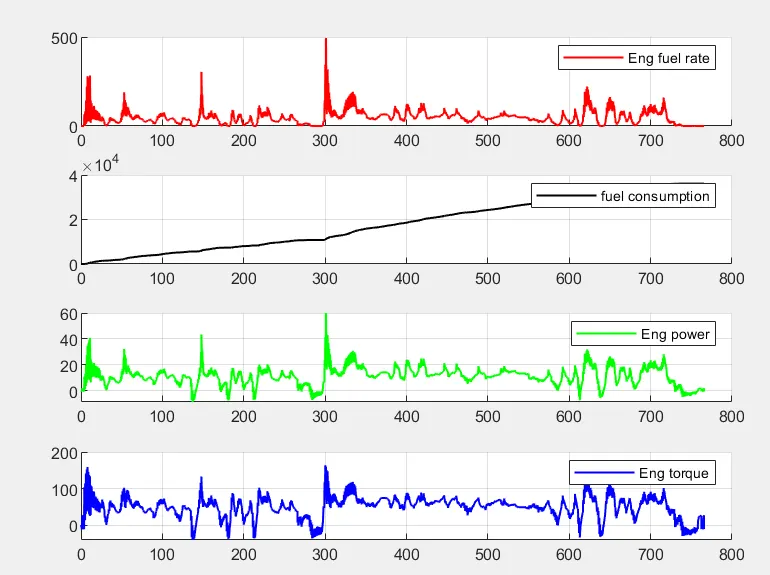
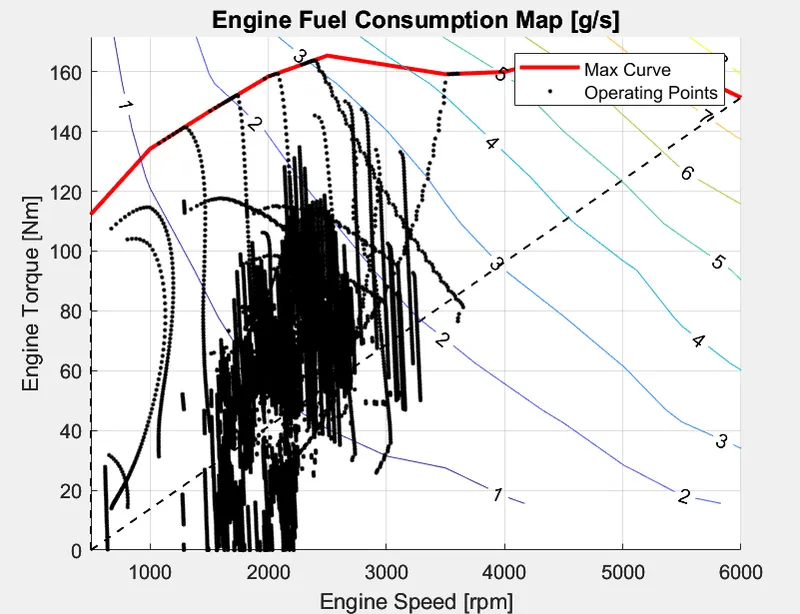
- Plot the engine operating points on the engine fuel map.
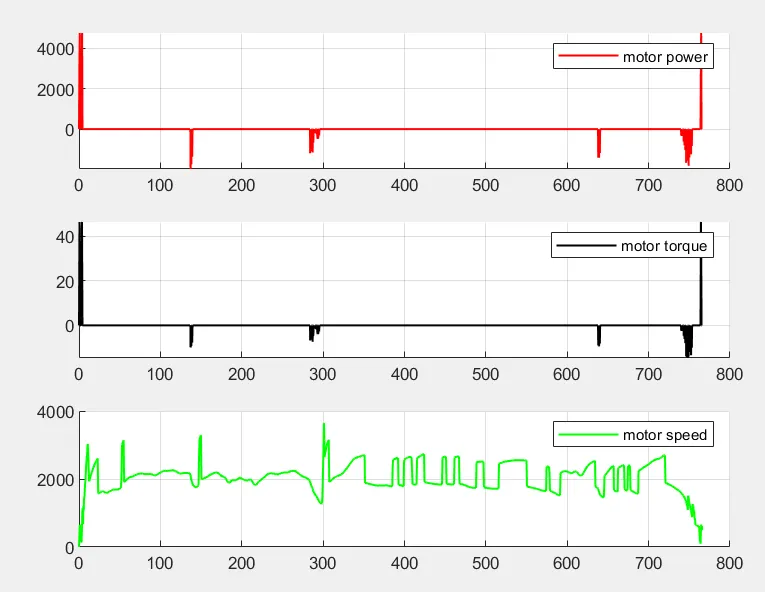
- Plot motor speed, torque, motor input power using subplots.
- Plot pack voltage, current and SoC using subplots.
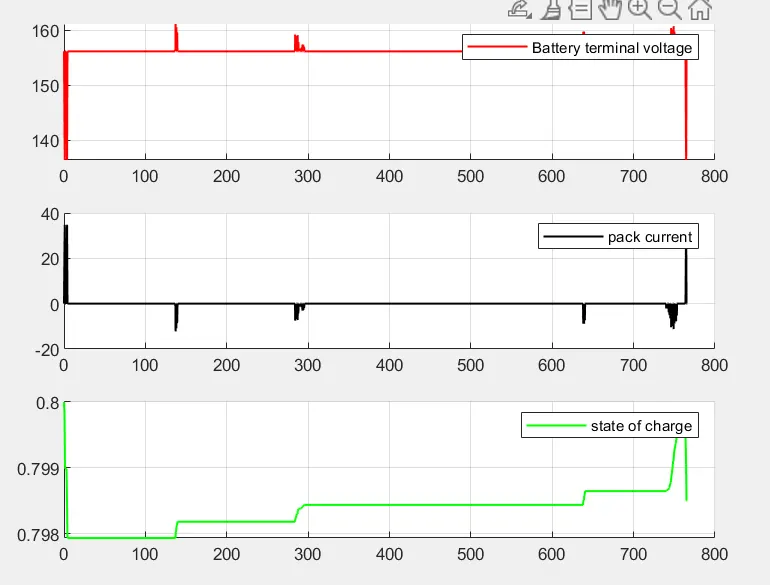
- Plot the motor operating points on the motor input power map, with the motor max motoring and generating torque curves.
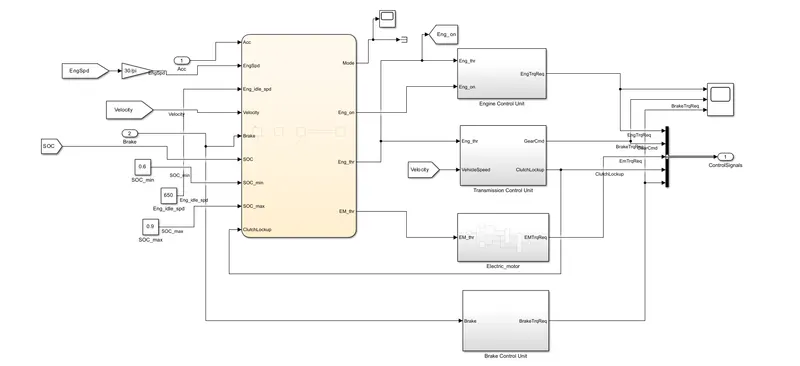
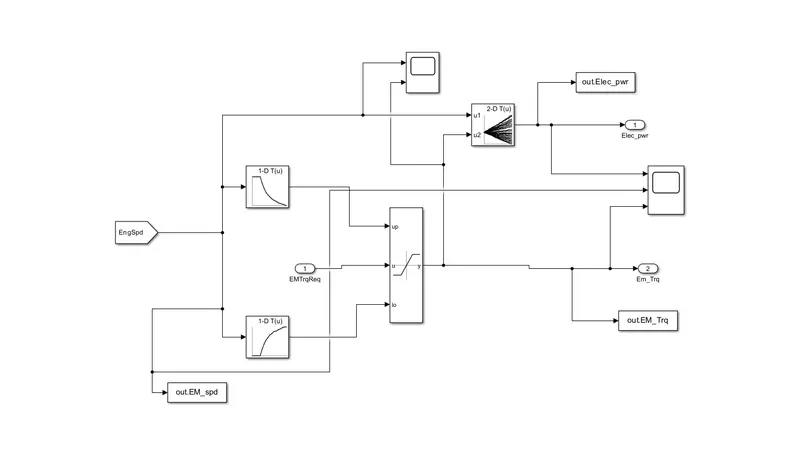
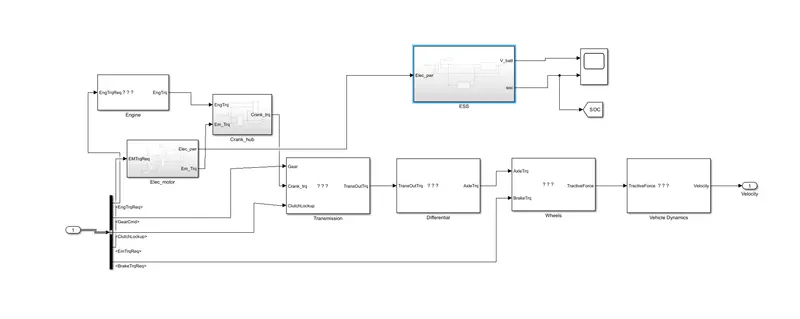
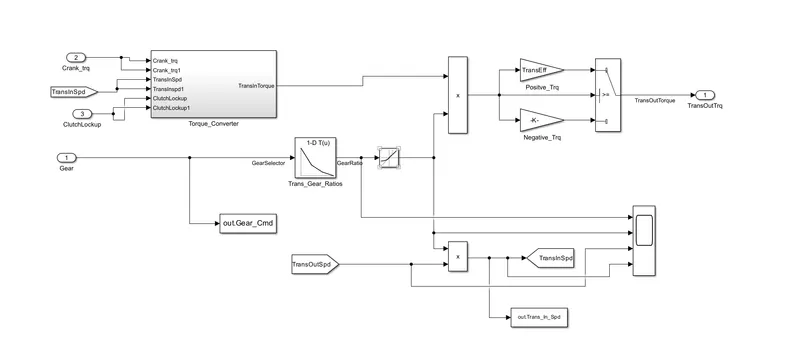
Simulink models:
Comments:
1) from the fuel economy graph it can be concluded that the mileage of the hybrid vehicle shown is less because of the lack of consideration that the vehicle is partly driven by the motor since it is a parallel hybrid arcitecture.
2) comparatively the fuel economy is more for HWFET drive cycle than the UDDS cycle.