Project 2
AIM:
Using MATLAB/Simulink and the drive cycle from the attached excel sheet, find-
- The max heat generation of the battery
- The SOC of the battery at 2 *104second of the battery operation
| Time | Time Step | Battery Current |
| 00:00.4 | 0.1 | -0.9632 |
| 00:00.5 | 0.2 | -0.952 |
| 00:00.6 | 0.3 | -0.9072 |
| 00:00.7 | 0.4 | -0.9632 |
| 00:00.8 | 0.5 | -1.0304 |
| 00:00.9 | 0.6 | -0.9632 |
| 00:01.0 | 0.7 | -1.0304 |
| 00:01.1 | 0.8 | -1.008 |
| 00:01.2 | 0.9 | -0.9856 |
| 00:01.3 | 1 | -0.9632 |
| 00:01.4 | 1.1 | -0.9184 |
| 00:01.5 | 1.2 | -0.9296 |
| 00:01.6 | 1.3 | -0.9296 |
| 00:01.7 | 1.4 | -0.9296 |
| 00:01.8 | 1.5 | -0.9184 |
| 00:01.9 | 1.6 | -0.9408 |
| 00:02.0 | 1.7 | -0.896 |
| 00:02.1 | 1.8 | -0.9072 |
| 00:02.2 | 1.9 | -0.9072 |
| 00:02.3 | 2 | -0.9408 |
| 00:02.4 | 2.1 | -0.9296 |
| 00:02.5 | 2.2 | -0.9296 |
| 00:02.6 | 2.3 | -0.9968 |
| 00:02.7 | 2.4 | -0.9968 |
| 00:02.8 | 2.5 | -0.9408 |
| 00:02.9 | 2.6 | -0.9408 |
Battery resistance = 2 mΩ
Consider the battery resistance is 0.5 mΩ, delta time is 0.1 and entropic factor is 2.
THEORY:
Batteries generate heat during charge and discharge due to enthalpy changes, electrochemical polarization and resistive heating inside the cell. Temperature variation inside the batteries can lead to uneven temperature distribution, creating charge/discharge behaviour within the battery pack. So, thermal runaway may occur in a cell when heat is not adequately controlled and possibly cause fire and explosion. For this reason, the need for battery thermal management is vital for electric and hybrid vehicles to keep the vehicle at its optimum performance.
Now let us see how a battery catches fire.
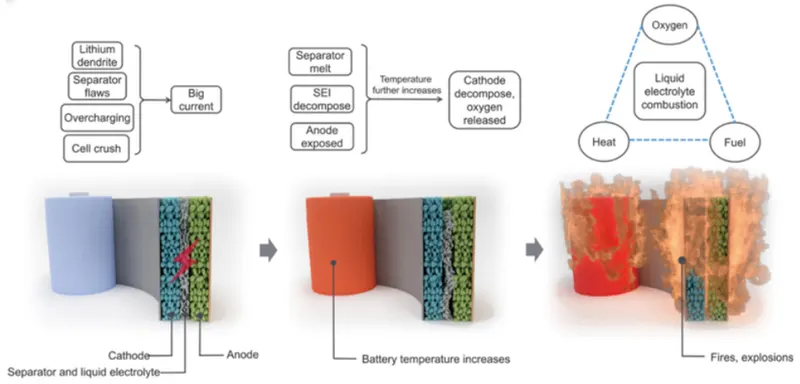
Stage 1: Overheating
The battery pack overheating leads to thermal runaway. Overheating happens in many ways such as charging and discharging the cell, cell temperature, internal resistance, State of Charge, and ambient temperature due to different climatic changes. In this stage, battery system operation changes from normal to an abnormal conditions. This is because of the above-listed issues. So, it moves to Stage 2.
Stage 2: Heat accumulation and gas release process
The Solid Electrolyte Interface (SEI) layer decomposition due to overheating. The temperature rises quickly, and oxygen accumulates inside the battery. So, it moves to Stage 3 for battery combustion.
Stage 3: Combustion and explosion
The oxygen and heat released from Stage 2 lead to combustion. The combustion happens in a flammable electrolyte and leads the battery to fire.
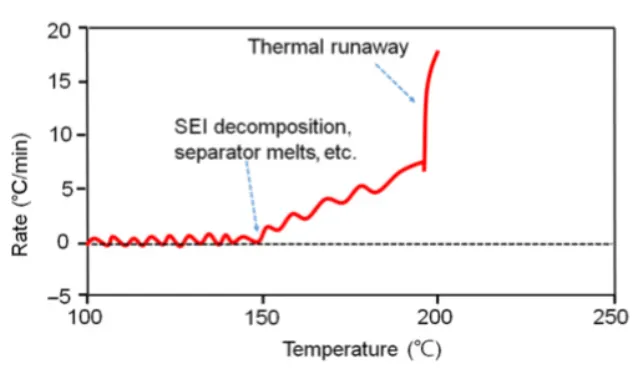
Stage 2 and stage 3 are shown in the graph below, the Accelerated Rate Calorimetry (ARC) curve during the thermal abuse test. In Stage 2, the temperature rises, and an external source of heat rises the battery temperature to the onset temperature. So, the Solid Electrolyte Interface (SEI) layer decomposes, and the separator starts to melt. Then, the self-heating rate will increase and lead to a thermal runaway. The combustion and explosion take place in Stage 3.
Now, let us see heat generation calculations.
Heat Generation Calculation:
There are two heat sources for battery heat generation.
- Joule heat
- Entropy heat
Joule Heat:
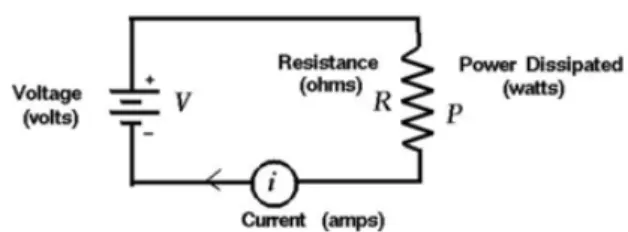
From Ohm's law, V= IR
When a current is flowing through a resistance, there is heat dissipated in the resistor. This heat dissipation is called joule heating. Joule heating is also known as Ohmic heating.
Power:

Heat:

where P = Power
V = Voltage
I = Current
R = Resistance
H = Heat
t = Time
The heat produced in a resistor is
- directly proportional to the square of the current flowing through it.
- directly proportional to the resistance
- directly to the time for which current flows through it.
Entropy heat:
The heat generation due to the entropy change inside a battery occurs when electrochemical reactions are performed. The entropy heat is reversible heat resulting from changes in open circuit voltage with respect to temperature at two electrodes.
Heat generated = Joule heat + Entropy heat
As entropic heat is twice the joule heat, the formula will be as shown below
Average heat generated = Average joule heat + 2(Average joule heat)
Maximum heat generated = Maximum joule heat + 2(Maximum joule heat)
State of Charge (SOC):
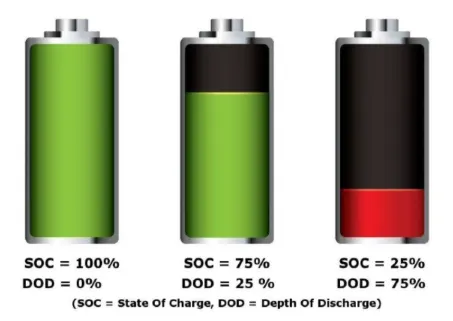
The SOC is the level of charge of an electric battery related to its capacity. The units of SOC are percentage points (0% = empty; 100% = full). It is also defined as the ratio of the remaining capacity to the fully charged capacity.
Depth of Discharge:
A battery's depth of discharge (DoD) indicates the percentage of the battery that has been discharged relative to the overall capacity of the battery. Depth of Discharge is defined as the capacity that is discharged from a fully charged battery, divided by the battery's nominal capacity.
SOC Estimation Methods
Voltage Translation Method:
The battery voltage (open circuit voltage) is used to determine the state of charge of the battery pack. The voltage translation method is used in applications like consumer electronics (battery banks, trimmers, torch light) and small energy storage systems. The LCD and LED are used to determine the SOC. The errors in voltage translation methods are voltage fluctuation, noise in the system and cell chemistry. So, it is not used in electric vehicles.
Coulomb Counting Method:
The SOC is estimated based on in and outflow of current in the battery pack.
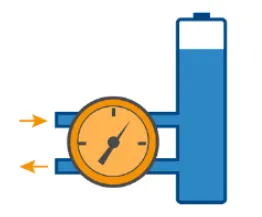
Case 1: Estimating SOC that before charging SOC is 0%. Let's assume that the battery capacity is 100 Ah. if we charge the battery with a 4A current for 4 hours, then the total charge will be 4A x 4h = 16 Ah.
SOC% = Total charge input / max battery capacity x 100
= 16 Ah / 100 Ah = 16% SOC
Case 2: Estimating SOC that the battery already has 50% charge

where,
Z(t) = State of charge
Z(0) = Initial SOC
Cn = Battery nominal capacity
ηi = Coulomb efficiency
i(t) = Instantaneous cell current
t = Time
CALCULATION
R = 0.5 mΩ
| Time | Time Step | Battery Current | Joule Heat |
| 00:00.4 | 0.1 | -0.9632 | 4.64e-5 |
| 00:00.5 | 0.2 | -0.952 | 9.06e-5 |
| 00:00.6 | 0.3 | -0.9072 | 1.24e-4 |
| 00:00.7 | 0.4 | -0.9632 | 1.86e-4 |
| 00:00.8 | 0.5 | -1.0304 | 2.65e-4 |
| 00:00.9 | 0.6 | -0.9632 | 2.78e-4 |
| 00:01.0 | 0.7 | -1.3040 | 5.95e-4 |
| 00:01.1 | 0.8 | -1.008 | 4.06e-4 |
| 00:01.2 | 0.9 | -0.9856 | 4.17e-4 |
| 00:01.3 | 1 | -0.9632 | 4.64e-4 |
| 00:01.4 | 1.1 | -0.9184 | 4.64e-4 |
| 00:01.5 | 1.2 | -0.9296 | 5.18e-4 |
| 00:01.6 | 1.3 | -0.9296 | 5.62e-4 |
| 00:01.7 | 1.4 | -0.9296 | 6.05e-4 |
| 00:01.8 | 1.5 | -0.9184 | 6.33e-4 |
| 00:01.9 | 1.6 | -0.9408 | 2.83e-4 |
| 00:02.0 | 1.7 | -0.896 | 6.82e-4 |
| 00:02.1 | 1.8 | -0.9072 | 7.41e-4 |
| 00:02.2 | 1.9 | -0.9072 | 7.82e-4 |
| 00:02.3 | 2 | -0.9408 | 8.85e-4 |
| 00:02.4 | 2.1 | -0.9296 | 9.07e-4 |
| 00:02.5 | 2.2 | -0.9296 | 9.51e-4 |
| 00:02.6 | 2.3 | -0.9968 | 1.14e-3 |
| 00:02.7 | 2.4 | -0.9968 | 1.19e-3 |
| 00:02.8 | 2.5 | -0.9408 | 1.1e-3 |
| 00:02.9 | 2.6 | -0.9408 | 1.15e-3 |
Average joule heat = 7.7325 mJ
Average heat generated = average joule heat + average entropic heat
Assuming entropic heat is twice as the joules heat
Average heat generated = 7.7325e-3 + 2(7.7325e-3)
= 0.0231975 J
Maximum joule heat = 1.19 mJ
Maximum heat generated = maximum joule heat + maximum entropic heat
= maximum joule heat + 2(maximum joule heat)
Maximum heat generated = 1.19e-3 + 2(1.19e-3)
= 3.57 mJ
SIMULINK MODEL
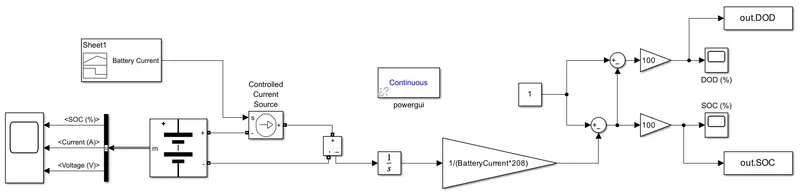
The Simulink model is designed and run for 208 seconds.
OUTPUT
The figure below shows the state of charge estimation graph. From the result, the battery is discharging from 100% to 28%.
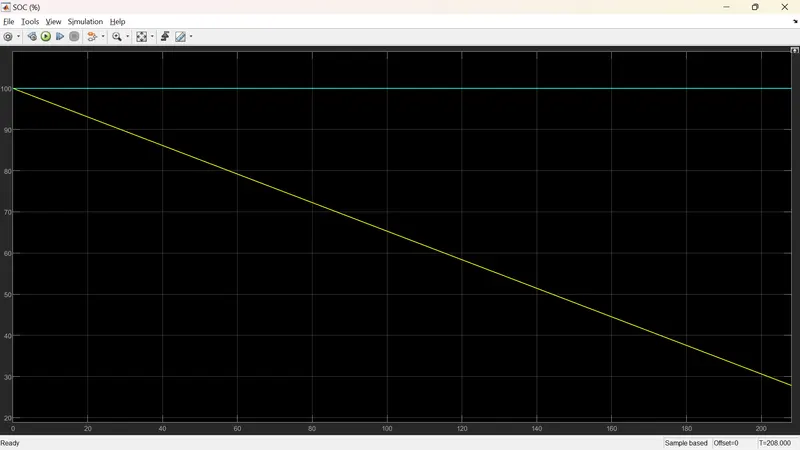
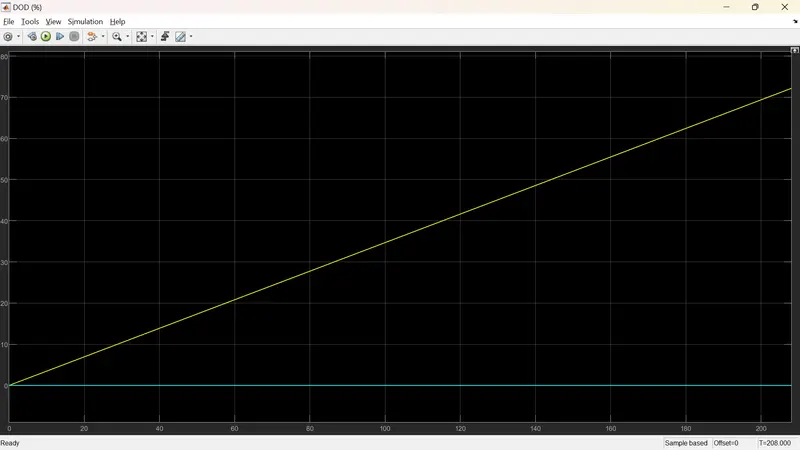
The figure below shows the depth of discharge graph. From the result, the depth of discharge is 72%.
DOD% = 100 - SOC% = 100 - 28 = 72%.
CONCLUSION
The Simulink model is designed and runs for 208 seconds.
- The max heat generated in which the current flows in and out i.e., charge and discharge due to internal resistance and chemical reaction during charging and discharging of the battery is 3.57 mJ.
- The SOC of the battery at 208 seconds of battery operation is 28%.