Project 2
AIM: To design a vehicle model consisting of a driver, an electric powertrain and a vehicle system and to run the simulations, change the threshold, create plots and measure current & hydrogen consumption.
SIMULINK MODEL
To develop a basic simulation model for the vehicle, the things needed can be divided into 3 categories:
- The driver input - this defines the desired velocity.
- The controller - how the system should react to the input is all defined in the controller.
- The plant model - this is the mathematical representation of the system to be controlled.
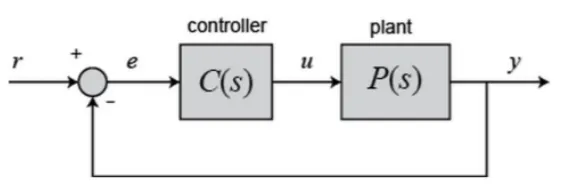
PID Controller
A system needs some mechanism of correction when the system deviates from the desired output. This correction comes by knowing the difference between the desired and current output known as an error. Once an error is calculated, a controller logic works to minimize the error. One such controller is PID.
1. Proportional Controller
In a proportional controller, the correction factor is multiplied by the error. This factor multiplied is called the proportional gain. This works well only for linear systems. The error signal is calculated by Setpoint - Output.
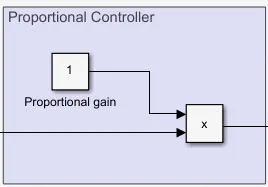

where Cout = Controller Output
Kp = Proportional gain
e(t) = Error
C0 = Controller output when the error is zero
2. Integral Controller
The integral controller fixes any residual error in the system output. If the error is getting accumulated, then a simple P-controller won't be enough.
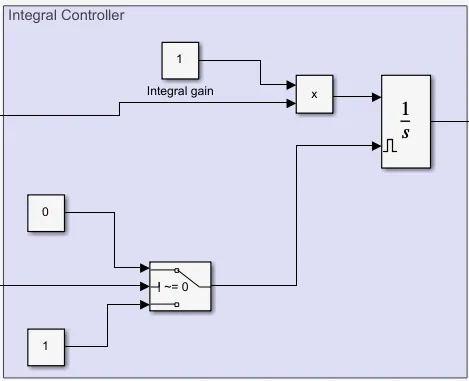
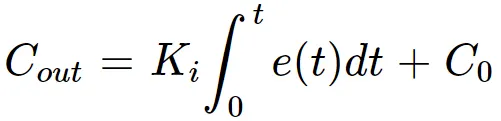
where Ki = Integral gain, a parameter that must be tuned. The integration of error over time gives the accumulated error.
3. Derivative Controller
The derivative controller works to detect the rate of change of error. This helps point out if the error is going to increase rapidly shortly. The derivative of error over time gives the rate of change of error.
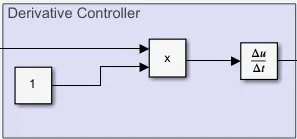
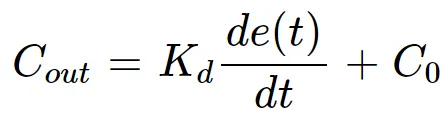
If the derivative is zero, the error change rate is constant. But for a non-zero derivative, it points out rapid changes.
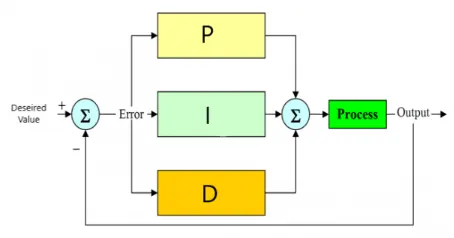
The three different controllers are put together to give the PID Controller. This can be used in different combinations of PI, PD or PID Controller.

I. Driver Block
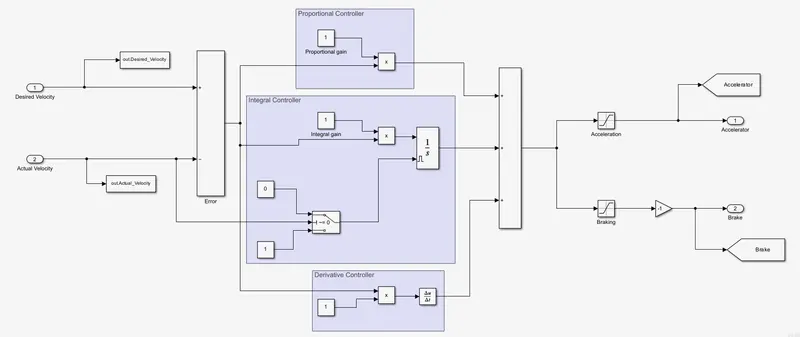
The driver block takes the input from the MATLAB Workspace. The drive cycles are loaded from an initialization file. These drive cycles are predefined driver cycles and are supplied by legislative agencies of the respective countries. These drive cycles are tables with velocities over an interval of time. These are typical drive cycles used for vehicle and fuel emission testing. Once the drive cycle is loaded in the workspace of MATLAB, a matrix with the desired velocity over a period is created. The driver block then converts this velocity profile into accelerator and brake commands.
Integral Windup
Many systems have a limit to how the actuator behaves and so the maximum output of actuators is saturated. This can cause the error to increase with time.
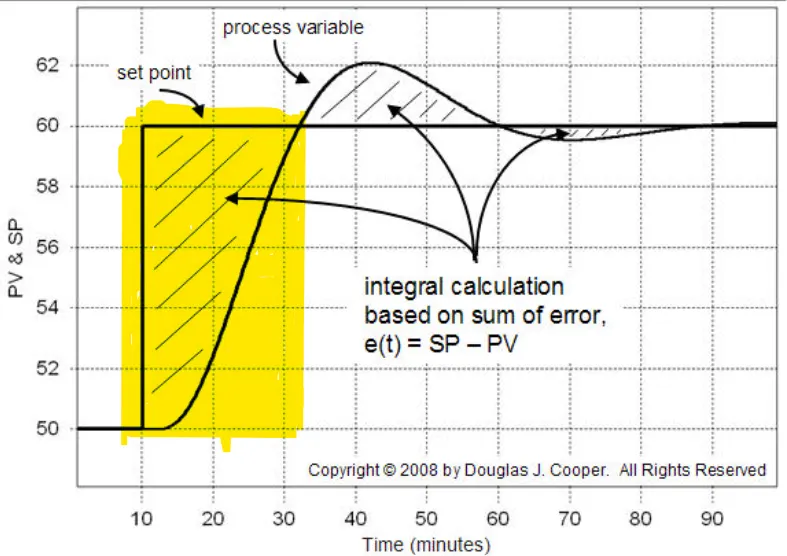
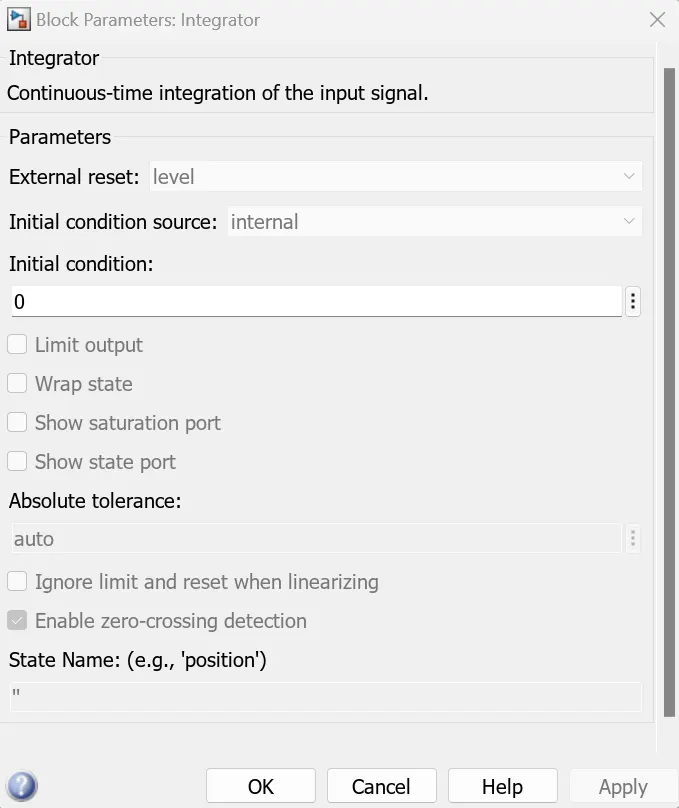
The box highlights the build-up of errors with time. The correction from the integral term of the PID Controller increases a lot. This causes the system to output to go beyond the setpoint known as overshoot. A reset or anti-windup mechanism needs to be put in place to avoid the correction from integral terms becoming too high. In our case, we will be using an external reset when a specific condition is met. The integral block in Simulink has a provision for this.
II. Vehicle Model
The vehicle when moving on the road has various forces acting on it. When longitudinal forces and lateral forces are considered in a model, it becomes a 2D model. The lateral forces are not considered for this model thus making it a 2D model.
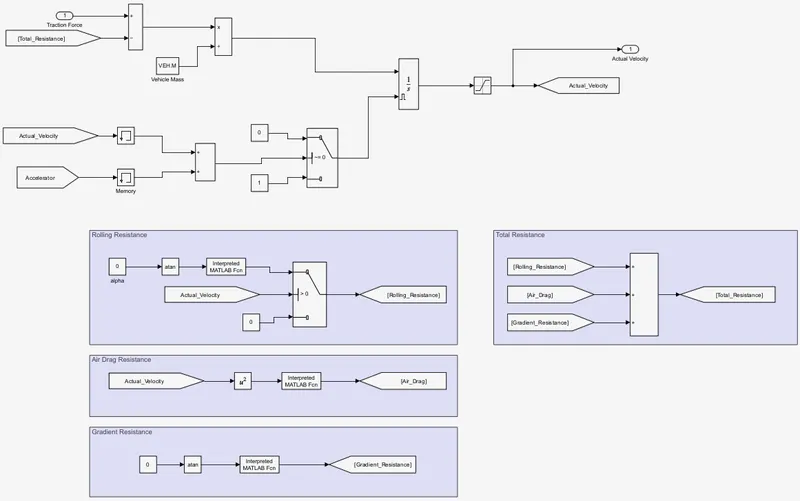
The electric powertrain block does all the signal processing and generates a tractive/propulsion force. This is then fed into the vehicle model block. The tractive force propels the vehicle forward overcoming the resistance it faces.
1. Rolling Resistance:
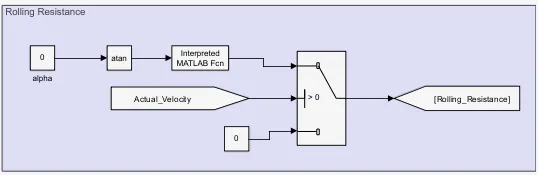
The rolling resistance is the friction or the force resisting the motion of a circular object that's rolling on a surface. For a modern radial tire, there is a deflection in the part of the tire which is in contact with the road surface. This causes the normal force to shift. The normal force is higher in the front part of the tire in contact with the ground due to this shift. This shift in the normal force causes a moment about the centre of rotation which acts in the opposite direction.
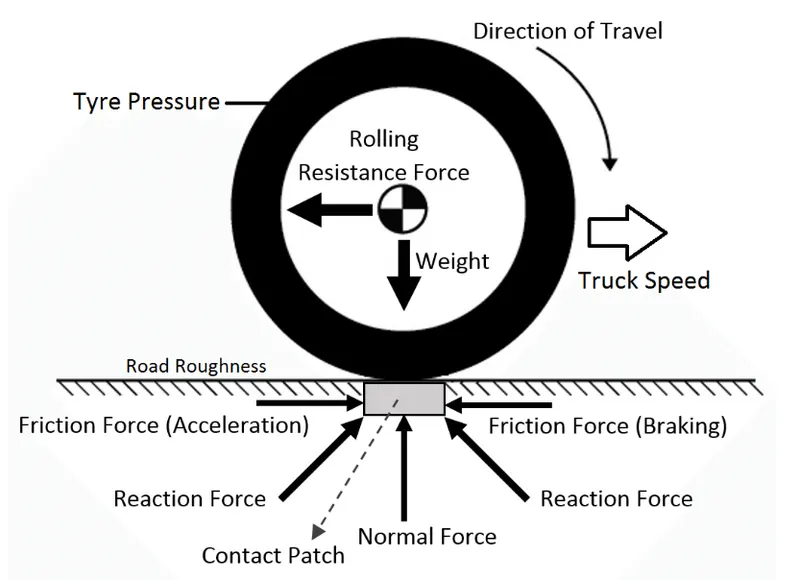
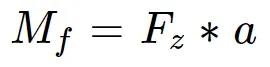
The distance of the shift in the normal force is "a" and "Fz" denotes the normal force. Based on this, the opposing moment comes out as
To overcome this resistance, the force needed to be applied to the centre of the wheel comes out to be:
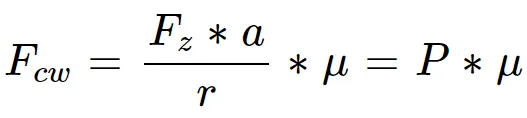
In the equation, "r" is the effective rolling radius of the tire and μ is the rolling resistance coefficient. The above force is only when the vehicle is on a straight road. When going on a slope, a cosine component of the force is needed to propel the vehicle forward for a vehicle on a road with a slope α turns out to be

For a vehicle running on dry asphalt, an approximate assumption for the value of the coefficient friction was made to be 0.015. P is the normal force, and the acceleration causing that force is gravity at 9.81 m/s^2. So, the equation above can be rewritten with M being the mass of the vehicle as

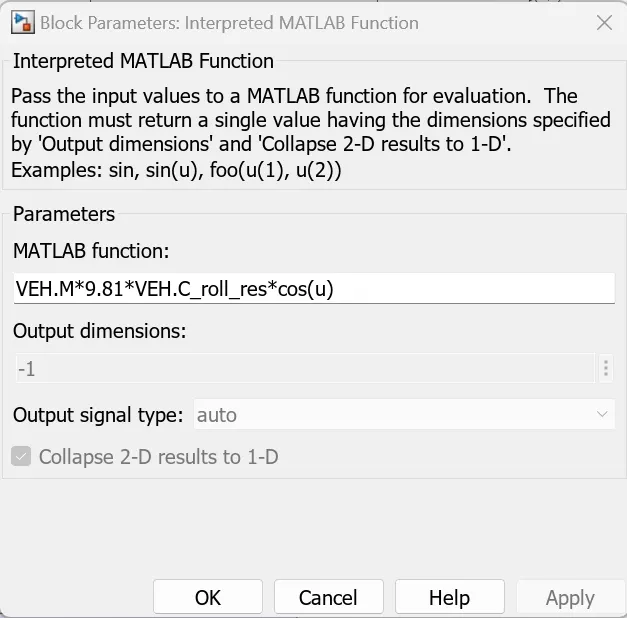
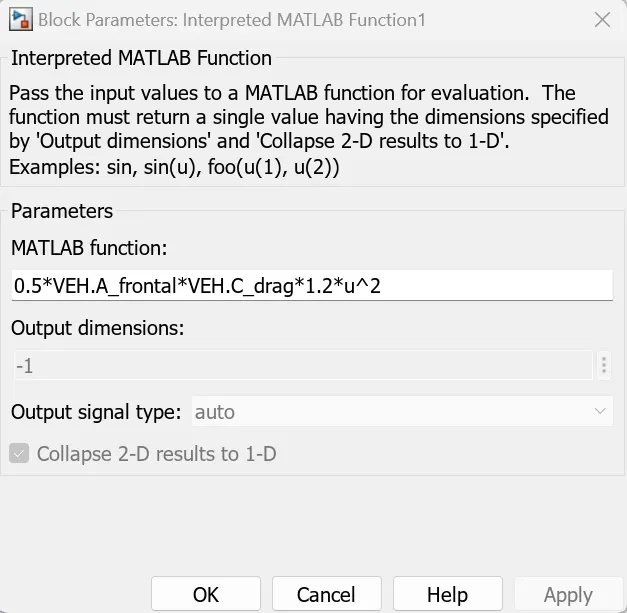
2. Aerodynamic Drag

The resistance is directly proportional to the speed of the vehicle. Along with the vehicle's velocity, the amount of aerodynamic drag a vehicle faces also depends on the front shape of the vehicle or the frontal area. The vehicle when moving forward leaves behind an area of low air pressure. As per the rule of physics, air flows from a high-pressure area to a low-pressure area thus increasing the aerodynamic resistance.
Considering all the factors, the equation for the aerodynamic drag can be defined as:
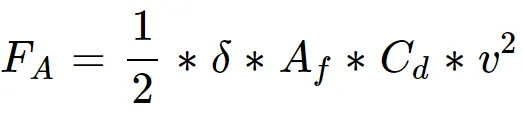
where δ = Density of the surrounding air
Af = Vehicle Frontal Area
Cd = Drag coefficient
v = Velocity of the vehicle
3. Grade Resistance:

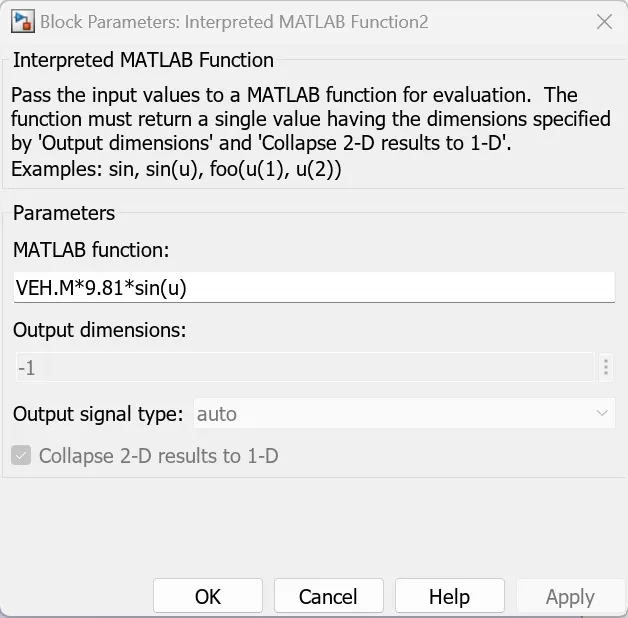
When a car is going uphill, it experiences an additional resistance component which is due to the grade of the road and it's called grade resistance. But when going downhill, it helps in the motion of the vehicle. The amount of grade resistance or assistance depends on the mass of the vehicle denoted as M and is defined as:

III. Electric Powertrain Model
1. Battery Model:
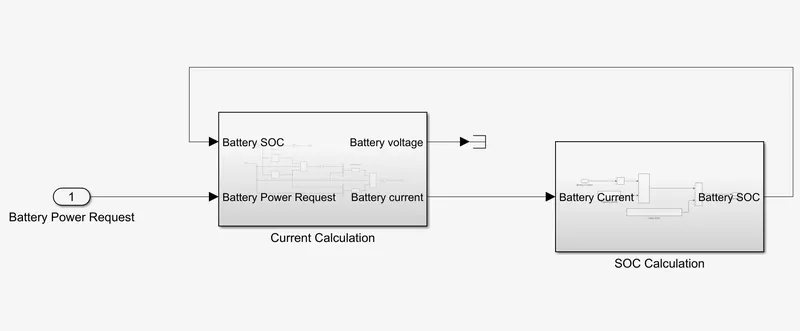
As a general convention, positive power is considered a discharge and negative power is considered a charge. When the current is positive, SOC goes down and when it's negative SOC goes up. The charge and discharge capacity of a battery depends on its SOC, temperature, voltage etc. So a SOC vs Resistance map is used to determine the resistance and calculate the current.
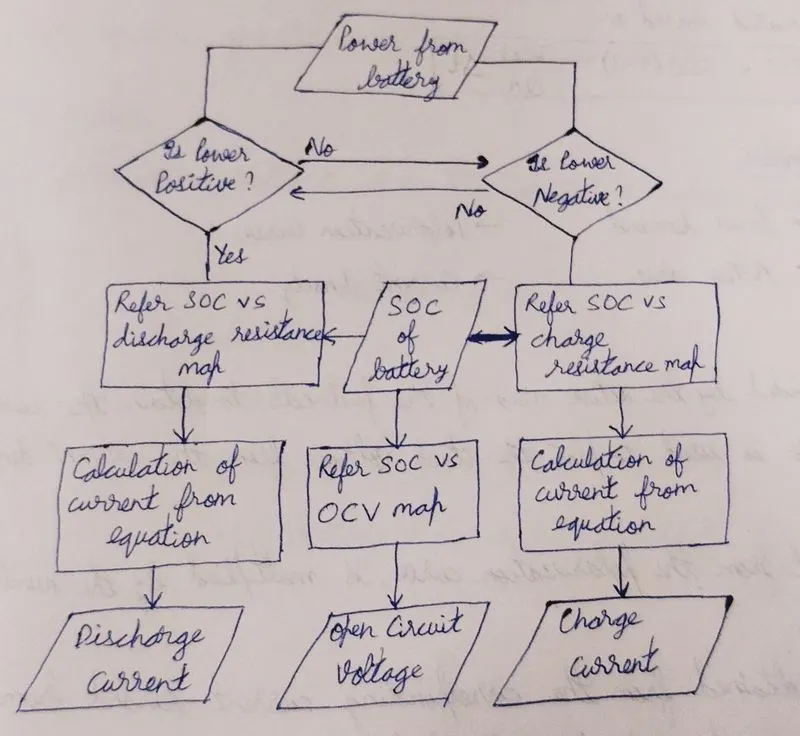
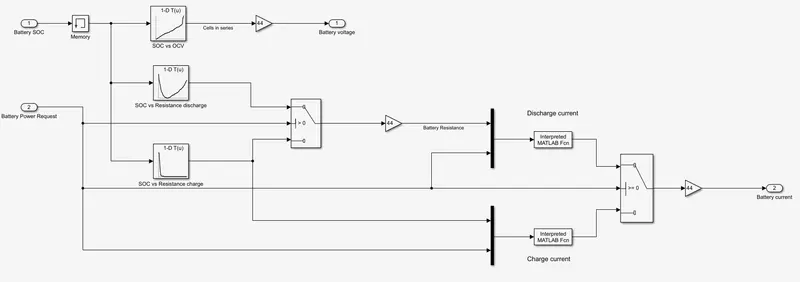
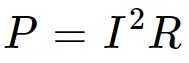
Based on the basic electrical equations, we get power as a function of Resistance and Current as
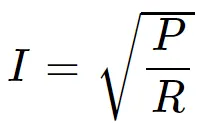
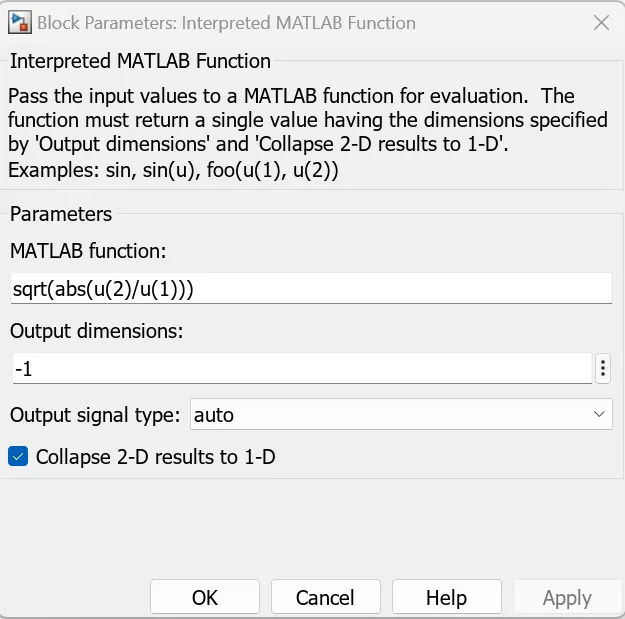
To get the current, we just square-root of the ratio of P & R as
SOC estimated - Coulomb Counting
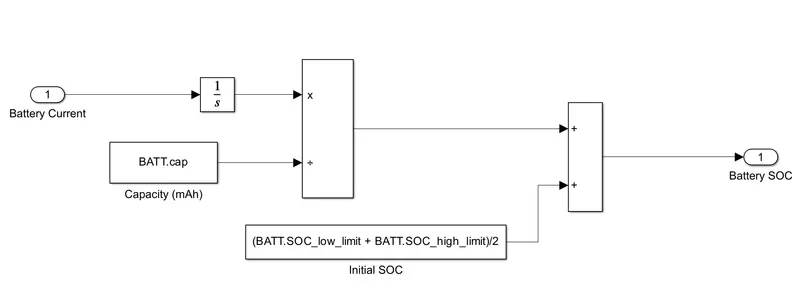
Coulomb counting is essentially counting the current going in and out of the battery. When current is drawn from the battery, this is subtracted from the capacity. When charging, the current goes into the battery adding to the capacity. It depends on the accuracy of current sensors and assumes no current is lost as heat etc. The current is determined through the basic equations. An integral of current over time gives the Ah. The battery's total capacity is known for specifications. The SOC is then estimated based on

2. Fuel Cell Model
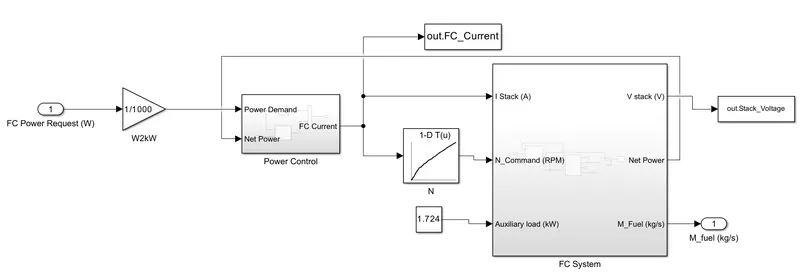
The stack current is divided by the active area of the fuel cell to obtain the current density. A cell polarization curve is used to plot the stack voltage from the current density and the cathode pressure. The cell voltage obtained from the polarization curve is multiplied by the number of cells to obtain the stack voltage. The cathode pressure is obtained from the corresponding current demand from the fuel cell.
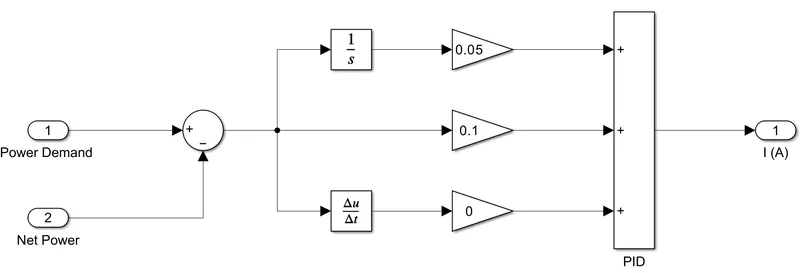
EMS decides the power demand from the fuel cell. The fuel cell has a feedback loop that minimizes the difference between the demand power and the actual power. The power demand is fed into a Power vs Current map which then gives what the current output should be.
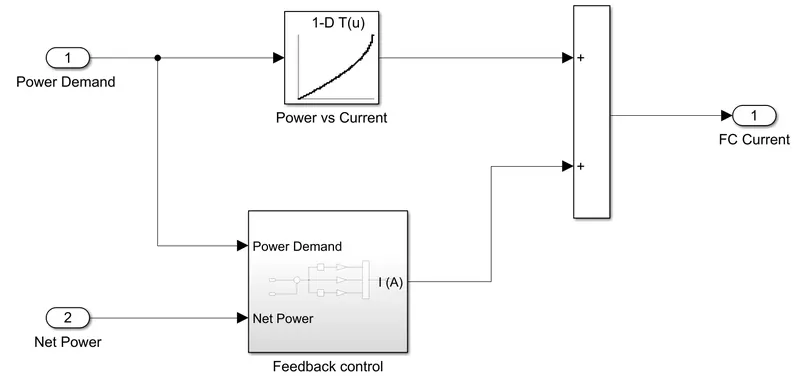
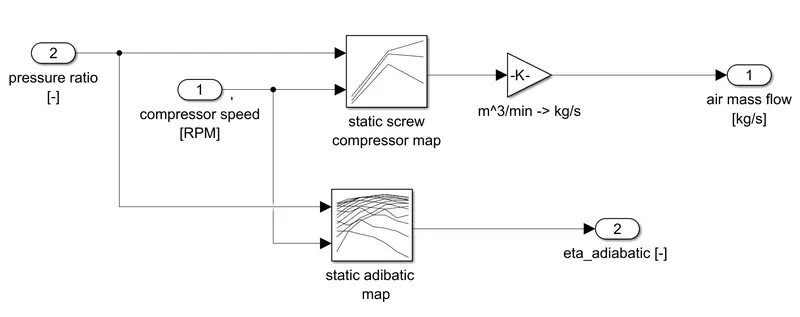
The current demand determines the rate of reaction which needs a certain quantity of air. So the compressor runs on a current vs RPM map to provide the necessary oxygen.
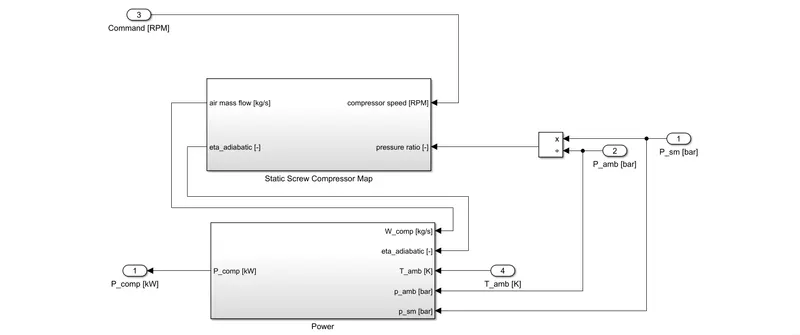
Static Screw Compressor Map
Power
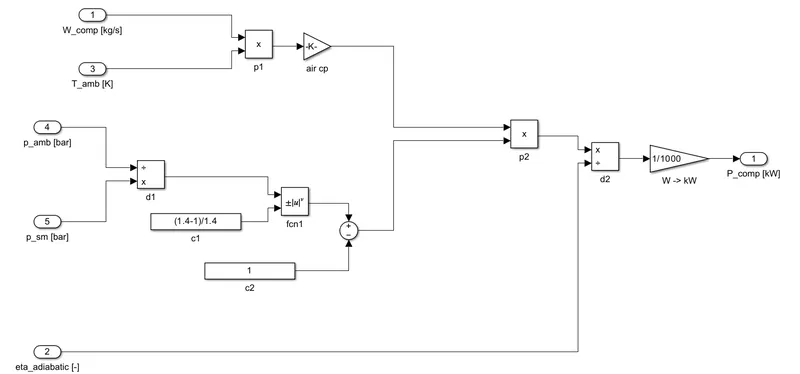
A map for stack current vs optimal pressure determines the target for the compressor. The power demand of the compressor is a parasitic load on the system. The auxiliary loads for 12V components are also parasitic. So all the power demands are subtracted to give the net power.
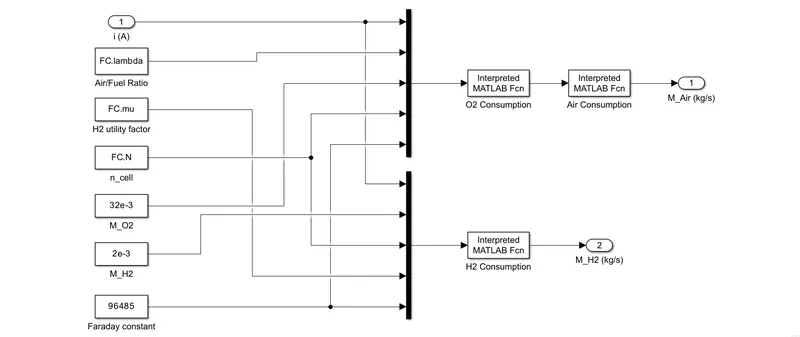
The two most important gases in the fuel cells are O2 and H2.

The above equation quantifies oxygen consumption.

The above equation quantifies hydrogen consumption.
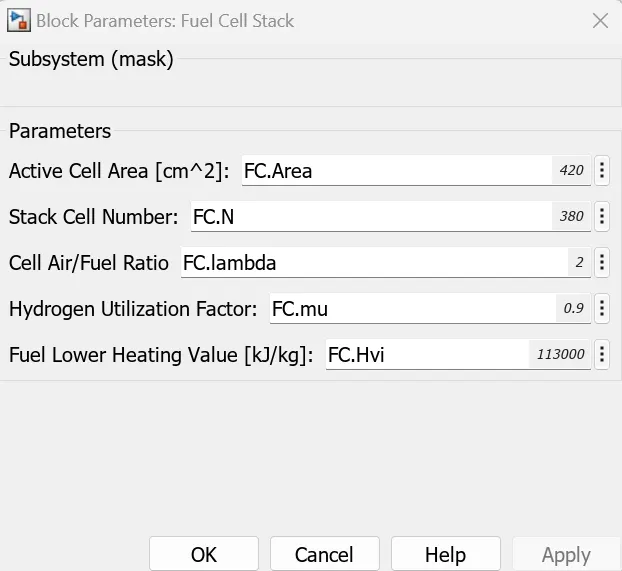
Fuel Cell Parameters
Some of the parameters needed to model the fuel cell are shown in the figure below:
3. Ultracapacitor Model
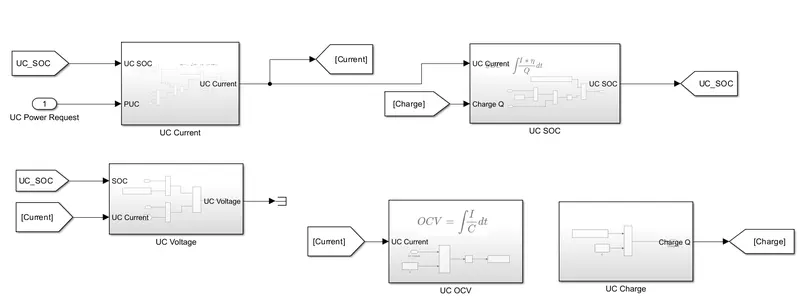
In the UC Model, we will be looking at the equations that define SOC, Current and Open Circuit Voltage. These quantities are important to define the status of the UC while being used for driving. Using the basic working principle of UC, we will look at things that influence the OCV, SOC and capacitance. A simple OCV measurement effectively defines the State of Charge. The amount of charge is proportional to the current that can flow through the circuit. So OCV is sufficient to determine the basic status of the UC.
The State of Charge (SOC) equation is modelled as
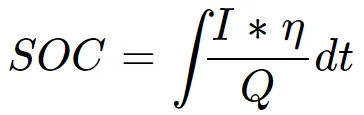
where η = Coulomb efficiency
I = Current
Q = Electric quantity
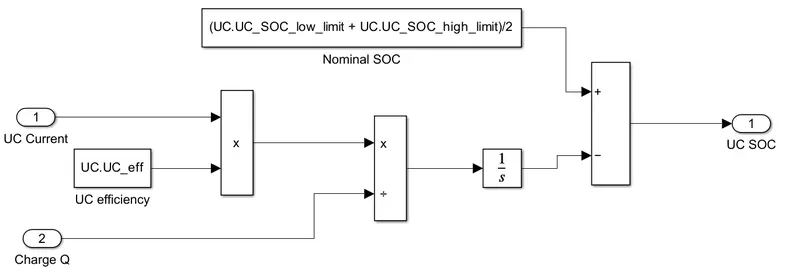
The current flowing through the circuit when integrated gives the charge flown through the circuit. Taking a ratio of it over the total charge capacity gives SOC. Q depends on the capacitance which is the charge storage capacity measured in Farads.
The OCV is a measure of the electric field between plates. The capacitance & OCV give Q.

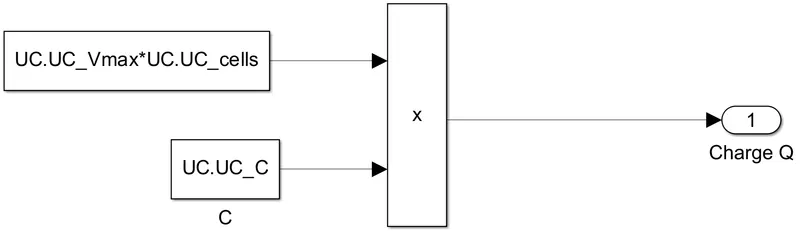
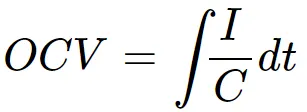
The integration of current over C gives OCV.
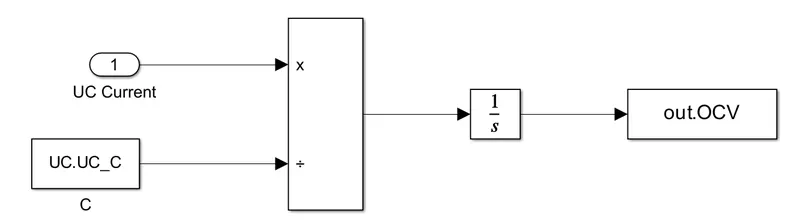
In the UC model, calculations for current and SOC are done. Firstly the current consumed is calculated which is fed into a SOC calculation block.

where R = lumped resistance
Vmax = Maximum voltage
η = Efficiency during the charge-discharge cycle
4. Energy Management Strategy
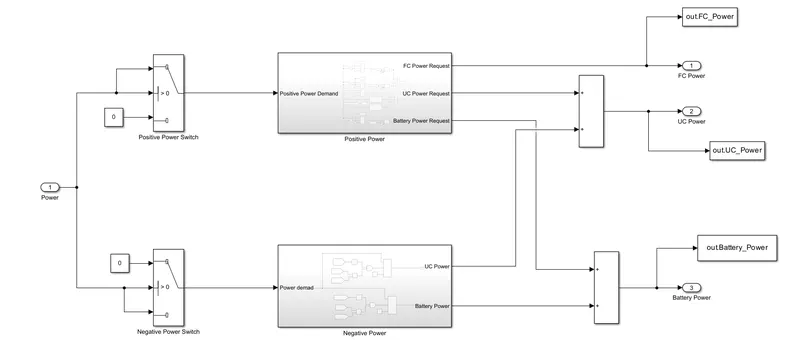
In the Electric Powertrain Model, three power source components were added. Fuel cell stack, battery and UC are all capable of proving power. So the EMS is like a supervisor that decides which component should provide the power. It is also responsible to maintain the SOC of the components to its nominal SOC level. The EMS needs to consider the operating limit of the components. The aim of the EMS must be to optimize performance and minimize fuel consumption. So it must also know the most efficient operating points apart from the limits. An industrial-level EMS should also have some fault reactions if faults occur. To create an efficient distribution of power demand to energy sources on board, an understanding of components is important. The EMS should ensure to work for maximizing the life of the battery. The fuel cell should be operated to reduce hydrogen consumption and provide sufficient power. The UC being very robust must be efficiently used in areas where other components lack.
Battery
The parameters that affect the battery life related to EMS are its charge/discharge cycles with some loss when static. The C rate of the battery is also important when it comes to battery life. The C rate also affects the temperature which contributes towards degradation. The degradation occurs in the form of the loss of lithium. The C rate is a measure of the rate at which the battery is being discharged or charged. For eg. A 50 Ah battery providing 50 A for 1 hr. is 1C. A 50 Ah battery providing 100 A for 0.5 hr. is 2C. If the C rate is low, the current drawn per second is low. This will result in a lower power operating window.
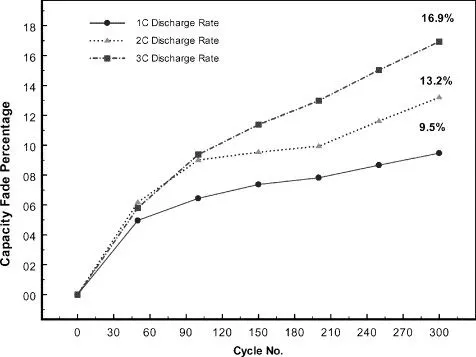
When the battery is charged daily, it loses relative capacity. The battery when operated between 20% - 60%, the loss is the least. Some capacity is lost when the battery is not in use.
Fuel Cell
The important parameter to keep in mind in terms of EMS for the fuel cells is the losses. The system efficiency map is an important parameter. The three kinds of losses below the output and fuel efficiency of the fuel cell.
- Activation loss
- Ohmic loss
- Mass concentration loss
Calculation
- The active area of the fuel cell = 420 cm^2
- The ohmic loss region starts at the current density = 0.24 A/cm^2
- It ends at 0.76 A/cm^2 before the mass transport loss region.
- Each cell gives about 0.6 V and 380 cells are in series generating 380 * 0.6 = 228 V.
- The lower limit of current would be 420 * 0.24 = 100.8 A.
- The upper limit of current would be 420 * 0.76 = 319 A.
- Power = Voltage * Current
- Lower power limit = 228 * 100.8 = 22.9 kW.
- Upper power limit = 228 * 319 = 72.7 kW.
- This gives us the operational window for the fuel cells.
System efficiency
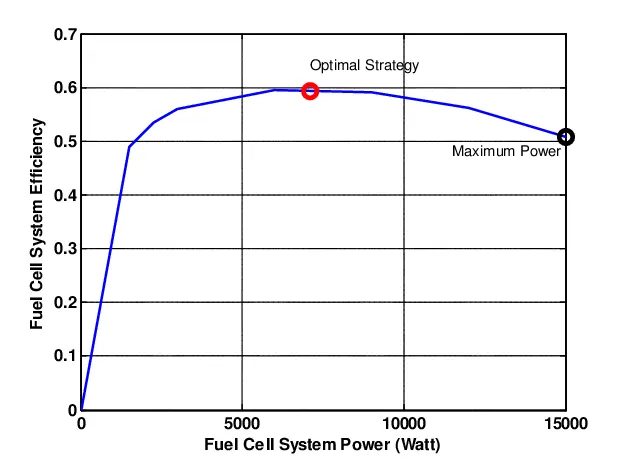
At low load, FCS efficiency is very low due to the operation of the air compressor, cooling system and humidifier. The FCS efficiency is high at medium load. At high load, efficiency is again low cell efficiency decreases as fuel cell current increases.
Ultracapacitor
Certain parameters should be considered for selecting the UC that would be part of the ESS. Maximum Charged Voltage should be decided based on bus voltage and DC-DC used. The minimum voltage should be decided based on the bus voltage and DC-DC. The Power or Current required to be delivered by the UC to attain the vehicle characteristics. The voltage of a UC increases linearly when charged and currently drops. However, exceeding the voltage of UC beyond a limit can damage the UC.
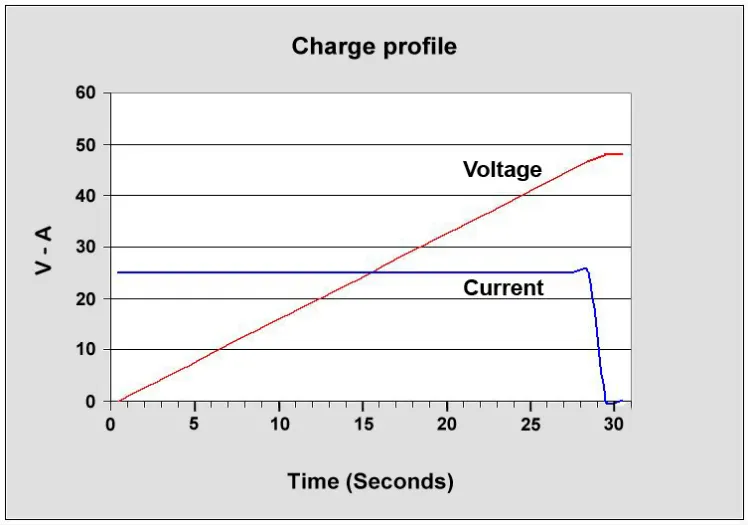
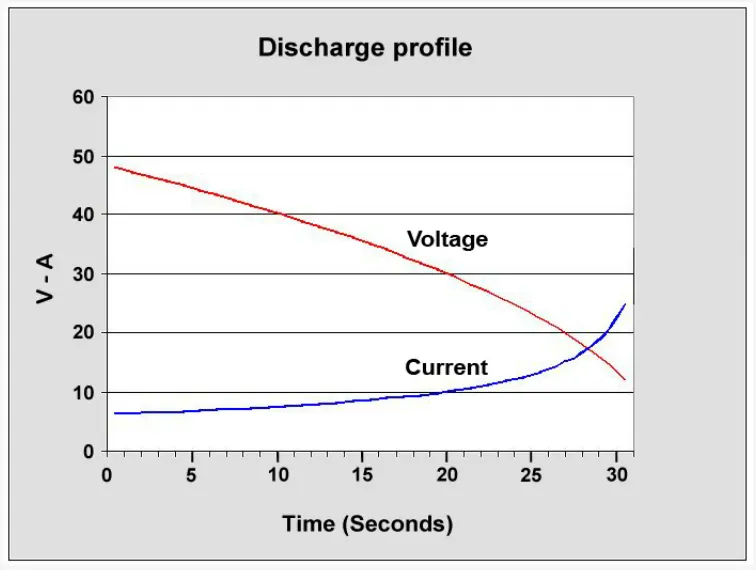
When discharging the voltage can drop quickly. If it gets too low, the DC-DC might not be able to boost it to the bus voltage level. The minimum voltage of UC should be kept in mind when a current is drawn.
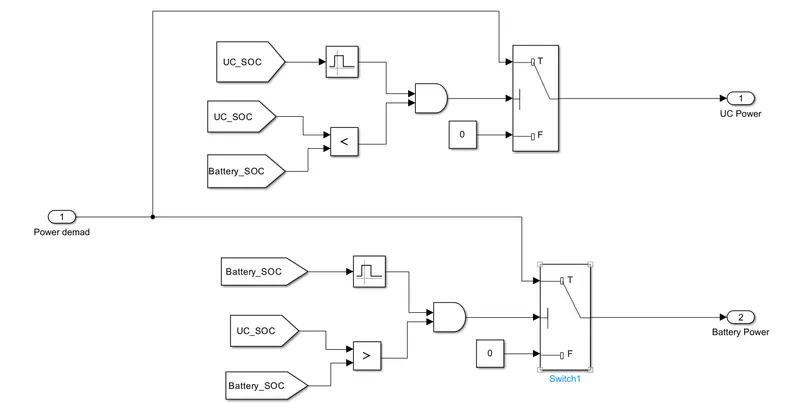
With an understanding of the operations of each component, an appropriate usage scenario can be defined. The battery lives longer with a lower C rate, so it is best suited for constant low power demand. The fuel cell is the most efficient for medium power demand. The UC is fairly robust and can be used during the peak power demand to reduce the load on other components. The torque demand has to be converted to power. The positive power and the negative power are separated. Positive power is categorized between low, medium and high. Then an appropriate source is chosen.
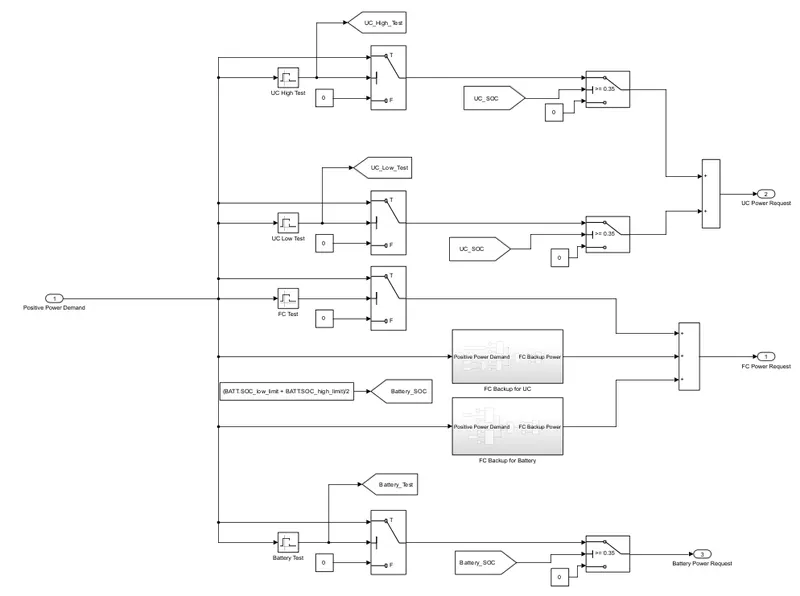
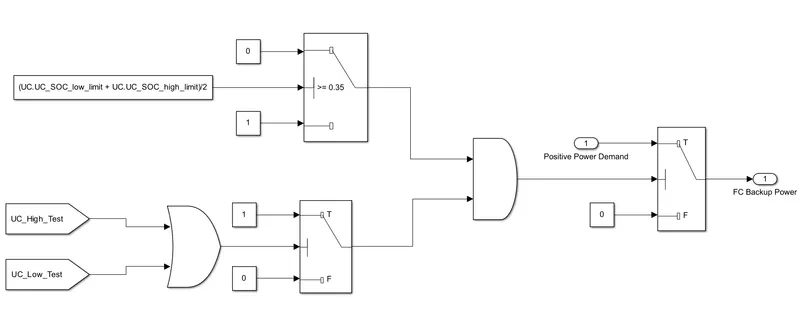
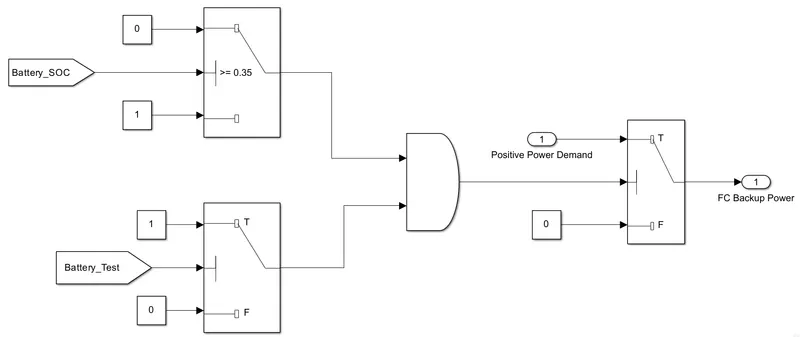
The negative power is the regenerative power. When the vehicle is decelerating or when the drives push the brake pedal, the regenerative energy of the battery or UC. For positive power, some fail-safe also needs to be created. If the SOC is low and the battery/UC can't support it, then the FCS should be used. There should be a situation in that no source is providing power. Creating a flow chart makes the Simulink implementation easier.
5. Acceleration and Brake to Torque
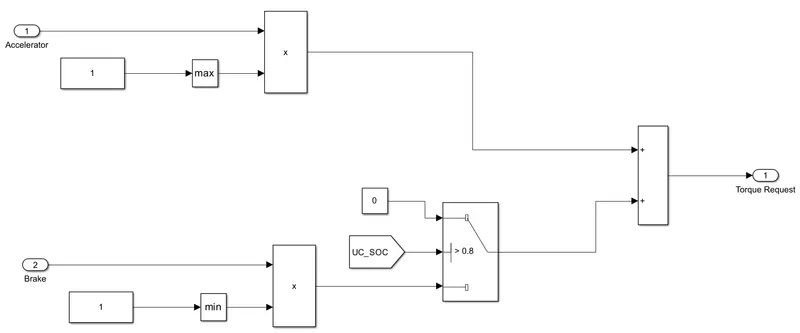
The driver block is based on the desired velocity that creates the accelerator and brake command. These commands are between 0-100% which are converted to 0-1 in the model. But the wheels need a torque command. The vehicle dynamics model works on the tractive force. Motor performance depends on elements such as voltage across terminals, the resistance across terminals and magnetic force. An EV's motor and electronics efficiency directly influences the battery weight, because the lost power needs to be compensated. Every 1% lower efficiency requires 1% more power from the battery (meaning more batteries).
6. Electric Motor Structure
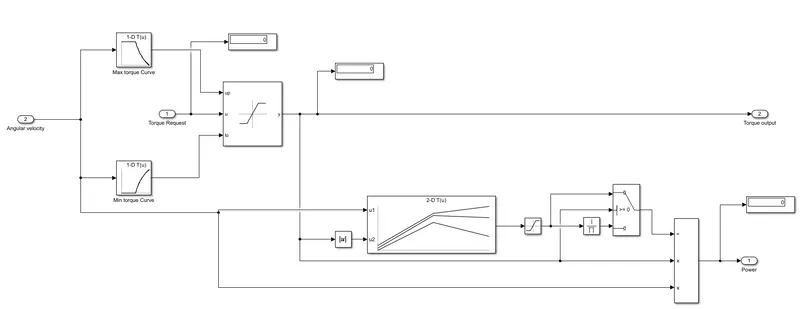
Torque is produced by the electric current in the rotor. Electric current is generated through electromagnetic induction from the magnetic field of stator windings. In a PM, magnets turn the rotor, which spins at the same speed as PMSM's internal rotating magnetic field.
Motor Speed Torque Curve
EM has the capability of providing high torque at low RPM. This makes EVs extremely fast. The base is the speed at which the motor will produce its maximum designed power output.
ICE Speed Torque Curve
- The IC Engines have a low torque response at low RPM.
- The engine is very less efficient at low RPM.
- The gearbox is added to increase torque at low RPM.
- Electric Motors are hence better for propulsion.
ICE vs EM Torque
- The IC Engine has low torque at low vehicle velocity.
- The EM has a much higher and constant torque.
- This also makes gearboxes redundant in EVs.
To convert the accelerator command to torque, a 1-D map of speed (RPM) vs torque is required. The brake or coasting command will result in negative torque which should slow down the vehicle. As the vehicle is slowing down, the motor creates regenerative power. Before passing this regenerative power request to the powertrain, the SOC of ESS should be checked. To convert the torque output, the formula used is Power = Torque * Angular Velocity.
The torque map which defines the relationship for regenerative is similar but with the opposite signs. The motor has some losses internally as well which causes the efficiency to be less than 100%.
Electric Motor Efficiency
The motor efficiency is a function of load and RPM. Motor efficiencies at constant RPM will change as the load changes. Overloaded motors can overheat and lose efficiency. At a lower load, the efficiency is much less. So this loss also needs to be factored in such that the driver demand is met. Thus incorporating this in the formula we get Power = (Torque * Angular velocity)/Efficiency. A 2-D map of torque and angular velocity vs efficiency is used.
7. Torque to Traction force
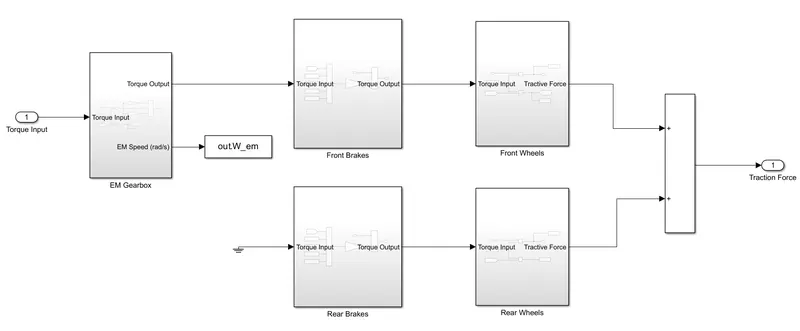
The torque request created using motor maps has to be translated to vehicle velocity. This is done by the traction force created at the wheel. It's important to calculate the traction force because that is fed into the vehicle model. The vehicle model takes this traction force and calculates the vehicle velocity. EVs have just a one-speed gearbox due to high motor torque output at low speeds. In FCEV, the propulsion is done just by EM as well. So the torque goes through this gearbox. Factoring in any braking, this torque then goes to the wheel where it's converted to traction force. For the rear brake in those models, no EM torque is considered since EM is mounted on the front axle.
Gearbox output
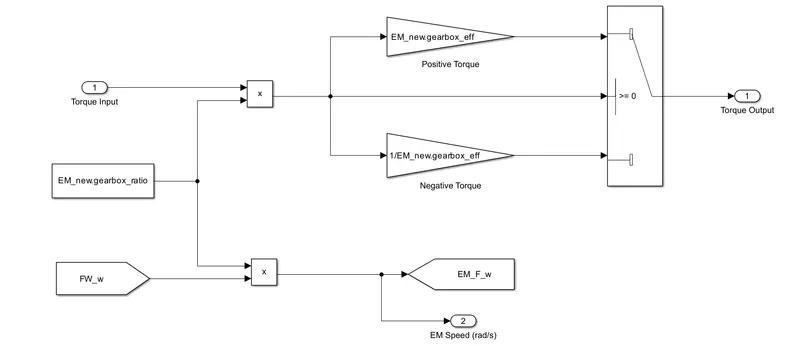
The output of the gearbox is dependent on the torque input from the EM and the efficiency of the gearbox. To put the output of the gearbox into a formula,
Torque out = Torque In * Gearbox ratio * Efficiency
Another parameter we need to calculate is the EM speed in rad/s. For this wheel, angular velocity is calculated first WH_F_W = Vehicle Velocity/Vehicle Radius of Tire
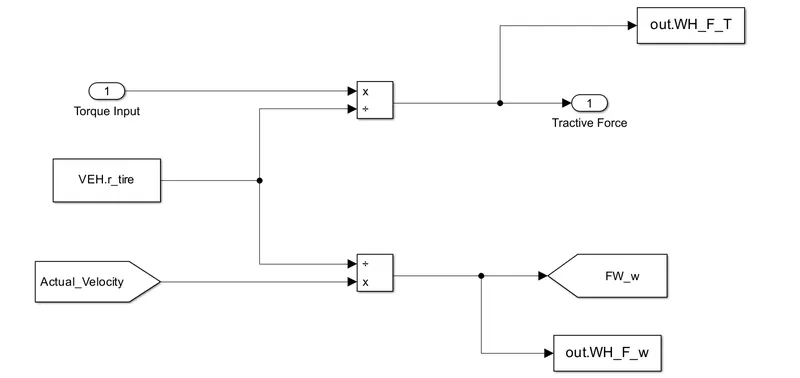
The wheel speed is after the gear ratio has changed the speed. So based on this, the EM speed can be formulated as EM Speed = Gearbox ratio * Wheel speed
Brakes
In the front wheel when the brakes are applied, based on the brake signals, braking torque is calculated. If the EM is mounted on the front axle, the regeneration adds to the braking torque along with the mechanical brakes. However, in the rear brakes because no EM is present. So all the braking force is mechanical.
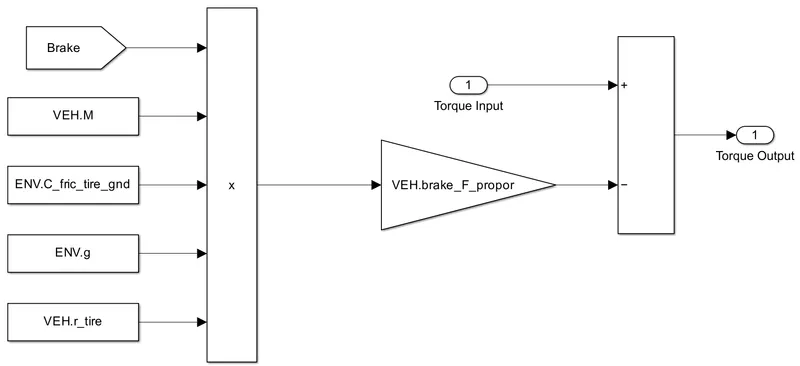
The formula for braking torque is
Braking Torque = Brake signal * Vehicle mass * Ground friction * Gravity * Tire radius
Traction Force calculation
The torque applied at a circular body of radius r creates a force F which is defined by the following formula: Torque = Radius * Force
With the torque calculated and the radius known force can be calculated. Similarly, the velocity of a circular body of radius r rotating at an angular velocity ω can be defined by
Velocity = Radius * ω
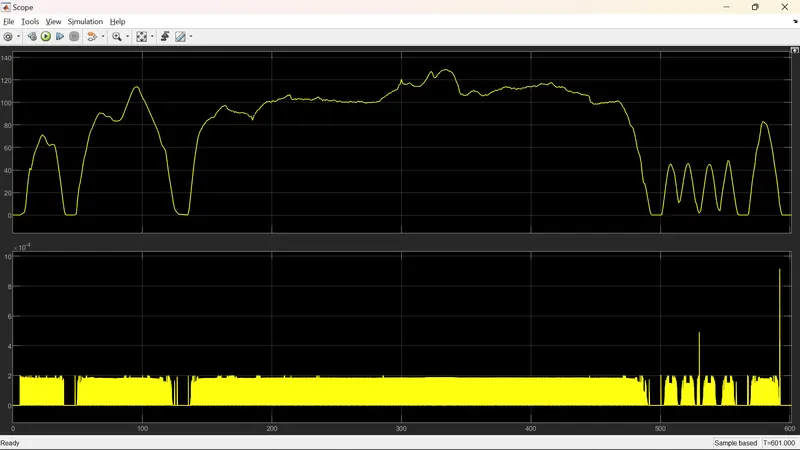
OUTPUT:
CONCLUSION
The Fuel cell electric vehicle has been designed and modelled in the Simulink environment. The model has worked as per desired with the same actual and desired velocity. The EMS working has analysed and was able to support all types of power demands and regenerative braking by keeping all ESSs in their rated operating range. The fuel cell along with the battery and UC has a great performance compared to individual performance as each of them has its properties. The fuel and air consumption of the Fuel cell has been analysed and is minimal compared to the fuel cell alone vehicle and also has higher dynamic performance.