Project
PROJECT
ALL TERRAIN VEHICLE
Aim:
To prepare a technical report of Simulation of BAJA All-Terrain Vehicle (ATV) under different conditions.
Objectives:
Carry out a system-level simulation of an all-terrain vehicle and prepare a technical report explaining the model properties & comments on the results.
ALL TERRAIN VEHICLE:
An all-terrain vehicle (ATV) is defined as a motorized off-highway vehicle designed to travel on four low-pressure or non-pneumatic tires, having a seat designed to be straddled by the operator and handlebars for steering control.
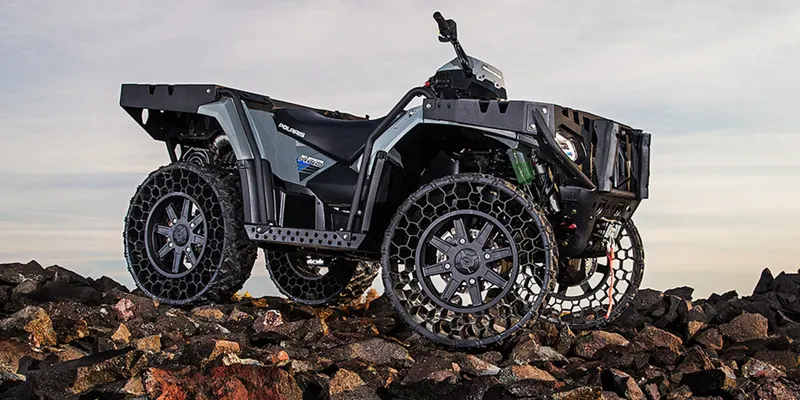
As the name implies, it is designed to handle a wider variety of terrain than most other vehicles. Although it is a street-legal vehicle in some countries, it is not street-legal within most states, territories and provinces of Australia, the United States or Canada. By the current ANSI definition, ATVs are intended for use by a single operator, although some companies have developed ATVs intended for use by the operator and one passenger. These ATVs are referred to as tandem ATVs. The rider sits on and operates these vehicles like a motorcycle, but the extra wheels give more stability at slower speeds. Although most are equipped with three or four wheels, six-wheel models exist and existed historically for specialized applications. Multiple-user analogues with side-by-side seating are called utility terrain vehicles (UTVs) or side-by-sides to distinguish the classes of vehicle. Both classes tend to have similar powertrain parts.
STUDY #1:
CASE1:
SIMULINK MODEL FOR BAJA ATV WITH CVT:
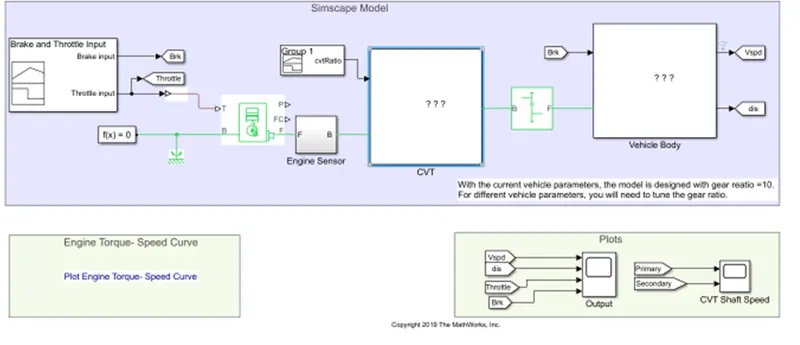
Major components in the model:
Continuously Variable Transmission drive (CVT):
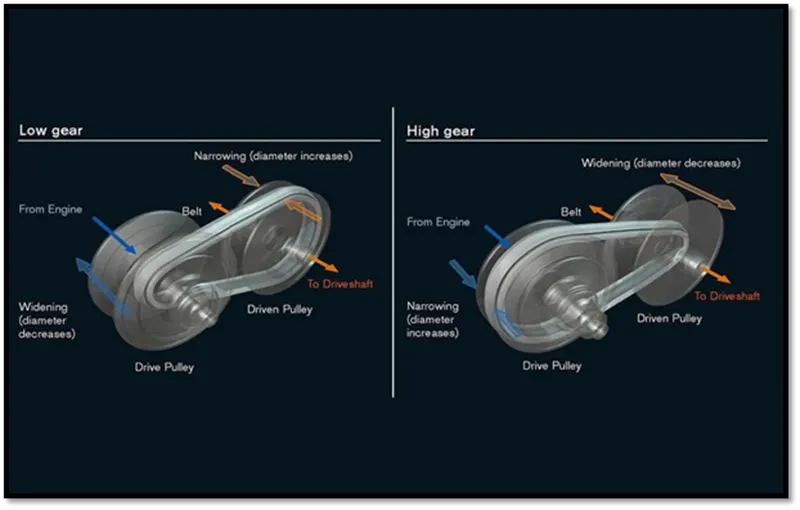
It is better to have more gears in a transmission, since it can optimize engine speed in a variety of driving conditions. That means low gears can provide better acceleration while higher gears can maximize fuel economy. CVTs differ from traditional automatic transmissions in that they don't have gears that provide "steps" between low- and high-speed operations. Instead, the majority of them work via a pair of variable-diameter, cone-shaped pulleys connected by a steel or composite belt. The halves of each pulley are aligned with the pointed ends of the cones touching. These form a V-shaped groove in which the connecting belt rides. One side of the pulley is fixed, and the other side is movable, actuated by a hydraulic cylinder. The cylinder can increase or decrease the amount of space between the two sides of the pulley. This allows the belt to ride lower or higher along the walls of the pulley, depending on driving conditions, thereby changing the "gear" ratio.
CTV Block:
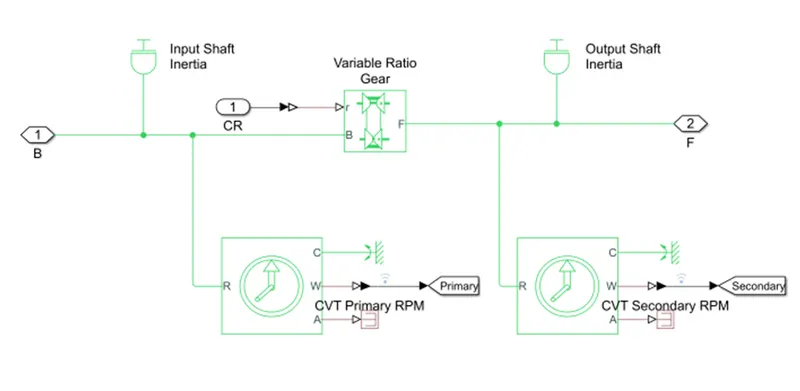
VARIABLE TRANSMISSION RATIO:
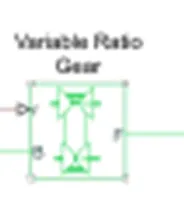
Represents a variable ratio gearbox such as implemented by mechanical belt CVT, electric, or hydraulic transmissions. The physical signal input r defines the ratio of input to output angular shaft velocities. Connections B (base) and F (follower) are mechanical rotational conserving ports. Specify the relation between base and follower rotation directions with the Output shaft rotates parameter.
ENGINE:
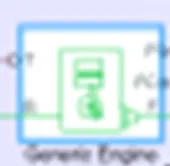
Represents a system-level model of spark-ignition and diesel engines suitable for use at initial stages of modelling when only the basic parameters are available. Optional idle speed and red line controllers are included. The throttle input signal T lies between zero and one and specifies the torque demanded from the engine as a fraction of the maximum possible torque. Connections F and B are mechanical rotational conserving ports associated with the engine crankshaft and engine block, respectively. Connections P and FC are physical signal output ports through which engine power and fuel consumption rate are reported.
INPUT SIGNAL:
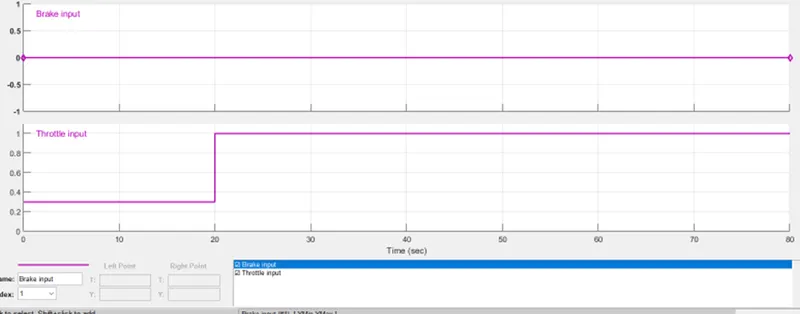
A Signal builder is used to create signals for brake and throttle.
CVT Gear ratio:
BAJA ATV WITH DASHBOARD MODEL:
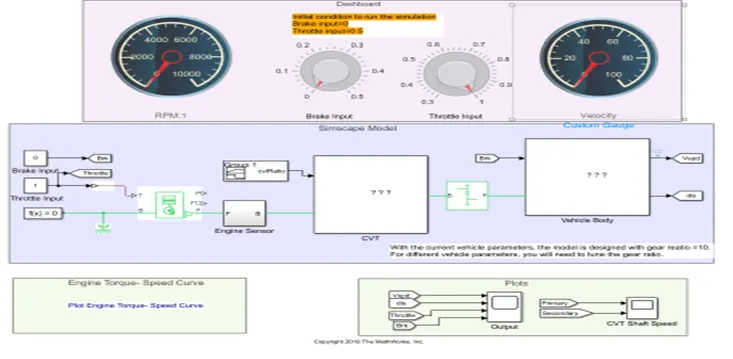
The study is based on 'Baja ATV with dashboard' as shown in the figure above here the input data like throttle and brake input are given from the dashboard instead of inputted with the help of a signal builder. All the remaining blocks are the same as in study above (i.e., study-1) The main intention behind the usage of the dashboard is to study the output value with the variation in the inputted values of throttle and brake, which will give the value of rpm and velocity of the engine in the digital reading. The value of gear ratio is maintained as 2.3 for the first 5 sec and decreases to 1.8 up to 35sec linearly so after that a constant value of that 1.8 is maintained all out the time span i.e., 80 sec. the value for the brake can be varied from 0 to 0.5 for the entire simulation. As we know that as throttle increases then the power increases by excess input of fuel into the system and shows in the output also increasing and vice versa.
BAJA ATV WITH LOOK-UP CHART:
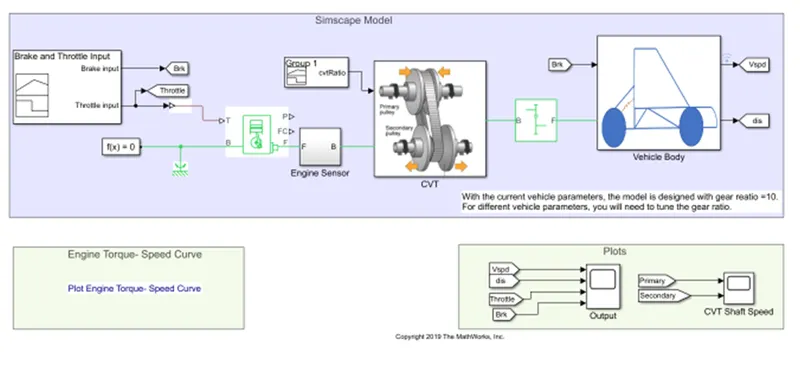
The above Simulink model of Baja ATV with CVT includes the step time, generic engine, motion sensors, vehicle transmission, vehicle body, tires, and solver configuration.
The CVT system includes a look-up table, an array of data that maps input values to output values, thereby approximating a mathematical function. If we give an input set of values, a look-up operation retrieves the corresponding output values from the tables. If the look-up table does not explicitly define the input values, then the Simulink can estimate output value using interpolation, extrapolation or rounding:
- Interpolation: It is the process of estimating values that lie between known data points
- Extrapolation: It is the process of estimating values that lie beyond the range of known data points.
- Rounding: It is the process of approximating the values by altering its digits according to a known value
Vehicle body subsystem:
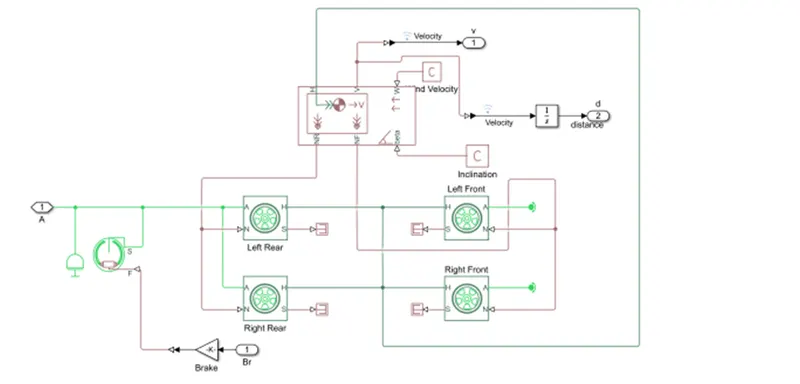
The brake and throttle input is given by step time, which depends on the run time and it varies accordingly. By using the loop-up table for the gear ratio and it gives the input to the CVT part and accordingly obtains the output. This method works in a closed-loop and the inputs are given with the loop-up table data. Here the Simulink gets the input values from the look-up tables and according to the values from the input, the output is got in terms of gear ratio
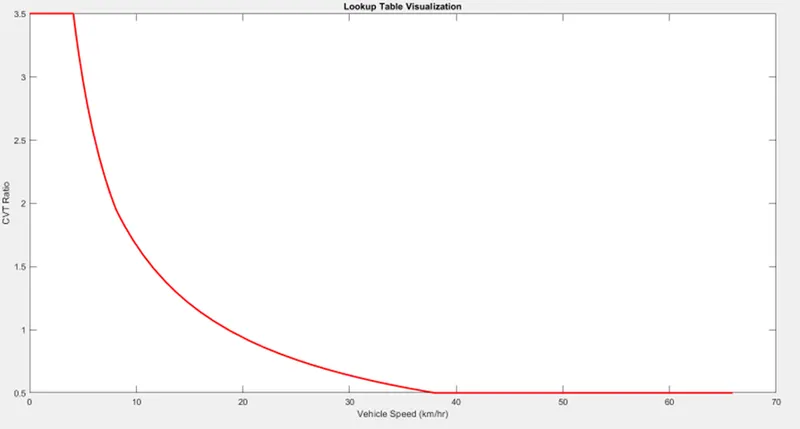
With the gear ratio varies from the range of 2.3 to 1.8 and the output in terms of velocity is got as for the range of gear ratio at a maximum value of nearly 56kmph.
BAJA ATV WITH DASHBOARD USING LOOK-UP TABLE:
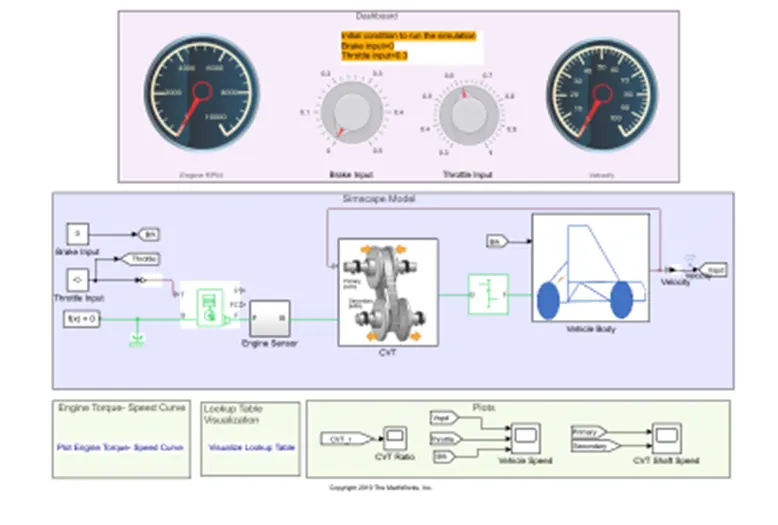
The above study based on the Baja ATV with the dashboard model using the look-up table which consists of throttle and brake meters in the dashboard. With the help of the dashboard, we can see the variation of the output with the input values been varied. Here as we know the gear ratio is inputted from the look-up table and the Simulink will give the output with respect to inputted values. The gear ratio is directly proportional to the torque. As we know that as throttle increases then the power increases by excess input of fuel into the system and shows in the output also increasing.
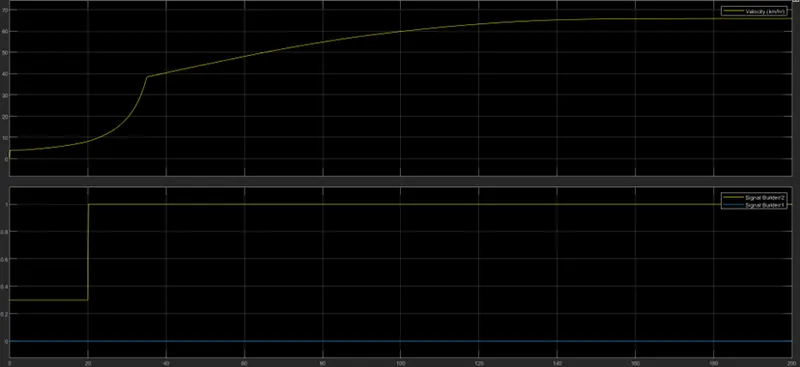
Here the brake value is set as a constant ie, zero and the throttle value from 0.3 to 1 in a time range of 20 second and such that the fuel injection happens in a time basics and the velocity part shows as raise as the throttle values increase by a constant linear line. From the above velocity vs time graph as the velocity part increases and set to a constant value due to throttle values is constant thereafter.
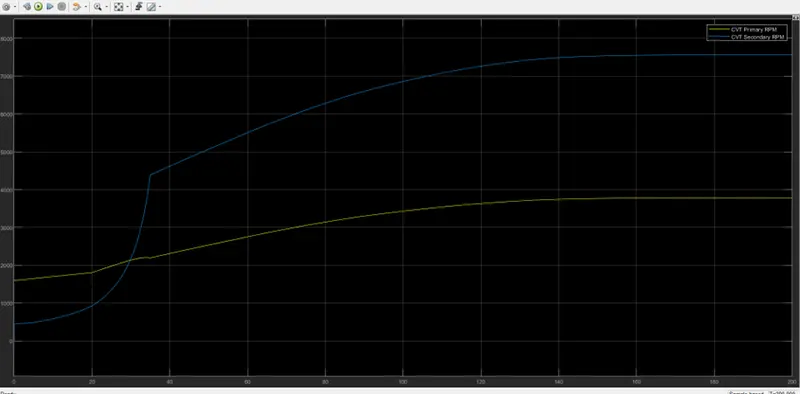
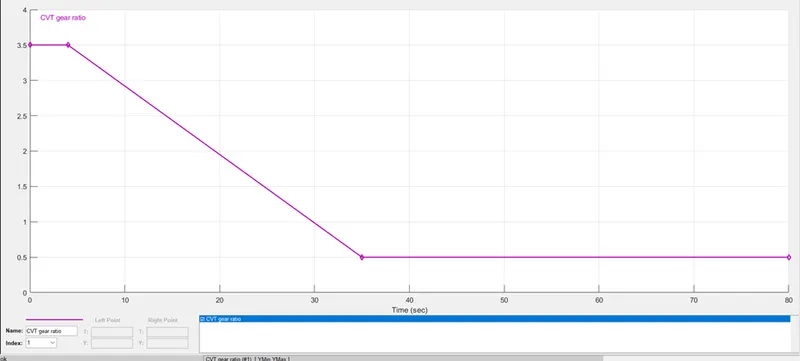
Here the ratio is determined by the outer to input diameter so that when the radius of the output part is high then the rpm will decrease which is in case reflecting in the above graph.
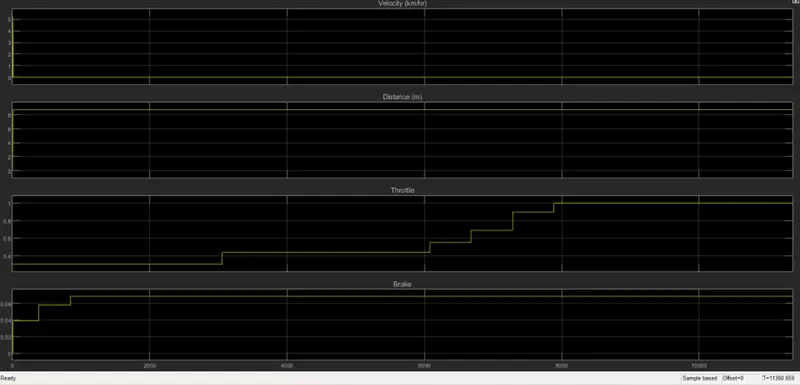
From the above graph, the brake is applied in this case we can see the decrease in the velocity part. Herewith the value of the throttle is increased in instant to 0.3 and maintained so that the velocity also increases rapidly to a value of nearly 47kmph and being at a constant as the throttle value increases the fuel input increases and the velocity increases and here shows as the throttle increases the vehicle velocity also increases from the graph above.
Conclusion:
System-level simulation of a Baja ATV with and without dashboard and Look-up Table has been carried out and a detailed study report of the model has been prepared.