Project-1: Powertrain for aircraft in runways
Part A:
1. Search and list out the total weight of various types of aircrafts.
MTOW = Maximum take-off weight,
MLW = Maximum landing weight,
TOR = Take-off run (SL, ISA+15°, MTOW),
LR = Landing run (SL, ISA+15°, MLW)
| Type | MTOW [kg] | MLW [tonnes] | TOR [m] | LR [m] | ICAO category | FAA category |
|---|---|---|---|---|---|---|
| Antonov An-225 | 640,000 | 591.7 | 3,500 | Heavy | Super | |
| Scaled Composites Model 351 Stratolaunch | 589,670 [1] | 3,660 | Heavy | Super | ||
| Airbus A380-800[2][3][4] | 575,000 | 394 | 3,100 | 1,930 | Heavy | Super |
| Boeing 747-8F | 447,700 | 346.091 | 3,100 | 1,800 | Heavy | Heavy |
| Boeing 747-8 | 443,613 | 306.175 | 3,100 | Heavy | Heavy | |
| Boeing 747-400ER | 412,770 | 295.742 | 3,090 | Heavy | Heavy | |
| Antonov An-124-100M | 405,060 | 330 | 2,520 | 900 | Heavy | Heavy |
| Boeing 747-400 | 396,900 | 295.742 | 3,018 | 2,179 | Heavy | Heavy |
| Lockheed C-5 Galaxy[5][6][7] | 381,000 | 288.417 | 2,530 | 1,494 | Heavy | Heavy |
| Boeing 747-200[8] | 377,840 | 285.7 | 3,338 | 2,109 | Heavy | Heavy |
| Boeing 747-300[8] | 377,840 | 260.32 | 3,222 | 1,905 | Heavy | Heavy |
| Airbus A340-500[9] | 371,950 | 240 | 3,050 | 2,010 | Heavy | Heavy |
| Airbus A340-600[9] | 367,400 | 256 | 3,100 | 2,100 | Heavy | Heavy |
| Boeing 777F | 347,800 | 260.816 | 2,830 | Heavy | Heavy | |
| Boeing 777-300ER | 351,800 | 251.29 | 3,100 | Heavy | Heavy | |
| Boeing 777-200LR | 347,450 | 223.168 | 3,000 | Heavy | Heavy | |
| Boeing 747-100[8] | 340,200 | 265.3 | Heavy | Heavy | ||
| Airbus A350-1000 | 308,000 | 233.5 | Heavy | Heavy | ||
| Boeing 777-300 | 299,370 | 237.683 | 3,380 | Heavy | Heavy | |
| Boeing 777-200ER | 297,550 | 213 | 3,380 | 1,550 | Heavy | Heavy |
| Airbus A340-300[9][10] | 276,700 | 190 | 3000 | 1926 | Heavy | Heavy |
| McDonnell Douglas MD-11 | 273,300 | 185 | 2,990 | 1,890 | Heavy | Heavy |
| Airbus A350-900 | 270,000 | 175 | 2,670 | 1,860 | Heavy | Heavy |
| Ilyushin Il-96M | 270,000 | 195.04 | 3,115 | 2,118 | Heavy | Heavy |
| McDonnell Douglas DC-10 | 256,280 | 183 | 2,990 | 1,890 | Heavy | Heavy |
| Boeing 787-9[11] | 254,000 | 192.777 | 2,900 | Heavy | Heavy | |
| Boeing 787-10[11] | 254,000 | 201.849 | Heavy | Heavy | ||
| Airbus A340-200[9][12] | 253,500 | 181 | 2990 | Heavy | Heavy | |
| Airbus A330-900 | 251,000 | 191 | 3,100 | Heavy | Heavy | |
| Ilyushin IL-96-300 | 250,000 | 175 | 2,600 | 1,980 | Heavy | Heavy |
| Airbus A330-300[13][14] | 242,000 | 185 | 2500 | 1750 | Heavy | Heavy |
| Airbus A330-200[13][14] | 242,000 | 180 | 2,220 | 1,750 | Heavy | Heavy |
| Lockheed L-1011-500 | 231,300 | 166.92 | 2,636 | Heavy | Heavy | |
| Boeing 787-8[11] | 228,000 | 172.365 | 3,300 | 1,695 | Heavy | Heavy |
| Lockheed L-1011-200 | 211,400 | Heavy | Heavy | |||
| Ilyushin IL-86 | 208,000 | 175 | Heavy | Heavy | ||
| Boeing 767-400ER | 204,000 | 158.758 | 3,414 | Heavy | Heavy | |
| Airbus A300-600R[15] | 192,000 | 140 | 2,385 | 1,555 | Heavy | Heavy |
| Boeing 767-300ER | 187,000 | 136.08 | 2,713 | 1,676 | Heavy | Heavy |
| Concorde | 185,000 | 111.1 | 3,440 | 2,220 | Heavy | Heavy |
| Airbus A300-600[15] | 163,000 | 138 | 2,324 | 1,536 | Heavy | Heavy |
| Boeing 767-300 | 159,000 | 136.078 | 2,713 | 1,676 | Heavy | Heavy |
| Airbus A310-300[15] | 157,000 | 124 | 2,290 | 1,490 | Heavy | Heavy |
| Vickers VC10 | 152,000 | 151.9 | Heavy | Heavy | ||
| Boeing 707-320B[16] | 151,000 | 97.5 | Heavy | Heavy | ||
| Boeing 707-320C[16] | 151,000 | 112.1 | Heavy | Heavy | ||
| Douglas DC-8-61 | 147,000 | Heavy | Heavy | |||
| Airbus A310-200[15] | 142,000 | 123 | 1,860 | 1,480 | Heavy | Heavy |
| Airbus A400M | 141,000 | 122 | 980 | 770 | Heavy | Heavy |
| Douglas DC-8-32 | 140,000 | Heavy | Heavy | |||
| Douglas DC-8-51 | 125,000 | Medium | Large | |||
| Boeing 757-300 | 124,000 | 101.6 | 2,550 | 1,750 | Medium | Large |
| Boeing 707-120B[16] | 117,000 | 86.3 | Medium | Large | ||
| Boeing 757-200 | 116,000 | 89.9 | 2,347 | 1,555 | Medium | Large |
| Boeing 720B[17] | 106,000 | 79.5 | Medium | Large | ||
| Boeing 720[17] | 104,000 | 79.5 | Medium | Large | ||
| Tupolev Tu-154M | 104,000 | 80 | Medium | Large | ||
| Tupolev Tu-204SM | 104,000 | 87.5 | 2,250 | Medium | Large | |
| Convair 880 | 87,500 | Medium | Large | |||
| Boeing 737-900 | 85,000 | 66.36 | 2,500 | 1,704 | Medium | Large |
| Boeing 737-900ER | 85,000 | 71.35 | 2,804 | 1,829 | Medium | Large |
| Boeing 727-200 Advanced[18] | 84,000 | 70.1 | Medium | Large | ||
| Airbus A321-100[19] | 83,000 | 77.8 | 2,200 | 1,540 | Medium | Large |
| Boeing 737-800 | 79,000 | 65.32 | 2,308 | 1,634 | Medium | Large |
| Boeing 727-200[18] | 78,000 | 68.1 | Medium | Large | ||
| McDonnell-Douglas MD-83 | 73,000 | 63.28 | Medium | Large | ||
| Boeing 727-100[18] | 72,500 | 62.4 | Medium | Large | ||
| Boeing 727-100C[18] | 72,500 | 62.4 | Medium | Large | ||
| McDonnell-Douglas MD-90-30 | 71,000 | 64.41 | 2,165 | 1,520 | Medium | Large |
| de Havilland Comet 4 | 70,700 | Medium | Large | |||
| Boeing 737-700 | 70,000 | 58.06 | 1,921 | 1,415 | Medium | Large |
| Airbus A320-100[19] | 68,000 | 66 | 1,955 | 1,490 | Medium | Large |
| Boeing 737-400 | 68,000 | 54.9 | 2,540 | 1,540 | Medium | Large |
| de Havilland Comet 3 | 68,000 | Medium | Large | |||
| Boeing 377 | 67,000 | Medium | Large | |||
| Boeing 737-600 | 66,000 | 54.66 | 1,796 | 1,340 | Medium | Large |
| Airbus A220-300 | 65,000 | 57.61 | 1,890 | 1,494 | Medium | Large |
| Hawker Siddeley Trident 2E | 65,000 | Medium | Large | |||
| Airbus A319[19] | 64,000 | 62.5 | 1,850 | 1,470 | Medium | Large |
| Boeing 737-300 | 63,000 | 51.7 | 1,939 | 1,396 | Medium | Large |
| Boeing 737-500 | 60,000 | 49.9 | 1,832 | 1,360 | Medium | Large |
| Airbus A220-100 | 59,000 | 50.8 | 1,463 | 1,356 | Medium | Large |
| Airbus A318[19] | 59,000 | 57.5 | 1,375 | 1,340 | Medium | Large |
| Boeing 717-200HGW | 55,000 | 47.174 | 1,950 | Medium | Large | |
| Douglas DC-7 | 55,000 | Medium | Large | |||
| de Havilland Comet 2 | 54,000 | Medium | Large | |||
| Boeing 717-200BGW | 50,000 | 46.265 | 1,950 | Medium | Large | |
| de Havilland Comet 1 | 50,000 | Medium | Large | |||
| Douglas DC-6A | 48,600 | Medium | Large | |||
| Douglas DC-6B | 48,500 | Medium | Large | |||
| Embraer 190[20] | 48,000 | 43 | 2,056 | 1,323 | Medium | Large |
| Caravelle III | 46,000 | Medium | Large | |||
| Fokker 100 | 46,000 | 39.95 | 1,621 | 1,350 | Medium | Large |
| Douglas DC-6 | 44,000 | Medium | Large | |||
| Avro RJ-85 | 42,000 | 36.74 | Medium | Large | ||
| Handley Page Hermes | 39,000 | Medium | Large | |||
| Embraer 175[21] | 37,500 | 32.8 | 2,244 | 1,304 | Medium | Large |
| Bombardier CRJ900[22] | 36,500 | 33.345 | 1,778 | 1,596 | Medium | Large |
| Embraer 170[23] | 36,000 | 32.8 | 1,644 | 1,274 | Medium | Large |
| Bombardier CRJ700 | 33,000 | 30.39 | 1,564 | 1,478 | Medium | Large |
| Douglas DC-4 | 33,000 | Medium | Large | |||
| Vickers Viscount 800 | 30,400 | Medium | Large | |||
| Bombardier Q400 | 28,000 | 28.01 | 1,219 | 1,295 | Medium | Large |
| Bombardier CRJ200 | 23,000 | 21.319 | 1,918 | 1,479 | Medium | Large |
| ATR 72-600 | 22,800 | 22.35 | 1,333 | 914 | Medium | Large |
| Saab 2000 | 22,800 | 21.5 | 1,300 | Medium | Large | |
| Embraer ERJ 145 | 22,000 | 19.3 | 2,270 | 1,380 | Medium | Large |
| ATR 42-500 | 18,600 | 18.3 | 1,165 | 1,126 | Medium | Small |
| Saab 340 | 13,150 | 12.930 | 1,300 | 1,030 | Medium | Small |
| Embraer 120 Brasilia | 11,500 | 11.25 | 1,560 | 1,380 | Medium | Small |
| BAe Jetstream 41 | 10,890 | 10.57 | 1,493 | 826 | Medium | Small |
| Learjet 75[24] | 9,752 | 8.709 | 1,353 | 811 | Medium | Small |
| Pilatus PC-24[25] | 8,300 | 7.665 | 893 | 724 | Medium | Small |
| Embraer Phenom 300[26] | 8,150 | 7.65 | 956 | 677 | Medium | Small |
| Beechcraft 1900D | 7,765 | 7.605 | 1,036 | 853 | Medium | Small |
| Cessna Citation CJ4[27] | 7,761 | 7.103 | 1039 | 896 | Medium | Small |
| de Havilland Hercules | 7,000 | Medium | Small | |||
| Embraer Phenom 100 | 4,800 | 4.43 | 975 | 741 | Light | Small |
2. Is there any difference between ground speed and air speed?
Answer :- Yes ,there is difference between ground speed and airspeed.
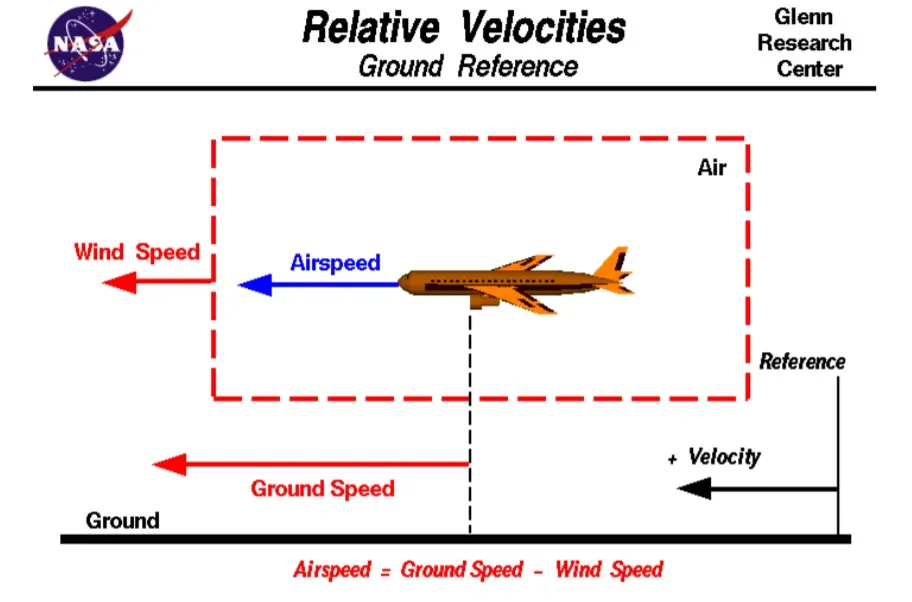
Airspeed is what determines whether there is enough airflow around an aircraft to make it fly.
Ground speed is what determines how fast an aircraft will get to its destination.
As mentioned above, true airspeed is simply the speed at which an aircraft is moving relative to the air it is flying in. As such, it’s also the speed at which the air is flowing around the aircraft’s wings.
Ground speed, on the other hand, is the aircraft’s speed relative to the ground. One thing that should be noted here is that it’s its horizontal rather than vertical speed – an aircraft climbing completely vertically would have a ground speed of zero.
3. Why is it not recommended to use aircraft engine power to move it on the ground at Airport?
Answer :- It is not recommended to use aircraft engine power to move it on the ground at Airport because :-
- Aircraft Engines can create hazardous conditions .
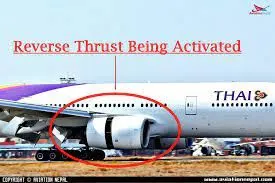
- When an aircraft's engine is activated, the thrust can create a high-speed wind that can easily cause damage to the airport terminal, surrounding ground vehicles, jetway, baggage and most importantly, ground personnel.
4. How an aircraft is pushed to runway when its ready to take off?
Answer :-
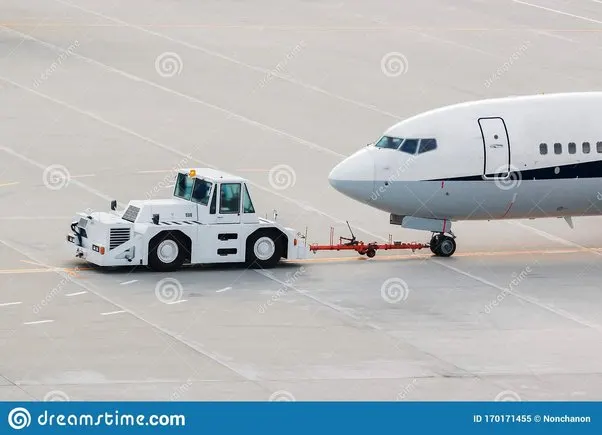
- In order to pushback an aircraft, ground handlers must insert the pushback tractor supports underneath the nose wheel of the aircraft. This support is known as a towbar. Once in place, the powerful pushback hydraulics are able to lift the nose wheel, making the aircraft manoeuvrable on the ground.
- Closer to departure, an aircraft tug will park right in front of the nose wheel. The tug might be directly attached to the plane's nose gear with a tow bar, or could be a “wheel-lift” tug.
-
Although many aircraft are capable of moving themselves backwards on the ground using reverese thrust (a procedure referred to as a powerback), the resulting jetblast or propwash might cause damage to the terminal building or equipment. Engines close to the ground may also blow sand and debris forward and then suck them into the engine, causing damage to the engine. A pushback is therefore the preferred method to move the aircraft away from the gate.
Pushbacks at busy aerodromes are usually subject to ground control clearance to facilitate ground movement on taxiways. Once clearance is obtained, the pilot will communicate with the tractor driver (or a ground handler walking alongside the aircraft in some cases) to start the pushback. To communicate, a headset may be connected near the nose gear.
Since the pilots cannot see what is behind the aircraft, steering is done by the pushback tractor driver and not by the pilots. Depending on the aircraft type and airline procedure, a bypass pin may be temporarily installed into the nose gear to disconnect it from the aircraft's normal steering mechanism.
Once the pushback is completed, the towbar is disconnected, and any bypass pin removed. The ground handler will show the bypass pin to the pilots to make it clear that it has been removed. The pushback is then complete, and the aircraft can taxi forward under its own power.
5. Learn about take off power, tyre design, rolling resistance, tyre pressure, brake forces when landing.
Answer :- Take off power : Power take off means a secondary engine shaft that provide sustaintial auxilary power for purposes unrelated to vehicle propulsion or normal vehicle accessories such as air conditioning,power steering and basic electrical accessories.
2.TYRE DESIGN :
DESIGN AND CONSTRUCTION OF AIRCRAFT TYRES :-
- They support the weight of an aircraft while it is on the ground.
- It also provides the necessary traction for braking and stopping of an aeroplane.
- Tyre also helps to absorb the shock of landing and provide cushioning the roughness of takeoff, roll-out, and taxi operations.
-
Unlike an automobile or truck tyre, it does not have to carry a load for a long period of continuous operation. However, an aircraft tyre absorbs the high impact loads of landing, and also it’s operating at high speeds for a short time when required.
Retreading – Retreading is methods of restoring a worn tyre by renewing the tread area or by renewing the tread area plus one or both sidewalls. Repairs are included in the tyre retreading process.
Load Rating – Load rating is the maximum permissible load at a specified inflation pressure.
Ply Rating – Ply Rating is used to identify the maximum recommended load rating and inflation pressure for a specified tyre. It is an index of tyre strength.
Speed Rating – The speed rating is the maximum takeoff speed to which the tyre has been tested.
Skid Depth – Skid depth is the distance between the tread surface and the deepest groove as measured in the mould.
Aircraft tyres must have an approved speed and load rating and have sufficient clearance when retracted through landing gear to allow for tyre growth. Tyre growth is the increase in the size of the tyre due to centrifugal forces at high speed.
Aircraft tyres may be Tube-type or Tubeless
Tubeless tyres are more advantageous over tube-type. There is no longer the use of tube-type tyre in recent aviation. Nowadays all airliners are using tubeless tyres. Tubeless that are meant to be used without a tube has the word TUBELESS on the sidewall of the tyre.
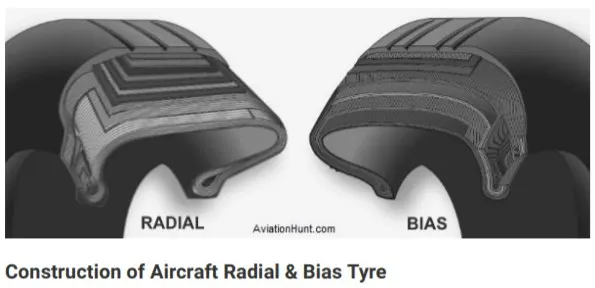
Aircraft tyres may be Radial or Bias
Almost all airliners are using Radial tyre. Bias is an older design, and it’s mainly used for road vehicles. Radial tyres have the word RADIAL on the sidewall. Radial tires are more expensive than bias-ply tyres. Radial tires are in demand because of their lower life cycle cost and long term value.
Radial tyre construction :
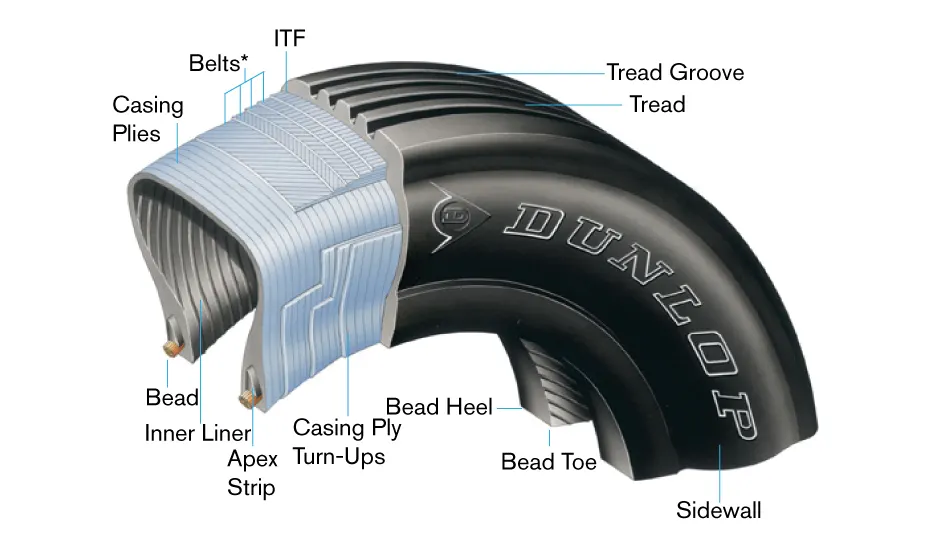
Radial tires are the most modern design of aircraft tyres. It is a design that is similar to that of car tyres. Typically, the radial tyre offers more landings per tread and lighter weight than a bias tyre; though sometimes at the expense of retread lives.
Radial aircraft tyres differ to bias aircraft tyres in that the plies all run radially from bead to bead at approximately 90° to the centre-line of the tyre. Angled belt plies are laid between the tread and the top casing ply, resulting in a flatter tread and adding strength to the tyre.
Bias ply tyre :
A bias-ply tyre has the fabric bias oriented with and across the direction of rotation and the sidewall. Since fabric can stretch on the bias, the tyre is flexible and can absorb loads. Tyre strength is obtained by adding plies.
Rolling resistance :=>
Rolling resistance is one of the forces that act to oppose the motion of a cyclist. It is caused mainly because of deformation of the tyre and can be understood by thinking about:
1. energy losses due to heat (hysteresis)
2. the forces pushing on the tyre.
Energy is lost as heat
As the tyre comes into contact with the road, it changes shape as it is compressed (pushed in a bit). This compression causes parts of the rubber tube and the casing of the tyre to heat up. It also causes the tread on the outside of the tyre to heat up as it comes into contact with the road. A tyre with knobbly tread will have a lot more rolling resistance than a smooth tyre because there will be more rubber being compressed and so there will be more heat.
The tyre is a bit like a spring or a rubber band. Some of the energy is stored as the tyre becomes compressed (squeezed in). As the tyre comes back off the road, there is not as much of this stored energy returned because some of it has gone towards making the tyre heat up. This loss of available energy due to heating is called hysteresis. This means there will be less energy available to make the bike go faster.
If you feel the temperature of your tyres when you have been biking fast, you will notice this heat. If your tyres are not pumped up hard, there will be even more heat created.
The force of rolling resistance does not change at higher speeds. However, because there is a lot more heat being produced at higher speeds, the cyclist uses more power (energy per second) to work against rolling resistance.
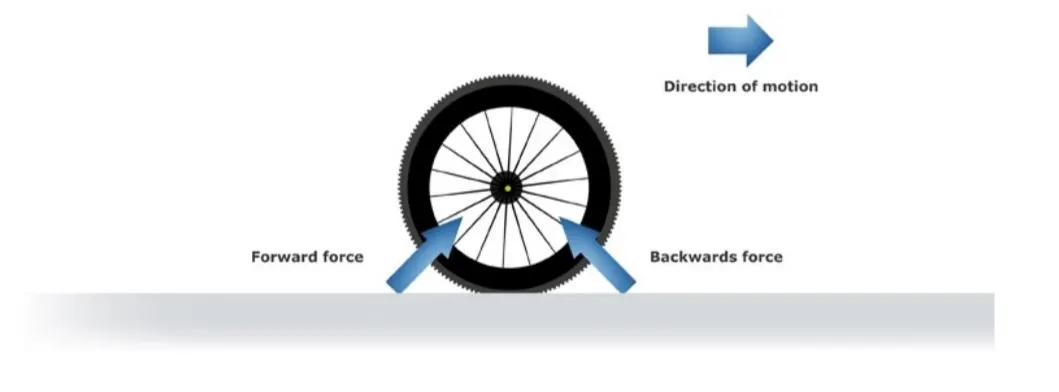
Forces on the front part of the tyre are greater
Forces on a tyre
Rolling resistance happens because the force pushing backwards against the tyre as it comes into contact with the road is bigger than the force pushing forwards as it leaves.
As the front part of the tyre touches the road, it takes a lot of force to squeeze in the tyre. This causes a backwards force on the wheel. As the tyre comes back off the road, there is a force pushing forwards on the wheel, but this forwards force is not as great. This is because of internal friction in the tyre.
If you could design a tyre that didn’t have internal friction and didn’t heat up, the force at the front section of the tyre contacting the road would be the same size as the force on the back section. This would mean zero rolling resistance, assuming there was no energy loss due to compression of the road surface.
Some things that affect rolling resistance
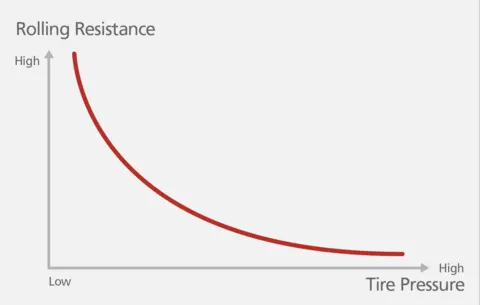
Rolling resistance depends on the mass of the cyclist and the bike, cornering, the design of your tyres, tyre pressure and road surface.
Mass – more mass means more downwards force due to gravity onto the road. This results in more tyre compression so rolling resistance increases. Carrying things like extra water bottles increases your rolling resistance.
Cornering – going through corners causes track cyclists to slow down, partly because cornering results in a greater downwards force into the track, which increases rolling resistance. (Cornering also increases rolling resistance because the rubber is twisting sideways on the road a bit, and this twisting produces more friction and heat.)
Design of tyres – choosing materials and construction that don’t heat up as much will result in less rolling resistance. One way to do this is to make your tubes out of specialised latex rubber. Racing tyres are very smooth, narrow and pumped up hard. The casing is also designed to minimise heat loss as it deforms. With as little of the tyre being compressed in as possible, there will not be as much of this heating effect, so there will be more energy available for more speed. There are many options for cyclists to consider.
Road or track surface – wooden cycle tracks contribute to a very low rolling resistance. Roughsealed roads have more rolling resistance. Grass and soft dirt surfaces are much greater. If the surface can be deformed, this increases rolling resistance markedly.
Choosing tyre materials and construction that don’t heat up as much will result in less rolling resistance.
Calculating rolling resistance
This equation is used to calculate the force of rolling resistance from each tyre:
FRR = CRR x weight
FRR is the rolling resistance force.
CRR is the coefficient of rolling resistance (a number used to rate each tyre at a given pressure),
weight is the force due to gravity being exerted on each tyre (= mass (kilograms) x 9.8).
This equation shows that speed does not affect the force due to rolling resistance. The type of tyre and the mass of the bike plus rider are the only two variables.
Tyre pressure =>
An aircraft tire or tyre is designed to withstand extremely heavy loads for short durations.The number of tires required for aircraft increases with the weight of the aircraft, as the weight of the airplane needs to be distributed more evenly. Aircraft tire tread patterns are designed to facilitate stability in high crosswind conditions, to channel water away to prevent hydroplaning, and for braking effect.
Aircraft tires also include fusible plugs (which are assembled on the inside of the wheels), designed to melt at a certain temperature. Tires often overheat if maximum braking is applied during an aborted takeoff or an emergency landing. The fuses provide a safer failure mode that prevents tire explosions by deflating in a controlled manner, thus minimizing damage to aircraft and objects in the surrounding environment.
Inflation :
Each of the twelve Boeing 777-300ER main tires is inflated to 220 psi (15 bar; 1,500 kPa), weighs 120 kg (260 lb), has a diameter of 134 cm (53 in) and is changed every 300 cycles while the brakes are changed every 2000 cycles.
Aircraft tires generally operate at high pressures, Inflation up to 200 psi (14 bar; 1,400 kPa) for airliners, and even higher for business jets.
Tests of airliner aircraft tires have shown that they are able to sustain pressures of maximum 800 psi (55 bar; 5,500 kPa) before bursting.
Aircraft tires are usually inflated with nitrogen to minimize expansion and contraction from extreme changes in ambient temperature and pressure experienced during flight.
Brake forces and landing=>
Bringing at aircraft down to the runway from 37,000 feet is only part of the challenge. It’s not over until the aircraft is safely parked at its gate. In order to do this, pilots have a number of systems available to slow the aircraft down, even in a blizzard on a snowcovered runway.
The 787 braking system:
Stopping a 200-tonne aircraft landing at 180 mph requires a lot of braking force. To do this, the 787 has one brake unit on each of the eight wheels on the main gear assembly.
On other aircraft types, the brake units are powered by the hydraulics system. An electrical signal is sent from the flight deck to hydraulic actuators near the main landing gear. Here, hydraulic fluid at 3,000 pound per square inch is used to force the brake unit against the wheel, thus slowing it down.
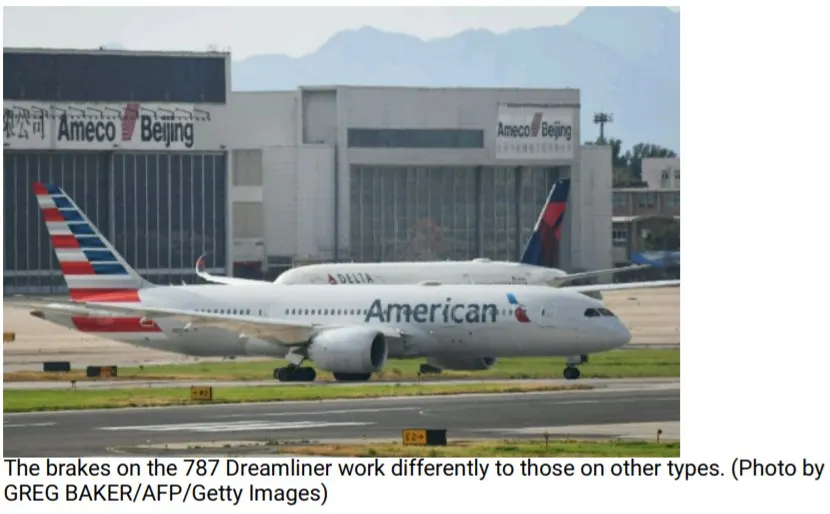
That’s the case on the 787 Dreamliner. Designers did away with the use of the hydraulic system and all its associated architecture and instead used electricity to power the brakes. When the pilots press on the brake pedals, an electrical signal is sent to the brake unit on the wheel. Here, electrically powered actuators are used to press the carbon brake disc against the wheel, slowing it down.
Electric brakes
The brake system on the 787 Dreamliner is controlled by the pilots pressing the tops of the rudder pedals under their feet, demanding the rate of braking which they require. This sends an electronic signal to the Left and Right Brake System Control Units (BSCUs).
These then send signals to the four Electronic Brake Actuator Controllers (EBAC) which control the rate of braking on the wheels. Each wheel has four Electric Brake Actuators (EBA), a kind of piston which presses against the carbon brake discs.
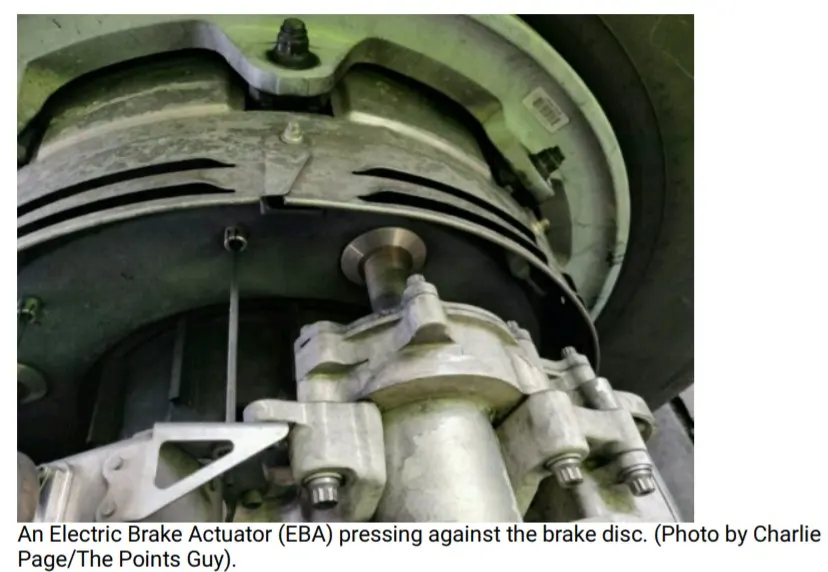
The brake disks themselves are made up of two parts. Firstly, there are the rotors. These are connected to the wheel by drive tabs (in the video below they are the black rectangles on the rotor disks). As these drive tabs are in contact with the inside of the wheel, they spin at the same speed. Depending on the brake manufacturer, there are either four or five of these rotors on each brake assembly.
The second part of the disks are the stators. These sit around each rotor and are fixed in place and thus don’t move. As the wheel turns, the rotors spin round inside the stators.
When the brakes are applied, the four EBAs apply pressure to the first stator. This in turn squeezes the stationary stators up against the spinning rotors and it’s this friction which slows the wheel down.
Anti-skid protection
When landing on slippery runways, there’s a chance that the wheels may start to skid as the brakes are applied. To stop this from happening and to maintain maximum effective braking, each wheel has anti-skid protection.
Using a variety of sources to determine the aircraft speed, the brake units know how fast the wheels should be spinning. If that speed drops significantly, it’s because the current brake pressure on that wheel is too great and the wheel is just skidding over the surface.
In this situation, the anti-skid system automatically reduces the braking on that wheel to a point where the skid stops before reapplying the pressure. All this is done in a fraction of a second.
Autobrake
Pressing on the brakes is pretty straight forward when taxiing in a straight line at low speed. However, when we’re landing in strong winds, it can be a little tricky. We need to use our feet on the rudder pedals to line the nose of the aircraft up with the runway centerline at the last moment. Then, whilst holding that position, slide our feet up to press the toe brakes. Really not very easy when moving at 160 mph.
To help us get the braking underway as soon as we touch down, we have the autobrake system.This provides automatic braking at a preselected rate as soon as the aircraft senses that it is on the ground. It also provides full braking pressure in the case of a rejected takeoff if the speed is above 85 knots (98 mph).
Bottom line
Bringing an aircraft to a safe stop is the most important part of a flight. In order to do this, pilots have a number of facilities available to them.
The brakes bear the brunt of the hard work with the spoilers and reverse thrust lending a helping hand to ensure maximum efficiency. The autobrake system helps keep the deceleration nice and smooth whilst the anti-skid system reduces the distances needed to stop by modulating the brakes on individual wheels and stopping them from skidding.
Aircraft can also depart with part of the braking system not working. By carrying out a performance calculation before every takeoff and landing, we ensure that the aircraft will stop safely in the given conditions, even at maximum takeoff weight.
Part B:
6. A. With necessary assumptions, calculate the force and power required to push / pull an aircraft by a towing vehicle.
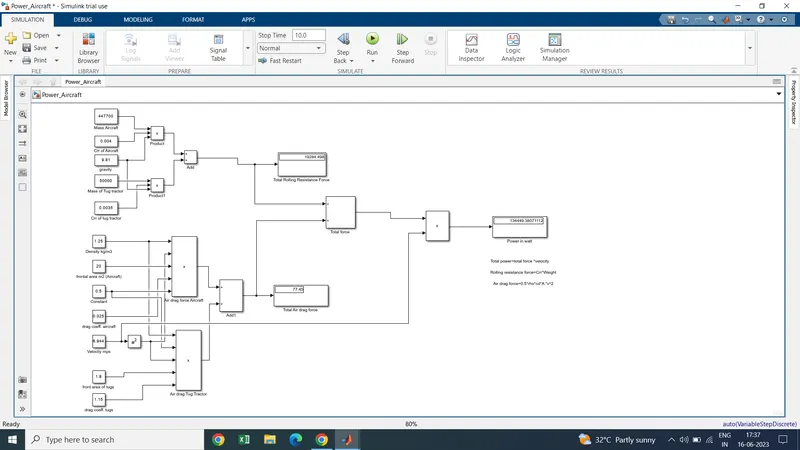
B. Develop the model for the calculated force and power using Simulink.
Solution A)
Let us Assume:
Weight of the Aircraft (Boeing 747-8) = 447,700kg
Rolling Resistance Coefficient of an aircraft tire = 0.004
Wight of the Tugs Tractor = 50000kg
Rolling Resistance Coefficient of Towing Vehicle = 0.0035
Then,
Rolling Resistance Force of Tugs Tractor =FRR = CRR x weight = .0035*50,000*9.81 =1,716.75 N
Rolling Resistance Force of aircraft =FRR = CRR x weight =.004*50,000*9.81 =17,567.748 N
Total Rolling Resistance Force = Rolling Resistance Force of aircraft + Tugs Tractor = 17.567+ 1.71675
Total Rolling Resistance Force = 19.28 KN
The Aerodynamic Drag is given by,
rho= Density of Air Medium
A = Frontal Area Of the Vehicle which strike the Air
V = Velocity with the vehicle moves
Cd= Coefficient of Dragwhich varies different shapes of the frontal area.
Calculation:
Let us assume
The Velocity of the Aircraft while Towing = 25 KMPH = 6.944 m/s
Density of Air medium = 1.25 kg/m3
The Frontal area of the Aircraft = 20 m2
The Frontal area of the Tugs = 1.8 m2
The Coefficient of Drag of the Aircraft = 0.025
The Coefficient of Drag of the Tugs tractor = 1.15
Air drag force = 0.5*rho*A*V^2*Cd
The Air Drag Force of the Aircraft = .5*1.25*20*(6.944^2)*.025 = 15.07 N
The Air Drag Force of the Tugs Tractor = .5*1.25*1.8*(6.944^2)*1.15 = 62.38 N
Total Aerodynamic Drag Force = Air Drag Force of the Aircraft + Air Drag Force of the Tugs Tractor = 15.07 N + 62.38 N
Total Aerodynamic Drag Force = 77.45 N
Therefore the total force that the motor needs to overcome = Total Rolling Resistance Force + Total Aerodynamic Drag Force = 19.28 + .07745 (KN) = 19.362 KN
Thus Total Force that the Motor needs to overcome in order to push/pull the Aircraft = 19.362 KN
The Power Required-
The power required by the motor is given by the velocity with which the towing operation takes place.
The average speed of push/pull = 25 kmph = 6.9444 m/s
Power required by the motor = Total Force*Velocity = 19.362*6.9444
Power Required by The Motor = 134 KW
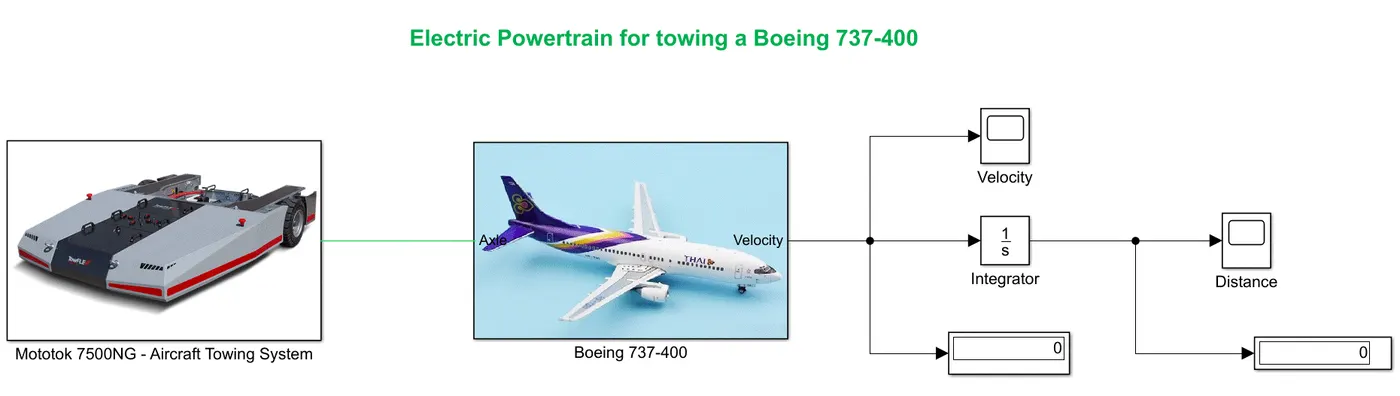
The simulink model is as shown below :-
7. A. Design an electric powertrain with type of motor, it’s power rating, and energy requirement to fulfill aircraft towing application in Simulink. Estimate the duty cycle range to control the aircraft speed from zero to highest. Make all required assumptions. Prepare a table of assumed parameters. Draw a block diagram of powertrain.
(Hint :DC7 Block)
B. Also, Design the parameters in excel sheet.
Motor:
considering
18.3kW is the minimum amount of power rating required in the motor.
How much torque the motor can produce is also a very important characteristic, hence before choosing a motor it is also necessary to know the rated torque needed by the ATS to tow the aircraft:
T=FrGηg
where;
G = gear ratio of the transmission system -------------- Mototok's ATS' are known to have extremely low gear ratios (around G = 27) to achieve the kind of massive torque needed to tow an aircraft of the size of Boeing 737-400
r = radius of the wheels; given as 0.15m
Assuming the efficiency of the gear transmission is 95%:
T=17435.83*0.15/27*0.95=101.96Nm
ω=Pout/Tout
ω=18307.76/101.96=179.55rad/sec
The motor selected keeping the above criterias in mind is 3-phase AC induction motor H-MA-MTS series:
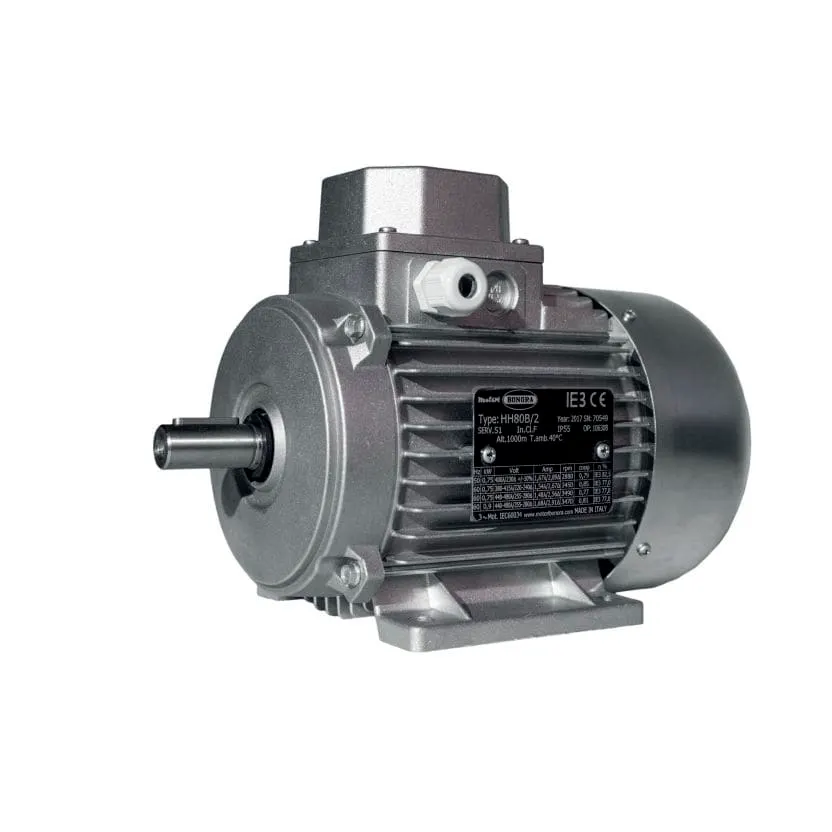
- Power rating of 22kW
- Rated torque of 120Nm
- Max rotational speed of 2940 RPM
- Voltage rating of 480V
The motor needs to generate an output power of 18.3kW. Assuming the motor is 90% efficient:
Pi=Po/ηm
Pi=18307.76/0.9=20,341.96W
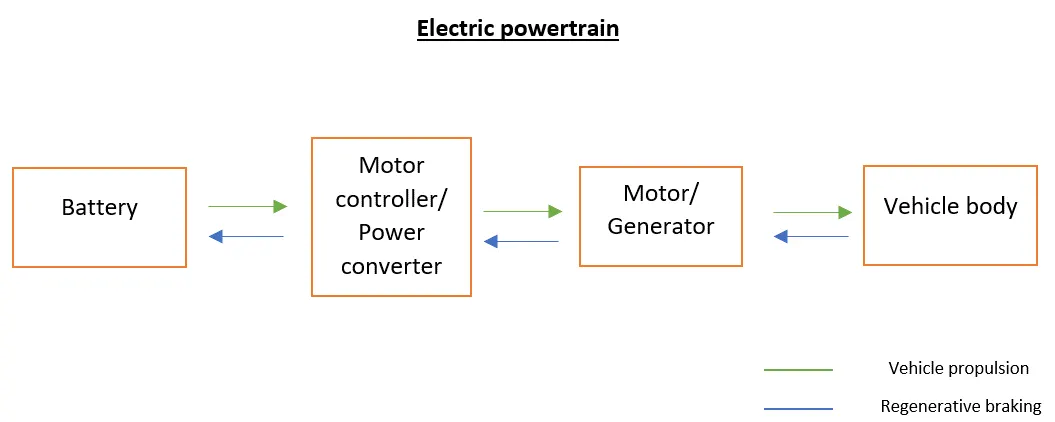
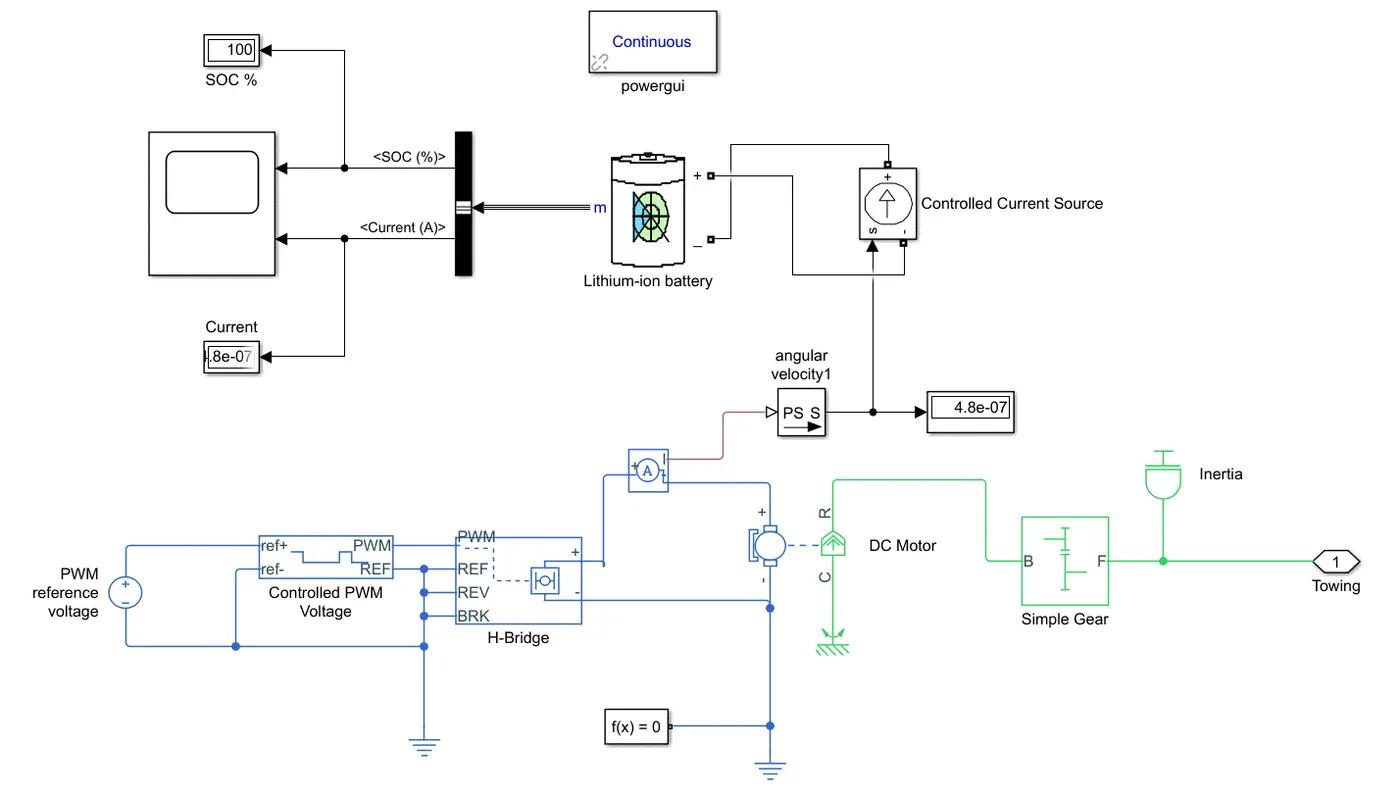
Above is a basic diagram of an electric powertrain. Motor properties have been determined, and the motor must receive power from the battery through a motor controller which is a power converter. The power converter has been assumed to be 100% efficient.
Battery:
Everything calculated so far has been done with the idea of towing the aircraft at 1.05m/s, which is the highest speed the towing machine can travel at. To move at this speed, full load current must be supplied by the battery to the motor.
Full load current (Ii">Ii) = Pi/sqrt.3*Vmrated*PF
where;
PF = power factor; generally ranging between 0.85 - 0.9 for full load
Vmrated = 480V (as given in the motor specification)
Ii=20341.96/sqrt(3)*480*0.87=28.12A
Now that Ii">Ii is known, voltage of the battery Vbat">Vbat can be calculated:
Vbat=Pi/Ii
Vbat=20341.96/28.12=723.40V
Vo=Vbat⋅d
where;
d = duty cycle
Since the motor rating is 480V, Vo">Vo cannot exceed 480V, especially since the power converter is assumed to be 100% efficient. Thus:
d=Vo/Vbat=480/723.4=0.6635 --------------- duty cycle range from 0 - 0.6635 to control speed of ATS from zero to high
Energy requirement of the battery:
E=Pi⋅t
Assuming the total time the battery needs to discharge its energy to the power converter and thus to the motor is 60 seconds (including the 20 seconds of towing at top speed of 1.05m/s):
E=20341.96*60=1,220,517.6J
= 1,220,517.6/1000*3600=0.339kWh ------------------ this is the minimal rating for the battery
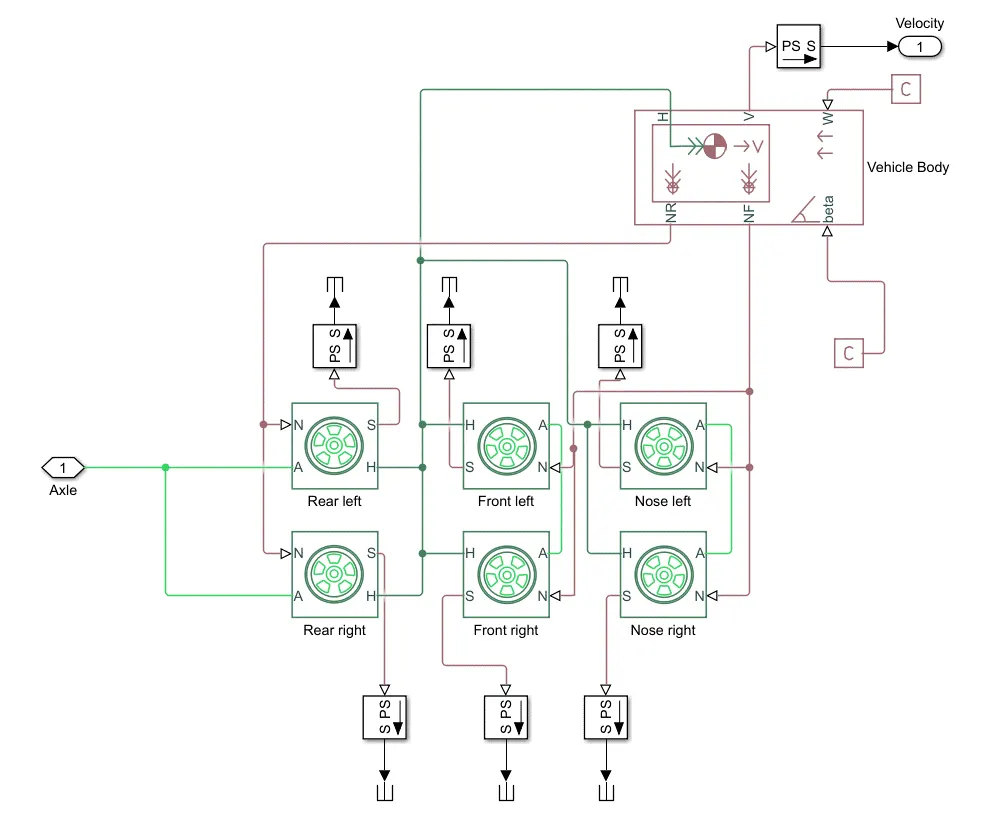
SIMULATED MODEL: A full model has been simulated to present the electric powertrain of the chosen Mototok 7500NG towing a Boeing 737-400. All the above calculated parameters (sourced from actual data) and stated assumptions have been inputted to evaluate the performance of the system.
MOTOTOK 7500NG SUBSYSTEM:
BOEING 737-400 VEHICLE BODY SUBSYSTEM:
OUTPUT:
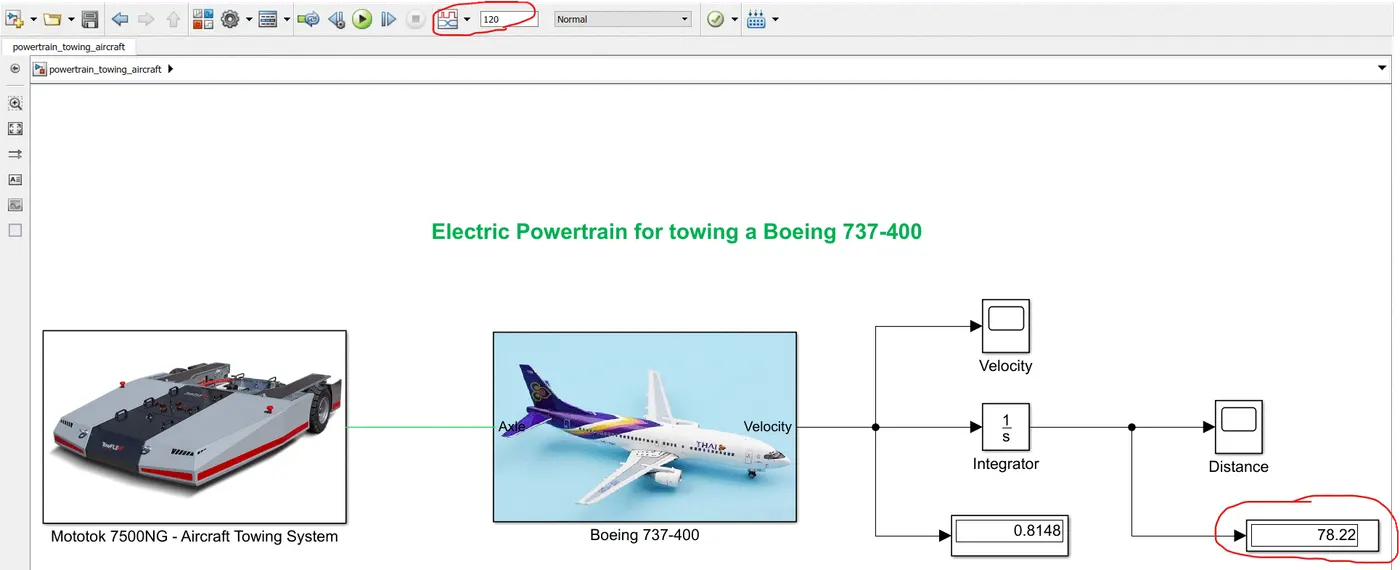
- In 120 seconds, the ATS is able to tow the aircraft for 78.22m
DISTANCE TRAVELLED:
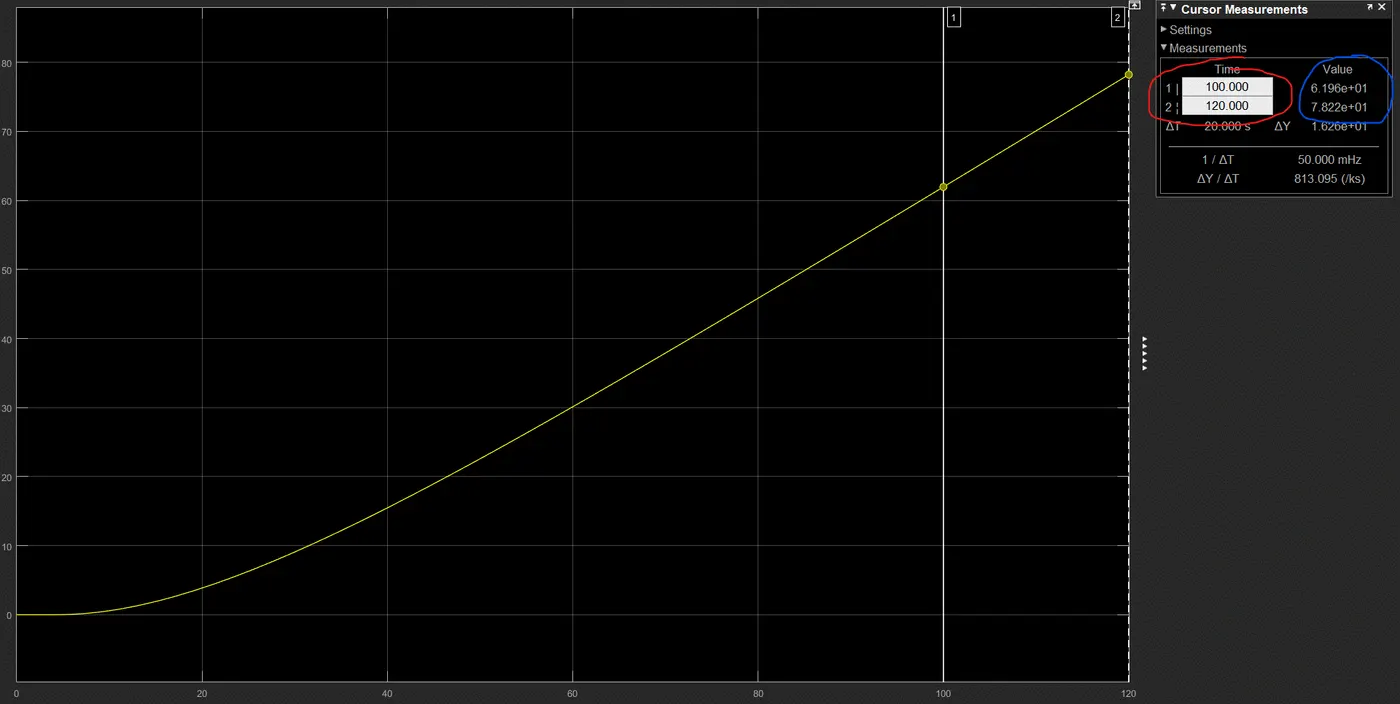
- Since the calculations done in this project are for 20 seconds of towing at top speed, the above graph showcases the distance travelled in the final 20 seconds of the simulation, which happens at basically the top speed the ATS can travel at. In the final 20 seconds, the ATS is able to move the aircraft by 16.22m, giving a speed of about 0.81m/s. According to ATS data, it can travel at a top speed of 1.05m/s, which is not too far from our results here and is fairly accurate.
STATE OF CHARGE:
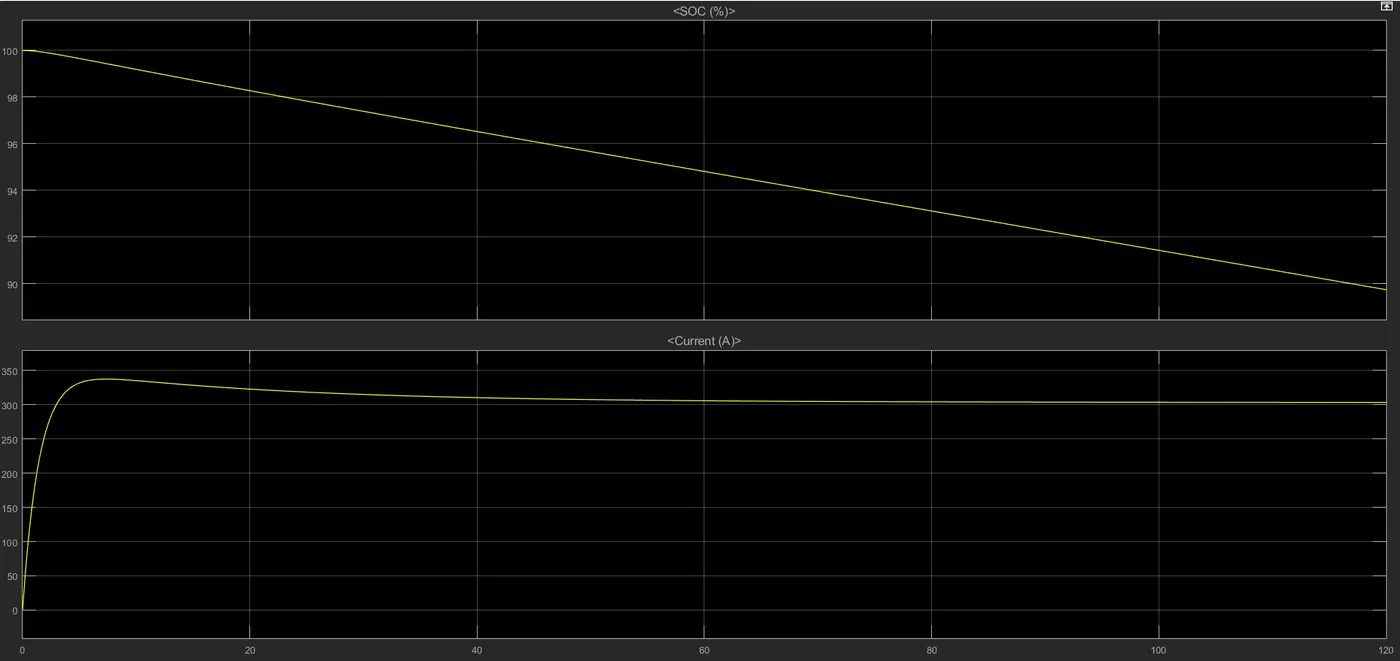
- In the 120 seconds of towing, the battery has depleted from 100 to 90%
TOTAL TOWING DISTANCE:
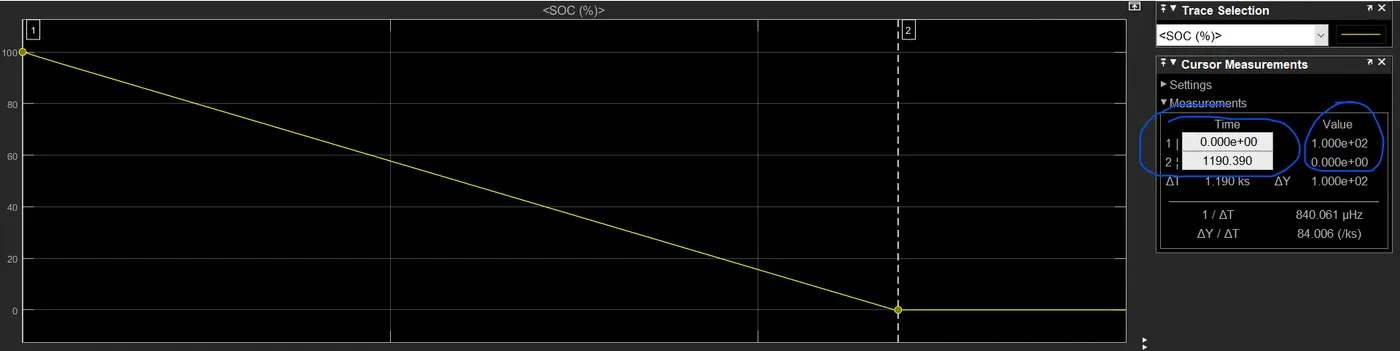
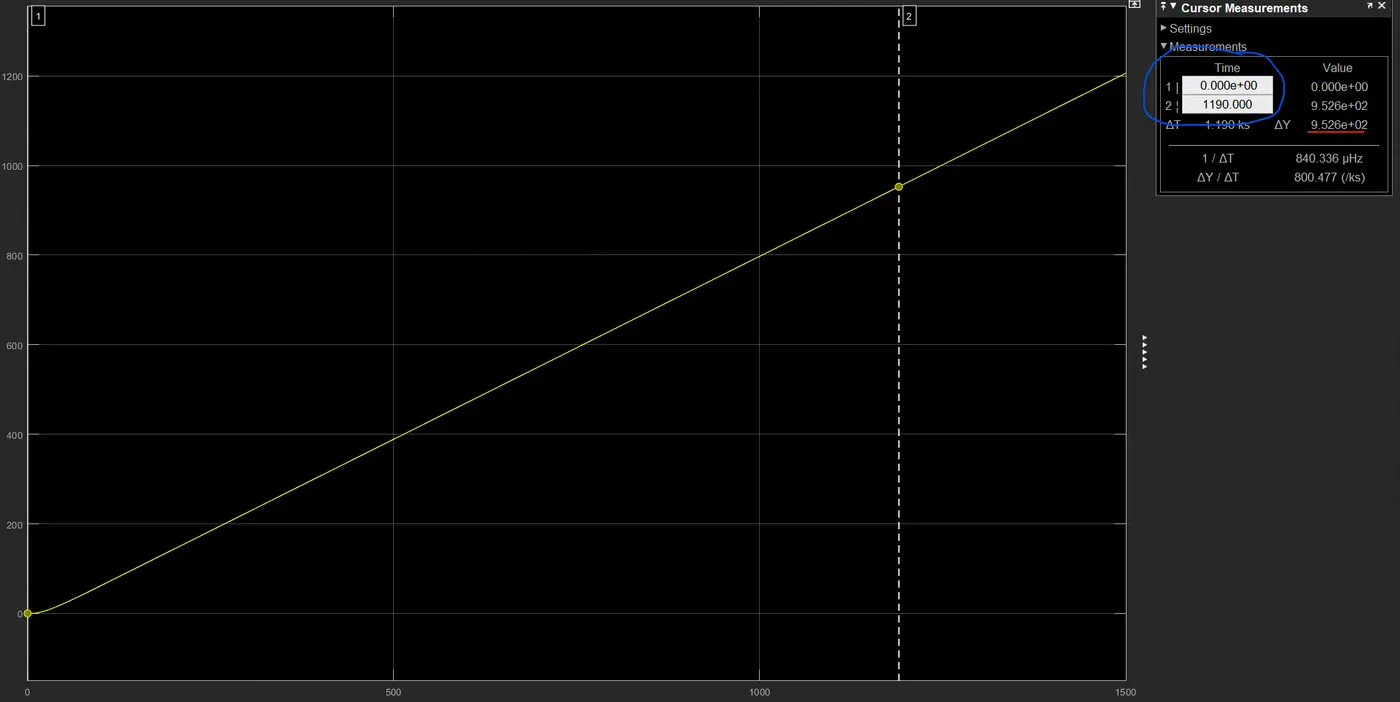
- The current powertrain is capable of towing the aircraft for about 1190 seconds, which is about 20 minutes before the battery is completely depleted to 0% and needs to be recharged.
- The total distance that this powertrain can tow the aircraft is about 950m in those 1190 seconds.
VELOCITY:
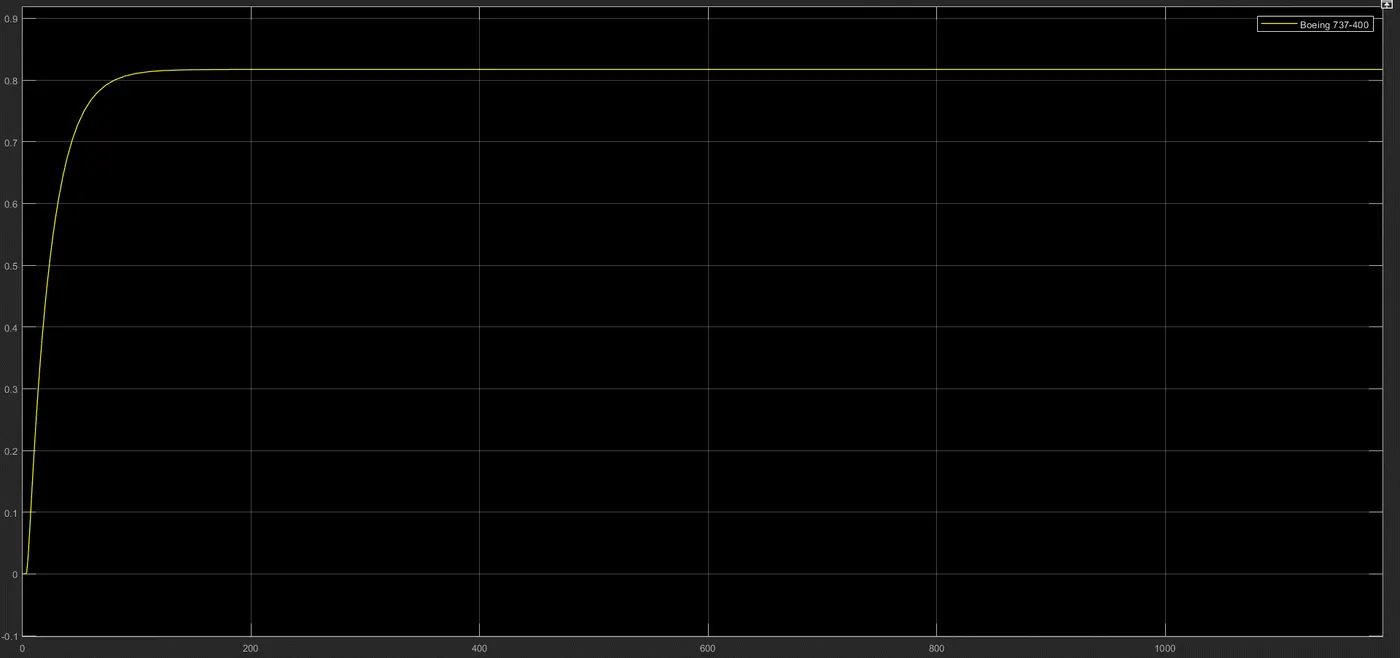
- The ATS reaches its top speed of about 0.82m/s at around 100 seconds, and travels constantly at that speed until the battery runs out.
Conclusion:
An electric powertrain is designed and simulated to tow a Boeing 737-400. Actual industrial data (barring the difference in motor used in the ATS) is used from verified sources and results obtained are quite close to actual data, making this quite an accurate model. The designed electric powertrain is capable of towing the craft for about 20 minutes. It reaches its top towing speed of 0.82m/s at about 100 seconds and is able to maintain that until the battery runs out. With a more powerful motor and battery system, this simulation can be further built upon to achieve even more detailed results with higher precision.