Project - Data Handling and Interpolation
Program:-
data=readtable('VI.xlsx');
t=-17.3:0.1:0.9;
x=sin(2*pi*30*t)+sin(2*pi*60*t);
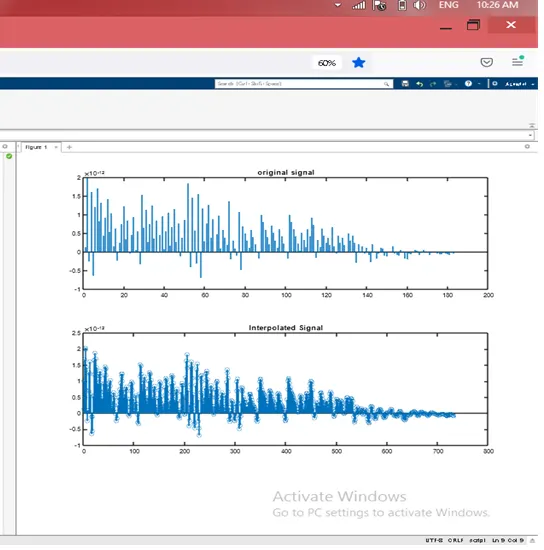
y=interp(x,4);
subplot(211);
stem(x);
title('original signal');
subplot(212);
stem(y);
title('Interpolated Signal');
here,
readtable....to read data from xcel file.
interp(x,4).....interp function with resprct to four factor
stem ....plots the data sequence