Project-1: Powertrain for aircraft in runways
1.list out the total weight of various types of aircrafts.
- The aircraft gross weight (also known as the all-up weight and abbreviated AUW) is the total aircraft weight at any moment during the flight or ground operation.[1][2][3]
- An aircraft's gross weight will decrease during a flight due to fuel and oil consumption. An aircraft's gross weight may also vary during a flight due to payload dropping or in-flight refuelling.
- At the moment of releasing its brakes, the gross weight of an aircraft is equal to its takeoff weight. During flight, an aircraft's gross weight is referred to as the en-route weight or in-flight weight.
The following image depicts takeoff weight components.
|
Type |
MTOW [kg] |
MLW [tons] |
|
640,000 |
591.7 |
|
|
589,670 |
||
|
575,000 |
394 |
|
|
447,700 |
346.091 |
|
|
443,613 |
306.175 |
|
|
412,770 |
295.742 |
|
|
Antonov An-124-100M |
405,060 |
330 |
|
396,900 |
295.742 |
|
|
381,000 |
288.417 |
|
|
377,840 |
285.700 |
|
|
377,840 |
260.320 |
|
|
371,950 |
240 |
|
|
367,400 |
256 |
|
|
347,800 |
260.816 |
|
|
351,800 |
251.29 |
|
|
347,450 |
223.168 |
|
|
340,200 |
265.300 |
|
|
308,000 |
233.5 |
|
|
299,370 |
237.683 |
|
|
297,550 |
213.00 |
|
|
276,700 |
190 |
|
|
273,300 |
185 |
|
|
270,000 |
175 |
|
|
270,000 |
195.04 |
|
|
256,280 |
183 |
|
|
254,000 |
192.777 |
|
|
254,000 |
201.849 |
|
|
253,500 |
181 |
|
|
250,000 |
175 |
|
|
242,000 |
185 |
|
|
242,000 |
180 |
|
|
231,300 |
166.92 |
|
|
228,000 |
172.365 |
|
|
211,400 |
||
|
208,000 |
175 |
|
|
204,000 |
158.758 |
|
|
192,000 |
140 |
|
|
187,000 |
136.08 |
|
|
185,000 |
111.1 |
|
|
163,000 |
138 |
|
|
159,000 |
136.078 |
|
|
157,000 |
124 |
|
|
152,000 |
151.9 |
|
|
151,000 |
97.5 |
|
|
151,000 |
112.1 |
|
|
147,000 |
||
|
142,000 |
123 |
|
|
141,000 |
122 |
|
|
140,000 |
||
|
125,000 |
||
|
124,000 |
101.6 |
|
|
117,000 |
86.3 |
|
|
116,000 |
89.9 |
|
|
106,000 |
79.5 |
|
|
104,000 |
79.5 |
|
|
104,000 |
80 |
|
|
104,000 |
87.5 |
|
|
87,500 |
||
|
85,000 |
66.36 |
|
|
85,000 |
71.35 |
|
|
84,000 |
70.1 |
|
|
Airbus A321-100[17] |
83,000 |
77.8 |
|
79,000 |
65.32 |
|
|
78,000 |
68.1 |
|
|
73,000 |
63.28 |
|
|
72,500 |
62.4 |
|
|
72,500 |
62.4 |
|
|
71,000 |
64.41 |
|
|
70,700 |
||
|
70,000 |
58.06 |
|
|
Airbus A320-100[17] |
68,000 |
66 |
|
68,000 |
54.9 |
|
|
68,000 |
||
|
67,000 |
||
|
66,000 |
54.66 |
|
|
65,000 |
57.61 |
|
|
65,000 |
||
|
64,000 |
62.5 |
|
|
63,000 |
51.7 |
|
|
60,000 |
49.9 |
|
|
59,000 |
50.80 |
|
|
59,000 |
57.5 |
|
|
55,000 |
47.174 |
|
|
55,000 |
||
|
54,000 |
||
|
50,000 |
46.265 |
|
|
50,000 |
||
|
48,600 |
||
|
48,500 |
||
|
48,000 |
43 |
|
|
46,000 |
||
|
46,000 |
39.95 |
|
|
44,000 |
||
|
42,000 |
36.74 |
|
|
39,000 |
||
|
37,500 |
32.8 |
|
|
36,500 |
33.345 |
|
|
36,000 |
32.8 |
|
|
33,000 |
30.39 |
|
|
33,000 |
||
|
30,400 |
||
|
28,000 |
28.01 |
|
|
23,000 |
21.319 |
|
|
22,800 |
22.35 |
|
|
22,800 |
21.5 |
|
|
22,000 |
19.3 |
|
|
18,600 |
18.3 |
|
|
13,150 |
12.930 |
|
|
11,500 |
11.25 |
|
|
10,890 |
10.570 |
|
|
9,752 |
8.709 |
|
|
8,300 |
7.665 |
|
|
8,150 |
7.65 |
|
|
7,765 |
7.605 |
|
|
7,761 |
7.103 |
|
|
7,000 |
||
|
4,800 |
4.43 |
Maximum taxi weight (MTW)
The maximum taxi weight (MTW) (also known as the Maximum Ramp Weight (MRW) is the maximum weight authorized for maneuvering (taxiing or towing) an aircraft on the ground as limited by aircraft strength and airworthiness requirements. It includes the weight of taxi and run-up fuel for the engines and the APU (Auxillary Power Unit).
It is greater than the maximum takeoff weight due to the fuel that will be burned during the taxi and runup operations.
The difference between the maximum taxi/ramp weight and the maximum take-off weight (maximum taxi fuel allowance) depends on the size of the aircraft, the number of engines, APU operation, and engines/APU fuel consumption, and is typically assumed for 10 to 15 minutes allowance of taxi and run-up operations.
Maximum takeoff weight (MTOW)
The maximum takeoff weight (also known as the maximum brake-release weight) is the maximum weight authorised at brake release for takeoff, or at the start of the takeoff roll.
The maximum takeoff weight is always less than the maximum taxi/ramp weight to allow for fuel burned during taxi by the engines and the APU.
In operation, the maximum weight for takeoff may be limited to values less than the maximum takeoff weight due to aircraft performance, environmental conditions, airfield characteristics (takeoff field length, altitude), maximum tire speed and brake energy, obstacle clearances, and/or en route and landing weight requirements.
Maximum landing weight (MLW)
The maximum weight authorised for normal landing of an aircraft.The MLW must not exceed the MTOW.
The operation landing weight may be limited to a weight lower than the Maximum Landing Weight by the most restrictive of the following requirements:
- Aircraft performance requirements for a given altitude and temperature:landing field length requirements,approach and landing climb requirements
- Noise requirements
If the flight has been of short duration, fuel may have to be jettisoned to reduce the landing weight.
Overweight landings require a structural inspection or evaluation of the touch-down loads before the next aircraft operation.
Maximum zero-fuel weight (MZFW)
The maximum permissible weight of the aircraft less all usable fuel and other specified usable agents (engine injection fluid, and other consumable propulsion agents). It is the maximum weight permitted before usable fuel and other specified usable fluids are loaded in specified sections of the airplane.
2. Is there any difference between ground speed and air speed?
- Airspeed is the vector difference between the ground speed and the wind speed. On a perfectly still day, the airspeed is equal to the ground speed. But if the wind is blowing in the same direction that the aircraft is moving, the airspeed will be less than the ground speed.
- As talked about briefly in how fast passenger airplanes fly, generally speaking, there are two different types of speed when talking about airplanes – ground speed and airspeed.
- While ground speed is the airplane’s speed relative to the surface of the Earth, airspeed – at least true airspeed – is its speed relative to the air it is flying in.
- Below, I will explain the two types of speed in more detail, as well as talk about the four types of airspeed that are commonly used.

Airspeed vs. Ground Speed:
As mentioned above, true airspeed is simply the speed at which an aircraft is moving relative to the air it is flying in. As such, it’s also the speed at which the air is flowing around the aircraft’s wings.
Ground speed, on the other hand, is the aircraft’s speed relative to the ground. One thing that should be noted here is that it’s its horizontal rather than vertical speed – an aircraft climbing completely vertically would have a ground speed of zero.
In other words, while airspeed is what determines whether there is enough airflow around an aircraft to make it fly, ground speed is what determines how fast an aircraft will get to its destination.
Wind’s Effect on Ground Speed:
The relationship between airspeed and ground speed is fairly simple. Ground speed is simply the sum of airspeed and wind speed.
If the aircraft is flying in the same direction as the wind is blowing, the aircraft experiences tailwind, and its ground speed is higher than its airspeed. On the other hand, if the wind is blowing against the direction the aircraft is traveling in, the aircraft experiences headwind, and its ground speed is lower than its airspeed.
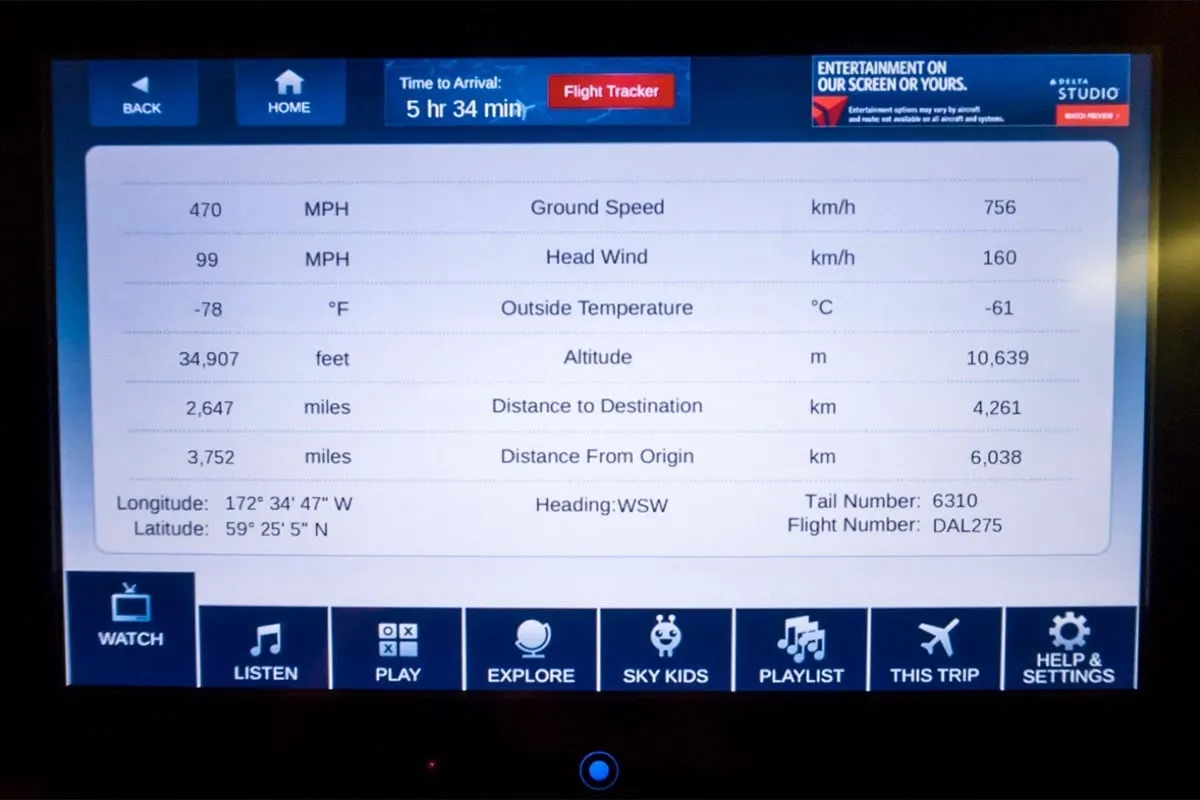
- To give you an actual example, imagine an aircraft that cruises at an airspeed of 500 miles per hour that has to cover a ground distance of 2,000 miles.
- If there is no wind at all, then both the aircraft’s airspeed and ground speed would be the same 500 miles per hour, and the aircraft would reach its destination in four hours.
- If there was a 100 miles per hour headwind – wind blowing against the aircraft’s direction of travel – the aircraft would still be traveling at an airspeed of 500 miles per hour. However, its ground speed would be just 400 miles per hour (100 miles per hour slower than its airspeed). And as such, it would take the aircraft five hours to reach its destinations.
- Finally, if there was a 100 miles per hour tailwind – wind blowing in the same direction as the aircraft’s travel – the aircraft would still be traveling at an airspeed of 500 miles per hour, but its ground speed would be 100 miles faster. And, at 600 miles an hour, the aircraft would reach its destination in just three hours and twenty minutes.
- The above is the reason why some flights go “out of their way” to avoid headwinds or catch tailwinds. And, why some flights might appear to be traveling at “supersonic speeds,” even though their airspeed – the speed that would actually matter in determining whether or not the flight truly is supersonic – is subsonic.
The Three Types of Airspeed
When I talked about airspeed earlier in this article, I was talking about true airspeed. However, pilots commonly use three different types of airspeed: indicated airspeed, calibrated airspeed, and true airspeed.
Indicated airspeed is an airspeed that is calculated directly off an aircraft’s pitot-static system. It’s the calculated off the aircraft’s dynamic pressure – the difference between its total pressure and static pressure.
The dynamic pressure depends not only on the aircraft’s speed, but also on the density of the air it is flying in. As such, the higher the aircraft flies – and the lower the air density as a result – the bigger the difference between indicated and true airspeed is.
Calibrated airspeed is indicated airspeed adjusted for a variety of errors.
Just as an example, one of the things it’s adjusted for is the flap position. The reason for that is that at different flap positions, air flows differently around the pitot-static system and affects the indicated airspeed readings.
True airspeed is, as has been mentioned numerous times in this article, the actual speed at which an aircraft is moving relative to the air it is traveling in. It’s calibrated airspeed adjusted for the the exact conditions (altitude, air temperature, etc.) that the aircraft is flying in.
3. Why is it not recommended to use aircraft engine power to move it on the ground at Airport:-
For movement on the ground the aircraft uses it own engine power, which is called taxing.
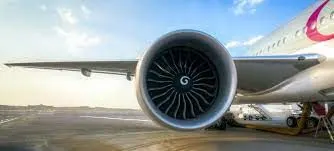
Although many aircrafts are capable of moving in backward using reverse thrust, as result the jet blast or prop wash might cause damage to the terminal building or equipment. Engine close to ground may also blow sand and debris forward and then suck them into the engine, causing damage to the engine. Therefore there are pushback trucks in the airport. A pushback truck lifts the front weel of the aircraft, their role in most airports is to move the aircraft away from the parking spot on to the taxiways, which is called towing.

i) Effectively a loss of control can happen, especially during high power engine running. Damage can occur to the aircraft itself, other aircraft nearby or to airside structures. ii) There is a risk of injury to ground support personnel who may be in relatively close proximity to the aircraft. iii) It is easier for truck driver to see the surroundings better than the pilot sitting in the cockpit with limited window. The pushback driver knows the airport better than the pilot. iv) It also saves fuel. virgin Atlantic had proposed a new system in which pushback truck will move the aircraft all the way to runway to save fuel and reduce impact of environment. v) The plane engines are very loud. When more than one plane will add up their sound, than it will not be pleasent for passangers and others near airport.
4. How an aircraft is pushed to runway when its ready to take off?
In the parking areas, where taxing the aircraft is not practical or is unsafe, such as moving aircraft in and out of mainteance hangars, or moving aircraft that are not under their own power or moving backward, then towing of aircraft is performed using the power of a specialized ground vehicle attached to or supporting the nose landing gear. The traditional method of allowing the ground vehicle to move an aircraft is to attach it to the aircraft nose landing gear by means of towbar.
As the pilot can't see what is behind the aircraft, steering is done by pushback tractor driver and depending on the aircraft type and airline procedure, a bypass pin may be temporarily installed into the nose gear to disconnect it from the aircraft's normal steering mechanism. Once the towing is completed, the towbar is disconnected and the aircraft can taxiing forward under its own power.
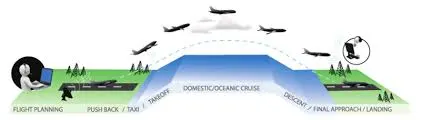
TAXIING>> Taxiing is the movement of an aircraft on the ground under its own power while on the suface. The aircraft always moves following the yellow lines, to avoid collision with the surrounding buildings, vehicle or other aircrafts. The taxiing motion has a speed limit. Before making turn the pilot reduces speed further to prevent tire skids just like other vehicles. The reason for taxing is to reach the vehicle into runway or from runway to terminal.
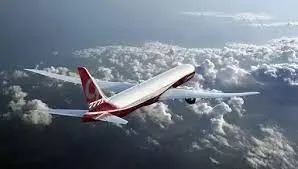
Following the taxiway aircraft reaches the runway. Takeoff is the phase of flight in which an aircraft goes through a transition from moving along the ground (taxiing) to flying in the air, usually starting on a runway. Usually the engines are run at full power during takeoff. Following the taxi motion, the aircraft stops at the starting line of the runway. Before takeoff, the engines, particularly piston engines, are routinely run up at high power to check for engine-related problems. This makes a considerable noise. When the pilot releases the brakes, the aircraft starts accelerating rapidly until the necessary speed for take-off is achieved.
5. Learn about take off power, tyre design, rolling resistance, tyre pressure, brake forces when landing.
Abstract:-
This paper describes airfield measurement of forces and moments that act on a landing gear wheel. For the measurement, a wheel force sensor was used. The sensor was designed and built based on strain gage technology and was embedded in the left landing gear wheel of a test aircraft. The sensor is capable of measuring simultaneously three perpendicular forces and three moments and sends data to a handheld device wirelessly. For the airfield tests, the sensor was installed on a PZL 104 Wilga 35A multipurpose aircraft. The aircraft was towed at a “marching man” speed and the measurements were performed at three driving modes: Free rolling, braking, and turning. The paper contains results obtained in the field measurements performed on a grassy runway of the Rzeszów Jasionka Aerodrome, Poland. Rolling resistance of aircraft tire, braking friction, as well as aligning moment were analyzed and discussed with respect to surface conditions.
Wheel Dynamometer System:-
The wheel dynamometer system used in the experiment consisted of a sensor, modified wheel and tire, wireless data transfer unit, and software. The sensor core was made of steel, and strain gages were used as sensing elements. The instrumentation amplifiers, which prepare the outgoing signals for data acquisition, were placed outside the sensor in a small box, together with a board of the microprocessor data analysis and transfer system. A schematic of the sensor, but without the electronics. This schematic also includes the orientation of forces and moments.
Grassy Airfield Conditions:-
Measurements of wheel forces and moments were performed on a grassy surface of the Rzeszów Jasionka aerodrome, located in southeast Poland. The measurements were carried out in the area adjacent to the runway, with the surface and soil conditions identical to those on the grassy runway. The height of the grass was approximately 10 cm each time of the measurements.
The days in the autumn and spring months were selected, when there is a high probability of increasing humidity and lowering the traction properties of the grassland due to the influence of weather conditions (rainfall, low temperature, low sunshine)
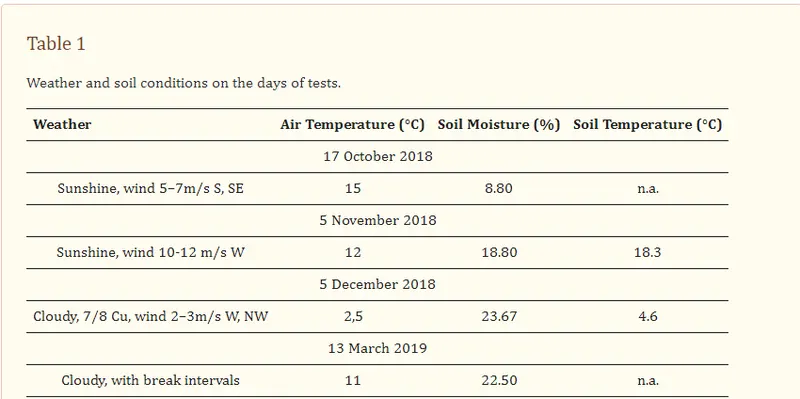
Before the test runs, we also measured soil moisture using a handheld TDR moisture meter. TDR is an acronym for time-domain reflectometry, and this is a technique that utilizes the phenomenon of different electrical permeability of porous, three-phase media, such as soil. The TDR meter is very easy to use. Measurement requires simply inserting test electrodes into soil and the instrument quickly gives results, which are collected in shows the test engineer performing soil moisture measurement on the grass field. See also the reference by Pytka et al. for more details on the use the TDR sensor in terramechanics studies
Field Procedures:-
Since the sensor system has not been certified for flight tests yet, we could only manage ground tests. In this study, it was aimed to determine wheel forces and moments acting on the aircraft’s wheel at low speed of taxiing over the grassy runway. We used an all-terrain vehicle (ATV) as a tractor vehicle and the aircraft was connected to this vehicle by means of cables. As mentioned earlier, four adult persons were in the test aircraft during all tests. An approximate speed of taxiing was 5 km/h. The aircraft performed the following maneuvers:
-
Accelerating from stop to the taxi speed;
-
Taxiing with a constant speed (about 20–30 m);
-
Turning left or right;
-
Braking to a full stop or to block the wheels.
A General Presentation of the Results:-
Time courses of the vertical FZ and horizontal FX forces that act on the landing gear wheel. The FZ shows almost constant values with low fluctuations, probably caused by vertical vibrations of the entire aircraft rolling over the grassy surface, and those values are close to the aircraft weight component on the wheel. The horizontal force FX exhibits negative values since the sensor has a defined orientation and a force of the direction backwards is indicated as negative. Moreover, the course of the horizontal force FX reveals effect of wheel function modes: Free rolling (the first second of the course), acceleration increasing of the force’s values (between 1 and approximately 4 s of the course), braking to a full stop (5–9 s), and, again, acceleration (from approximately 9 s of the course). The peak maximum value of the horizontal force FX reaches 2.7 kN, but the average value is much lower.
In the next sections, an analysis of the measured forces and moments is presented in order to determine coefficients that describe wheel–surface interactions, which are of importance for the analysis and modeling of airfield performance of an aircraft.
Rolling Resistance Coefficient:-
Rolling resistance is a property of the tire–surface system and depends on many factors. In automotive technology, rolling resistance is determined for a tire rolling on a drum test stand and its coefficient takes essentially constant values, on the order of 0.010–0.012. In the case of a tire interacting with a deformable surface, such as grassy surface, rolling resistance is difficult to determine, mainly due to the changing conditions of the surface, which was mentioned in the introduction. In addition, the values of the rolling resistance coefficient of the tire–grass surface system can vary by as much as an order of magnitude, taking into account, for example, changes in soil moisture. The presence of vegetation (grass, roots), as well as the size and mass of green parts of vegetation, are also significant.
The rolling resistance coefficient, kRR, is defined as the ratio of horizontal force during free turning to vertical force
The exemplary value of the kRR coefficient was determined to be 0.275, which in comparison to the aforementioned value for a car tire on a paved road is almost 25 times [25]. This is the effect of a soft surface and a low-pressure aviation tire. The impact of weather conditions on the determined values of the kRR coefficient will be presented in the next section.
3.3. Braking Friction Coefficient:-
The braking friction coefficient μ is another important factor. It determines the course of the braking process and the landing distance of the aircraft. In the case of the tire–paved system (asphalt, concrete), the friction coefficient usually reaches values between 0.6–0.9. For unpaved surfaces such as grass turf, the friction coefficient is usually lower and may be 0.1–0.5. Factors affecting the μ value are grass length and humidity: The longer the grass and the more water it contains, the lower the friction coefficient. By definition, the friction coefficient is determined on the basis of the following relationship:
Aligning Moment:-
When driving on a curved track, the road wheel moves in such a way that the longitudinal axis of the wheel is deflected from the direction of the instantaneous speed vector by an angle, called the side slip angle. The reaction of a pneumatic tire to side slip is to generate a moment that tends to reduce this angle. This moment is called the stabilizing or aligning moment.
The sensor used in the tests directly measures the value of the aligning moment, it is the moment marked as MZ. shows the MZ course recorded during one of the turning maneuvers. The importance of the MZ moment is revealed during taxiing, especially at high speed. The higher the MZ value, the easier it is to maintain a straight direction, while too high a stabilizing moment can cause significant steering forces when cornering, especially when taxiing at low speed.
Effect of Weather Condidtions:-
As already mentioned, the study was carried out over four day—in October, November, December, and March. The purpose of such a research program was to check to what extent the worsening deterioration of weather conditions, in terms of lowering the external temperature and increasing humidity of air and soil, affects the measured values of forces and moments, as well as the resulting coefficients. Based on the measurements carried out, mean values of repetitions (minimum of five repetitions for each day) of individual measurements were determined. A collection of final data in the form of bar charts is presented in where average values of rolling resistance coefficient, kRR, friction coefficient, μ, and stabilizing moment, MZ, are shown for four days, representative for particular weather periods.
The rolling resistance coefficient increases, and this is a significant increase. The explanation for that is quite obvious: In autumn, late autumn, winter, and early spring, there is a gradual increase in humidity of both air and soil, which causes increasing deformation of the surface and, as a result, an increase in rolling resistance. Although we did not construct any relationship between the rolling resistance coefficient and soil moisture these parameters correspond well to each other.
The second term, braking friction coefficient shows an inverse relationship, i.e., it decreases during the period considered. In this case, the cause is similar, although the increasing humidity works slightly differently, namely, lower grip (=more slipperiness), especially in the case of grass-covered surfaces. A slight increase in the braking friction coefficient was observed for the measurement carried out in March. Perhaps the reason was a stronger solar operation, which dried the surface, especially grass.
The last of the parameters analyzed, the aligning moment, shows an interesting tendency . No significant impact of the weather period is observed during the months October–November, while a significant decrease in the MZ moment value in December was recorded. In March, the MZ value increased significantly compared to the December measurements.
Conclusions:-
An airfield experiment was conducted in order to measure landing gear wheel forces and moments. A five-element wheel force sensor was used to measure FX and FZ forces and MX, MY, and MZ moments acting on an aircraft wheel during a low-speed taxiing. The measurement was conducted using the PZL 104 Wilga 35A as a test aircraft. The wheel force sensor was installed on the left landing gear in place of the wheel. Forces and moments were measured on a grassy surface of the Rzeszów Jasionka aerodrome, four times on days of autumn and spring months. The results show changes in wheel force and moment values during various maneuvers: Acceleration, turning left–right, and deceleration (braking).
A significant influence of weather conditions on the values of determined coefficients kRR and μ, as well as on the aligning moment MZ, was noted. The rolling resistance coefficient increased during the considered weather period. However, the friction coefficient decreased, as did the stabilizing moment. The explanation for these trends is the increase in air and soil humidity, which translates into increased soil deformability and reduced adhesion.
Part B:
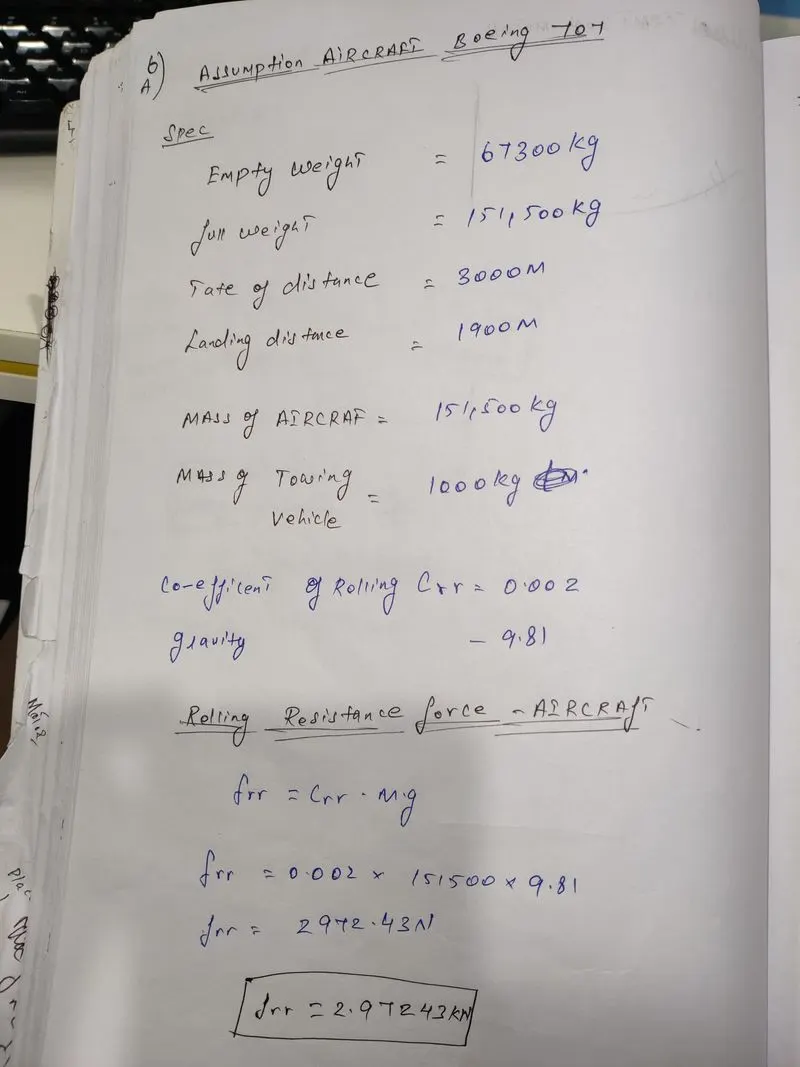
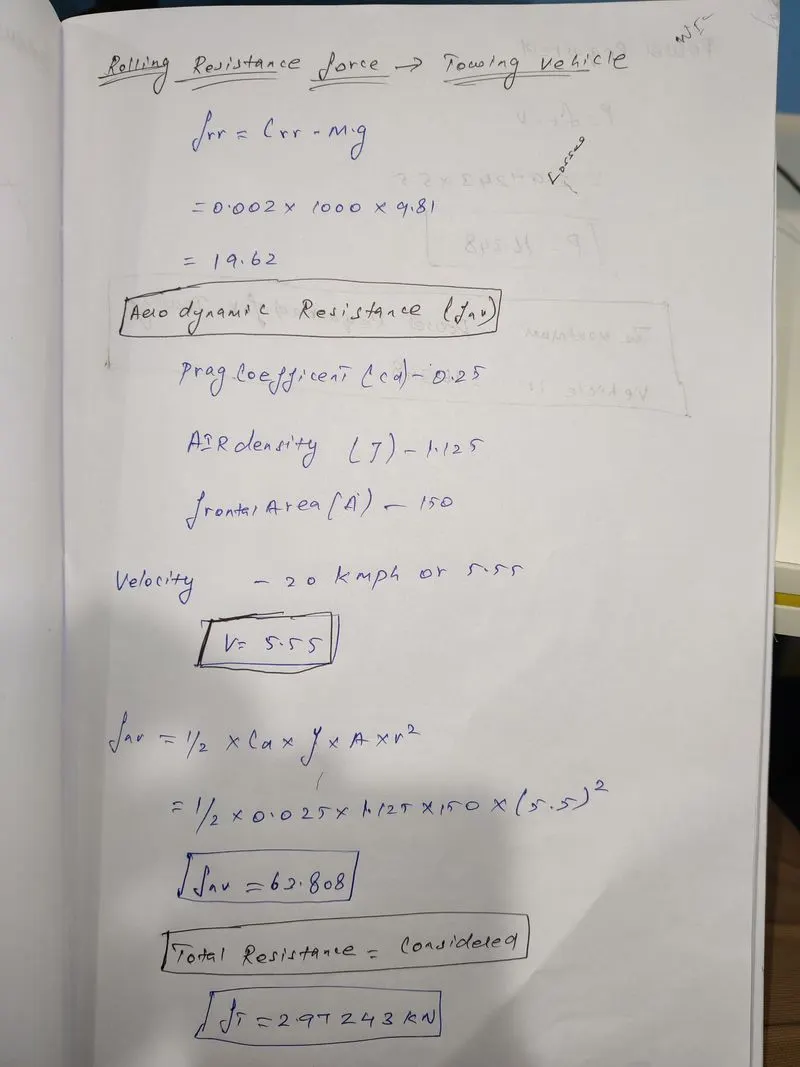
6. A. With necessary assumptions, calculate the force and power required to push / pull an aircraft by a towing vehicle.
B. Develop the model for the calculated force and power using Simulink.
With necessary assumptions, calculate the force and power required to push / pull an aircraft by a towing vehicle.
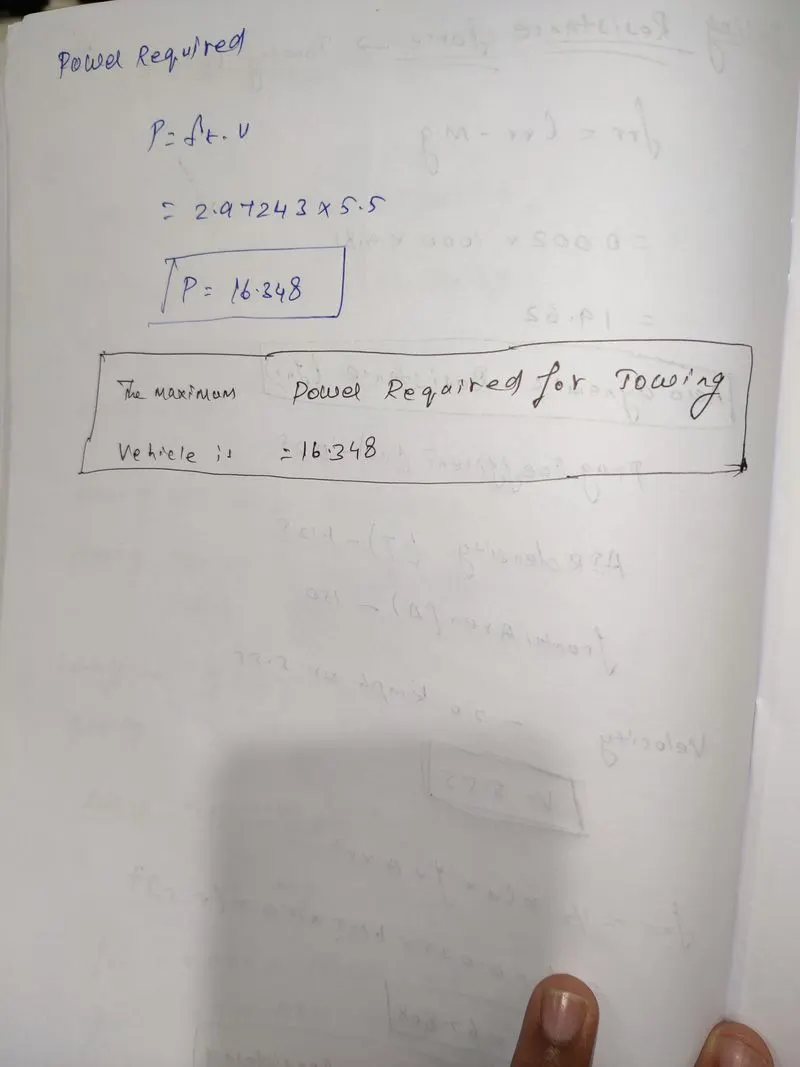
B. Develop the model for the calculated force and power using Simulink.
With necessary assumptions, calculate the force and power required to push / pull an aircraft by a towing vehicle.
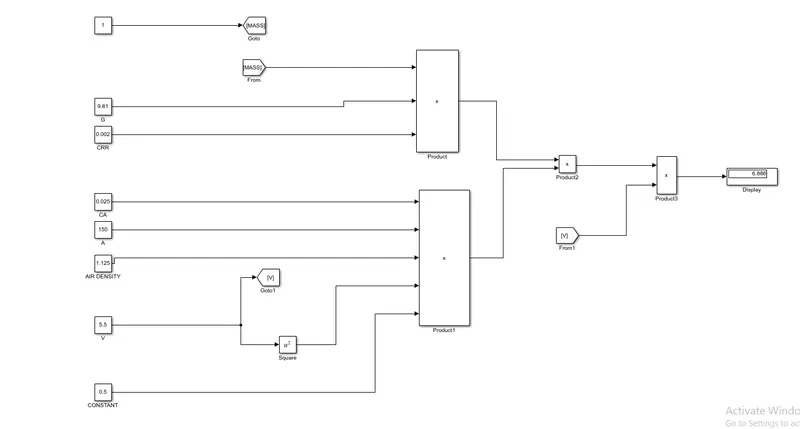
Explaination:
In order to understand the above simulink model we do reverse engineering
• For calculating power we have to multiply both total force(F) and velocity in m/sec for this we have used 'product' block (P-FV).
• For calculating the Total Force(F) we have added both Frr & Fd by using 'Surn' block as shown in the above figure
• To find the value of rolling resistance (Frr) we used product to multiply the values Crr., Total mass(m) & gravity (g) which are to be entered in the 'Constant block.
. Similarly for calculating Drag force(Fd) we have to multiply the velocity in m/sec.Drag coefficient, Frontal area of aircraft(A) and a constant value 0.5 which are to be entered in constant block.
• In order to convert velocity in Kmph to m/sec we have multiplied it with 5/18.
QUESTION:7
A. Design an electric powertrain with type of motor, it’s power rating, and energy requirement to fulfill aircraft towing application in Simulink. Estimate the duty cycle range to control the aircraft speed from zero to highest. Make all required assumptions. Prepare a table of assumed parameters. Draw a block diagram of powertrain.
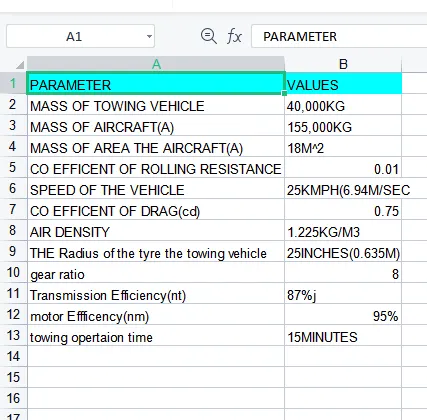
B. Also, Design the parameters in excel sheet.
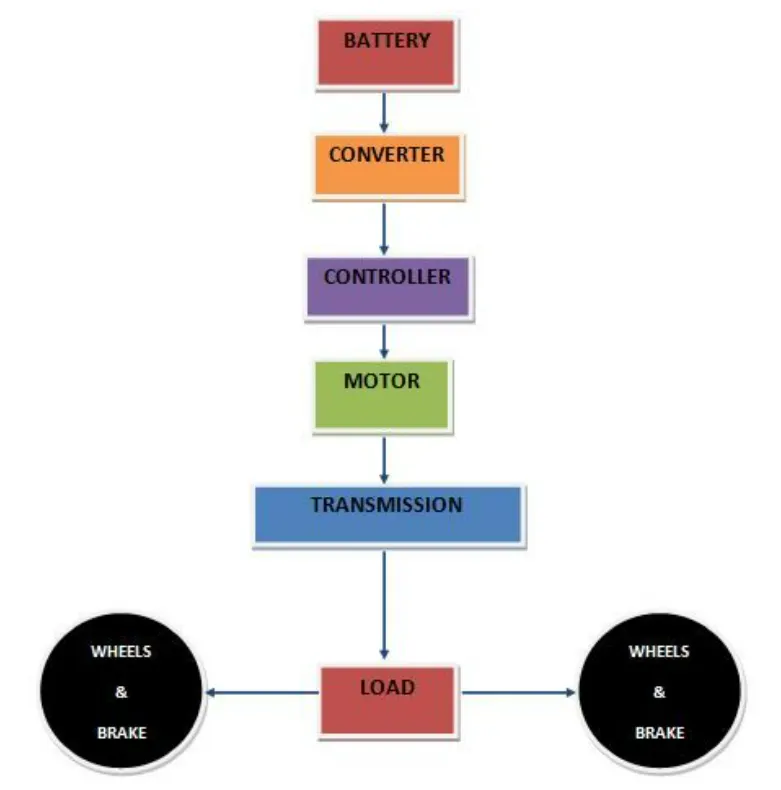
Based on the calculations done in 6A.
Force required to push/pull the aircraft =19.508 KN
Power required =135.478 kw
Let us assume,
The Radius of the Tyre for the Tug - 25inches =0.635m
Gear ratio=8
Transmission Effeciency (nt) =87%
Motor Efficiency (nm)=95%
then,
Torque required for the wheels (Tw)=Total Force *Radius in meters
=19.508 *0.635
=12.387KNm
Motor Torque-Wheel torque/(Gear ratio'nt)
=12.387/(8 0.87)
=1.778KNm
For nm =95%. The required motor Torque (Tm)= 1.778/0.95 =1.871 kNm
Similarly. The total power required by the motor considering all the efficiencies (Pt) = 135.478/(0.87*0.95)=163.917Kw
Let us assume the towing operation was done for a 15 minutes (0.25Hrs) duration.
Then, Total Energy consumed = 163.917* 0.25=40.98 KWh
If we consider the battery capacity=220 kw is used by the towing vehicle then. The duty cycle range to control the speed from O to max speed (3m/s) is given as
Duty Cycle (d)= (Required Power)/ (Rated power)= 163.917/220 =0.75
Therefore the controller will be able to provide a duty cycle ranging from 0 to 75% in order to control the towing speed.
Simulink Diagram of powertrain:
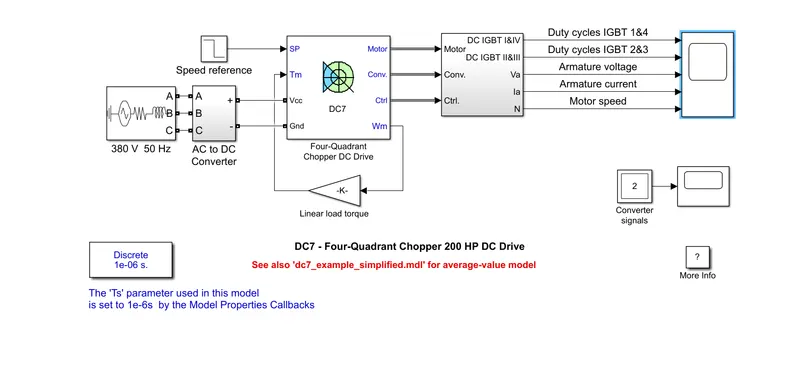
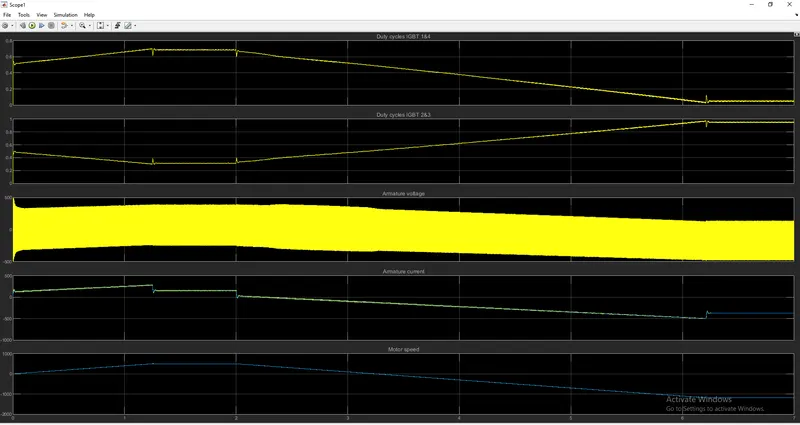
RESULT:-
B. Designing the parameters in excel sheet.