Project-1: Powertrain for aircraft in runways
AIM:
Part A:
- Search and list out the total weight of various types of aircrafts.
- Is there any difference between ground speed and airspeed?
- Why is it not recommended to use aircraft engine power to move it on the ground at Airport?
- How an aircraft is pushed to runway when its ready to take off?
- Learn about take-off power, tire design, rolling resistance, tire pressure, and brake forces when landing.
Part B:
- A. With necessary assumptions, calculate the force and power required to push/pull an aircraft by a towing vehicle.
- Develop the model for the calculated force and power using Simulink.
- A. Design an electric powertrain with the type of motor, its power rating, and energy requirement to fulfill aircraft towing applications in Simulink. Estimate the duty cycle range to control the aircraft speed from zero to highest. Make all required assumptions. Prepare a table of assumed parameters. Draw a block diagram of the powertrain.
(Hint: DC7 Block)
- Also, Design the parameters in an excel sheet.
Solution:
Case 1: Search and list out the total weight of various types of aircrafts.
- Many factors lead to the efficient and safe operation of aircraft. Among these vital factors are proper weight and balance control.
- The Maximum Allowable weight for an Aircraft is determined by design considerations. the manufacturer provides the aircraft operator with the empty weight of the aircraft and the location of its empty weight center of gravity (EWCG) at the time the certified aircraft leaves the factory.
- However, the maximum operational weight may be less than the maximum allowable weight due to such considerations as high-density altitude or high-drag field conditions caused by wet grass or water on the runway. The maximum operational weight may also be limited by the departure or arrival airport’s runway length.
EFFECTS OF WEIGHT:
Some of the problems caused by overloading an aircraft are:
- The aircraft will need a higher takeoff speed, which results in a longer takeoff run.
- Both the rate and angle of climb will be reduced.
- The service ceiling will be lowered.
- The cruising speed will be reduced.
- The cruising range will be shortened.
- Maneuverability will be decreased.
- A longer landing roll will be required because the landing speed will be higher.
- Excessive loads will be imposed on the structure, especially the landing gear.
AIRCRAFT GROSS WEIGHT
- The Aircraft gross weight is the total aircraft weight at any moment during the flight or ground operation.
- The aircraft's gross weight decreases during the flight due to fuel and oil consumption. The aircraft's gross weight may also vary during the flight due to payload dropping or in-flight refueling.
MANUFACTURER’S EMPTY WEIGHT (MEW)
- Let’s start with the aircraft itself. An aircraft “as is” includes:
- Airframe structure with all moving mechanical parts (fuselage, wings, flaps, gear, rudder, nacelle …)
- Power generation system (APU, main engines, power plant…)
- Systems (electrical, hydraulics, pneumatics, fuel flow system, instrument, navigation, air conditioning, anti-ice, fixed furnishing)
- Fixed equipment and services are considered an integral part of the aircraft
- Fixed ballast
- Closed system fluids
- Unused fuel only for small aircraft
- All these items above are from the manufacturer's Empty Weight (MEW).
- This weight does not include:
- Fuel
- Oil, potable water
- Payload (Cargo, passenger, luggage)
Removable equipment.
All that time, you should have calculated your total fuel for this flight.
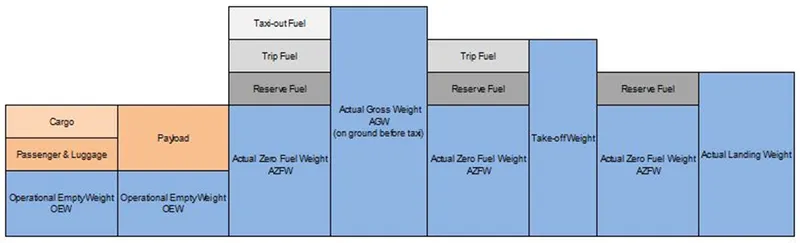
The actual gross weight is the weight of aircraft ready for departure at the gate before push-back and start-up.
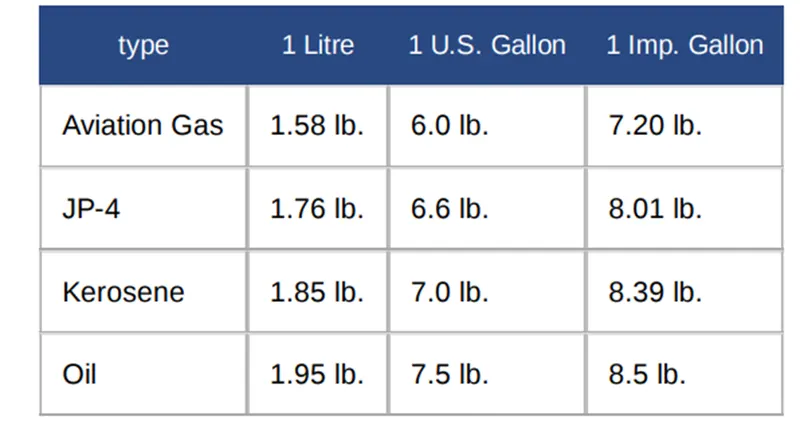
Note: 1kg = 2.20462262185 lb(s)
The total fuel shall include:
Taxi-out fuel (at departure airfield) Trip fuel Holding Re-routing expectation regulation needs depending on your route arrival airfield fuel to join alternate airfield
taxi-in fuel at the destination,
final reserve customer-specific installations or operator items
OPERATIONAL EMPTY WEIGHT (OEW)
The MEW and the operator's items are summed up to the Operational Empty Weight (OEW). the OEW is usually fixed for a specific aircraft and only gets changed during the maintenance or operational changes.

The operator’s items are:
fluids necessary for aircraft operation (engine oil and coolant, water, unusable fuel)
the water for galleys and lavatories
aircraft documentation
passenger seats (and the life vests)
galley structure
catering emergency equipment
aircraft crew and their luggage.
standard items necessary for full operation
ACTUAL ZERO FUEL WEIGHT (AZFW)
If we add the payload to the empty plane weight, we get the Actual Zero Fuel Weight (AZFW).

The payload includes:
The Passenger's weight (the standard weights used defined by ICAO respectively)
The passenger Luggage's Weight.
The cargo weight.

The assumed weights vary around some KG/lbs. Depending on several seats available on the Aircraft.
A Male passenger (inc. cabin luggage) weighs around 82 kg(181 lbs).
A Female passenger around 67 KG (148 lbs).
A Child around 50KG (110 lbs).
An infant 16 kg (35 lbs).
These are the Statistical value but otherwise one would need to weigh every single passenger during checking it to exact weight, Additional payload consists of baggage and cargo (such as small goods).
ACTUAL GROSS WEIGHT (AGW)
In Addition to the actual zero fuel weight, we add the fuel required for the flight and we get the Actual Gross Weight (AGW).

TAKE-OFF WEIGHT
Fuel burn during taxi operation to the departure runway reduces the gross weight. At the holding point, we have actual Take-off weight (ATOW) which is used for take-off performance calculation.
The gross weight varies during the flight. Fuel and oil consumption reduces the gross weight. additionally, it may vary during the flight due to inflight refueling or payload Dropping.

MAXIMUM DESIGN TAKEOFF WEIGHT (MDTOW)
The maximum takeoff weight (also known as the maximum brake-release weight) is the maximum weight authorized at brake release for takeoff or the start of the takeoff roll.
The maximum takeoff weight is always less than the maximum taxi/ramp weight to allow for fuel burned during taxi by the engines and the APU.
In operation, the maximum weight for takeoff may be limited to values less than the maximum takeoff weight due to aircraft performance, environmental conditions, airfield characteristics (takeoff field length, altitude), maximum tire speed, and brake
At this weight, the subsequent addition of fuel will not result in the aircraft design strength being exceeded. The weight difference between the MTOW and the MZFW may be utilized only for the addition of fuel.
LANDING WEIGHT
With the calculation of the fuel consumption during flight, we can calculate the EStimated Landing Weight (ELW) which is used for landing performance calculation t the destination.
approaching your destination you may use your current gross weight to determine the final approach of speed. the Gross weight is now the Actual Landing Weight. (ALW)

of course, before landing, you never land without any fuel in reserve. the regulations fixed fuel calculation for commercial air transportation including reserved fuel. 
GRAPHICAL SUMMARY OF OPERATIONAL WEIGHT
|
Type |
MTOW [kg] |
MLW [tonnes] |
TOR [m] |
LR [m] |
||
|
6,40,000 |
591.7 |
3500 |
Heavy |
Super |
||
|
5,89,670 |
3660 |
Heavy |
Super |
|||
|
Airbus A380-800[1][2][3] |
5,75,000 |
394 |
3100 |
1930 |
Super |
Super |
|
4,47,700 |
346.091 |
3100 |
1800 |
Heavy |
Heavy |
|
|
4,43,613 |
306.175 |
3100 |
Heavy |
Heavy |
||
|
4,12,770 |
295.742 |
3090 |
Heavy |
Heavy |
||
|
4,05,060 |
330 |
2520 |
900 |
Heavy |
Heavy |
|
|
3,96,900 |
295.742 |
3018 |
2179 |
Heavy |
Heavy |
|
|
Lockheed C-5 Galaxy[4][5][6] |
3,81,000 |
288.417 |
2530 |
1494 |
Heavy |
Heavy |
|
Boeing 747-200[7] |
3,77,840 |
285.7 |
3338 |
2109 |
Heavy |
Heavy |
|
Boeing 747-300[7] |
3,77,840 |
260.32 |
3222 |
1905 |
Heavy |
Heavy |
|
Airbus A340-500[8] |
3,71,950 |
240 |
3050 |
2010 |
Heavy |
Heavy |
|
Airbus A340-600[8] |
3,67,400 |
256 |
3100 |
2100 |
Heavy |
Heavy |
|
3,47,800 |
260.816 |
2830 |
Heavy |
Heavy |
||
|
3,52,000 |
251.5 |
3100 |
Heavy |
Heavy |
||
|
3,51,800 |
251.29 |
3100 |
Heavy |
Heavy |
||
|
3,47,450 |
223.168 |
3000 |
Heavy |
Heavy |
||
|
Boeing 747-100[7] |
3,40,200 |
265.3 |
Heavy |
Heavy |
||
|
3,08,000 |
233.5 |
Heavy |
Heavy |
|||
|
2,99,370 |
237.683 |
3380 |
Heavy |
Heavy |
||
|
2,97,550 |
213 |
3380 |
1550 |
Heavy |
Heavy |
|
|
Airbus A340-300[8][9] |
2,76,700 |
190 |
3000 |
1926 |
Heavy |
Heavy |
|
2,73,300 |
185 |
2990 |
1890 |
Heavy |
Heavy |
|
|
2,70,000 |
175 |
2670 |
1860 |
Heavy |
Heavy |
|
|
2,70,000 |
195.04 |
3115 |
2118 |
Heavy |
Heavy |
|
|
2,56,280 |
183 |
2990 |
1890 |
Heavy |
Heavy |
|
|
Boeing 787-9[10] |
2,54,000 |
192.777 |
2900 |
Heavy |
Heavy |
|
|
Boeing 787-10[10] |
2,54,000 |
201.849 |
Heavy |
Heavy |
||
|
Airbus A340-200[8][11] |
2,53,500 |
181 |
2990 |
Heavy |
Heavy |
|
|
2,50,000 |
175 |
2600 |
1980 |
Heavy |
Heavy |
|
|
Airbus A330-300[12][13] |
2,42,000 |
185 |
2500 |
1750 |
Heavy |
Heavy |
|
Airbus A330-200[12][13] |
2,42,000 |
180 |
2220 |
1750 |
Heavy |
Heavy |
|
2,31,300 |
166.92 |
2636 |
Heavy |
Heavy |
||
|
Boeing 787-8[10] |
2,28,000 |
172.365 |
3300 |
1695 |
Heavy |
Heavy |
|
2,11,400 |
Heavy |
Heavy |
||||
|
2,08,000 |
175 |
Heavy |
Heavy |
|||
|
2,04,000 |
158.758 |
3414 |
Heavy |
Heavy |
||
|
Airbus A300-600R[14] |
1,92,000 |
140 |
2385 |
1555 |
Heavy |
Heavy |
|
1,87,000 |
136.08 |
2713 |
1676 |
Heavy |
Heavy |
|
|
1,85,000 |
111.1 |
3440 |
2220 |
Heavy |
Heavy |
|
|
Airbus A300-600[14] |
1,63,000 |
138 |
2324 |
1536 |
Heavy |
Heavy |
|
1,59,000 |
136.078 |
2713 |
1676 |
Heavy |
Heavy |
|
|
Airbus A310-300[14] |
1,57,000 |
124 |
2290 |
1490 |
Heavy |
Heavy |
|
1,52,000 |
151.9 |
Heavy |
Heavy |
|||
|
Boeing 707-320B[15] |
1,51,000 |
97.5 |
Heavy |
Heavy |
||
|
Boeing 707-320C[15] |
1,51,000 |
112.1 |
Heavy |
Heavy |
||
|
1,47,000 |
Heavy |
Heavy |
||||
|
Airbus A310-200[14] |
1,42,000 |
123 |
1860 |
1480 |
Heavy |
Heavy |
|
1,41,000 |
122 |
980 |
770 |
Heavy |
Heavy |
|
|
1,40,000 |
Heavy |
Heavy |
||||
|
1,25,000 |
Medium |
Large |
||||
|
1,24,000 |
101.6 |
2550 |
1750 |
Medium |
Large |
|
|
Boeing 707-120B[15] |
1,17,000 |
86.3 |
Medium |
Large |
||
|
1,16,000 |
89.9 |
2347 |
1555 |
Medium |
Large |
|
|
Boeing 720B[16] |
1,06,000 |
79.5 |
Medium |
Large |
||
|
Boeing 720[16] |
1,04,000 |
79.5 |
Medium |
Large |
||
|
1,04,000 |
80 |
Medium |
Large |
|||
|
1,04,000 |
87.5 |
2250 |
Medium |
Large |
||
|
87,500 |
Medium |
Large |
||||
|
85,000 |
66.36 |
2500 |
1704 |
Medium |
Large |
|
|
85,000 |
71.35 |
2804 |
1829 |
Medium |
Large |
|
|
Boeing 727-200 Advanced[17] |
84,000 |
70.1 |
Medium |
Large |
||
|
Airbus A321-100[18] |
83,000 |
77.8 |
2200 |
1540 |
Medium |
Large |
|
79,000 |
65.32 |
2308 |
1634 |
Medium |
Large |
|
|
Boeing 727-200[17] |
78,000 |
68.1 |
Medium |
Large |
||
|
73,000 |
63.28 |
Medium |
Large |
|||
|
Boeing 727-100[17] |
72,500 |
62.4 |
Medium |
Large |
||
|
Boeing 727-100C[17] |
72,500 |
62.4 |
Medium |
Large |
||
|
71,000 |
64.41 |
2165 |
1520 |
Medium |
Large |
|
|
70,700 |
Medium |
Large |
||||
|
70,000 |
58.06 |
1921 |
1415 |
Medium |
Large |
|
|
Airbus A320-100[18] |
68,000 |
66 |
1955 |
1490 |
Medium |
Large |
|
68,000 |
54.9 |
2540 |
1540 |
Medium |
Large |
|
|
68,000 |
Medium |
Large |
||||
|
67,000 |
Medium |
Large |
||||
|
66,000 |
54.66 |
1796 |
1340 |
Medium |
Large |
|
|
65,000 |
57.61 |
1890 |
1494 |
Medium |
Large |
|
|
65,000 |
Medium |
Large |
||||
|
Airbus A319[18] |
64,000 |
62.5 |
1850 |
1470 |
Medium |
Large |
|
63,000 |
51.7 |
1939 |
1396 |
Medium |
Large |
|
|
60,000 |
49.9 |
1832 |
1360 |
Medium |
Large |
|
|
59,000 |
50.8 |
1463 |
1356 |
Medium |
Large |
|
|
Airbus A318[18] |
59,000 |
57.5 |
1375 |
1340 |
Medium |
Large |
|
55,000 |
47.174 |
1950 |
Medium |
Large |
||
|
55,000 |
Medium |
Large |
||||
|
54,000 |
Medium |
Large |
||||
|
50,000 |
46.265 |
1950 |
Medium |
Large |
||
|
50,000 |
Medium |
Large |
||||
|
48,600 |
Medium |
Large |
||||
|
48,500 |
Medium |
Large |
||||
|
Embraer 190[19] |
48,000 |
43 |
2056 |
1323 |
Medium |
Large |
|
46,000 |
Medium |
Large |
||||
|
46,000 |
39.95 |
1621 |
1350 |
Medium |
Large |
|
|
44,000 |
Medium |
Large |
||||
|
42,000 |
36.74 |
Medium |
Large |
|||
|
39,000 |
Medium |
Large |
||||
|
Embraer 175[20] |
37,500 |
32.8 |
2244 |
1304 |
Medium |
Large |
|
Bombardier CRJ900[21] |
36,500 |
33.345 |
1778 |
1596 |
Medium |
Large |
|
Embraer 170[22] |
36,000 |
32.8 |
1644 |
1274 |
Medium |
Large |
|
33,000 |
30.39 |
1564 |
1478 |
Medium |
Large |
|
|
33,000 |
Medium |
Large |
||||
|
30,400 |
Medium |
Large |
||||
|
28,000 |
28.01 |
1219 |
1295 |
Medium |
Large |
|
|
23,000 |
21.319 |
1918 |
1479 |
Medium |
Large |
|
|
22,800 |
22.35 |
1333 |
914 |
Medium |
Large |
|
|
22,800 |
21.5 |
1300 |
Medium |
Large |
||
|
22,000 |
19.3 |
2270 |
1380 |
Medium |
Large |
|
|
18,600 |
18.3 |
1165 |
1126 |
Medium |
Small |
|
|
13,150 |
12.93 |
1300 |
1030 |
Medium |
Small |
|
|
11,500 |
11.25 |
1560 |
1380 |
Medium |
Small |
|
|
10,890 |
10.57 |
1493 |
826 |
Medium |
Small |
|
|
Learjet 75[23] |
9,752 |
8.709 |
1353 |
811 |
Medium |
Small |
|
Pilatus PC-24[24] |
8,300 |
7.665 |
893 |
724 |
Medium |
Small |
|
Embraer Phenom 300[25] |
8,150 |
7.65 |
956 |
677 |
Medium |
Small |
|
7,765 |
7.605 |
1036 |
853 |
Medium |
Small |
|
|
Cessna Citation CJ4[26] |
7,761 |
7.103 |
1039 |
896 |
Medium |
Small |
|
7,000 |
Medium |
Small |
||||
|
4,800 |
4.43 |
975 |
741 |
Light |
Small |
Case 2: Is there any difference between ground speed and airspeed:
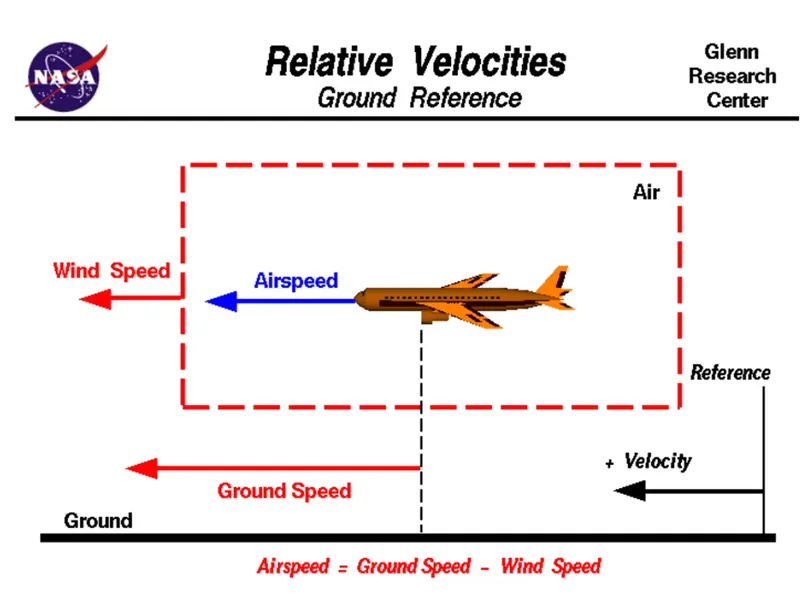
Ground Speed:
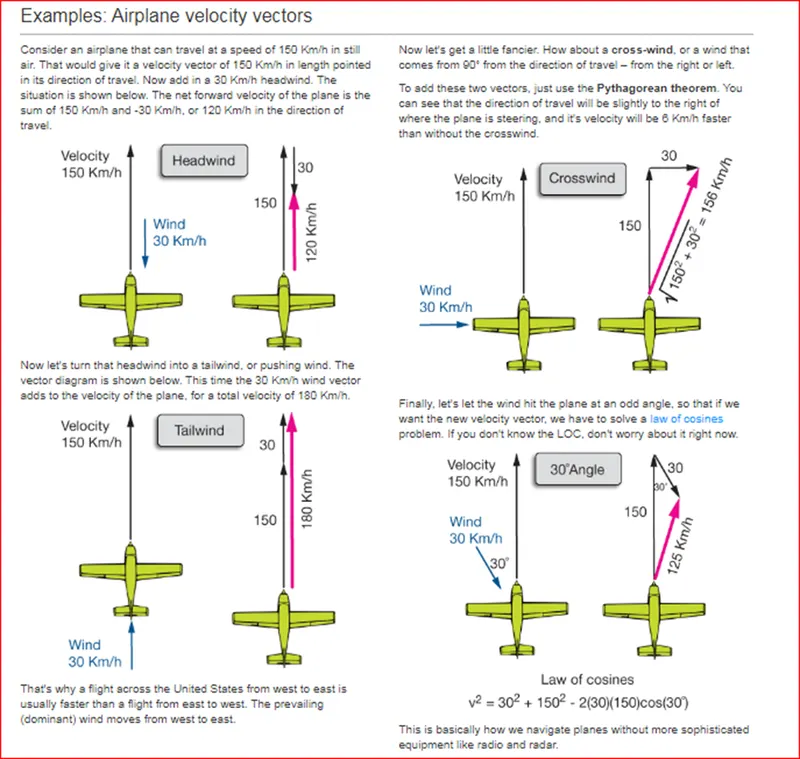
Ground speed is the horizontal speed of an aircraft relative to the ground. An aircraft heading vertically would have a ground speed of zero. The information displayed to passengers through the entertainment system of airline aircraft often gives the aircraft ground speed rather than airspeed. For a reference point picked on the ground, the aircraft moves relative to the reference point at the ground speed. Ground speed is also a vector quantity so a comparison of the ground speed to the wind speed must be done according to rules for vector comparisons.
Airspeed:
The important quantity in the generation of lift is the relative velocity between the object and the air, which is called the airspeed. Airspeed cannot be directly measured from a ground position but must be computed from the ground speed and the wind speed. Airspeed is the vector difference between ground speed and wind speed.
Airspeed = Ground Speed - Wind Speed
On a perfectly still day, the airspeed is equal to the ground speed. But if the wind is blowing in the same direction that the aircraft is moving, the airspeed will be less than the ground speed.
Wind speed:
- For a reference point picked on the ground, the air moves relative to the reference point at the wind speed. Notice that the wind speed is a vector quantity and has both a magnitude and a direction. The direction is important. A 20 mph wind from the west is different from a 20 mph wind from the east. The wind has components in all three primary directions (north-south, east-west, and up-down). In this figure, we are considering only velocities along the aircraft's flight path. Positive velocity is defined to be in the direction of the aircraft's motion. We are neglecting crosswinds, which occur perpendicular to the flight path but parallel to the ground, and updrafts and downdrafts, which occur perpendicular to the ground.
Difference Between ground speed and airspeed:
- As mentioned above, true airspeed is simply the speed at which an aircraft is moving relative to the air it is flying in. As such, it’s also the speed at which the air is flowing around the aircraft’s wings.
- Ground speed, on the other hand, is the aircraft’s speed relative to the ground. One thing that should be noted here is that it’s its horizontal rather than vertical speed – an aircraft climbing completely vertically would have a ground speed of zero.
- In other words, while airspeed is what determines whether there is enough airflow around an aircraft to make it fly, ground speed is what determines how fast an aircraft will get to its destination.
Case 3: Why is it not recommended to use aircraft engine power to move it on the ground at Airport?
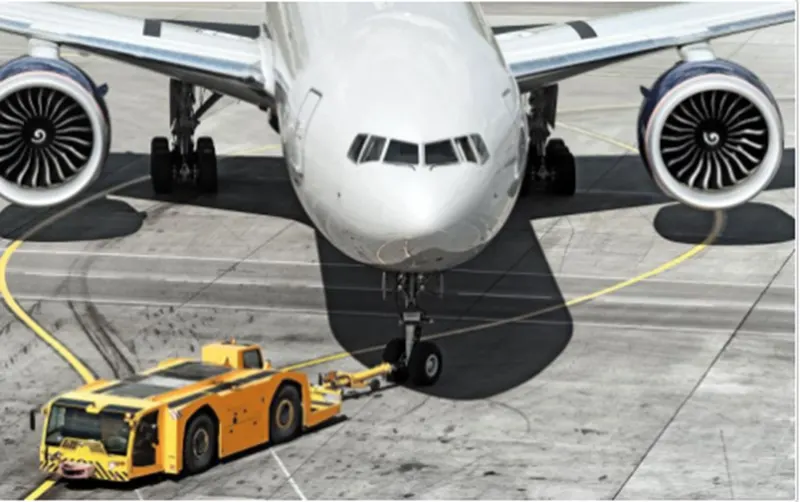
Aircraft move using their engine power all the time on the airport apron and taxiways under their power to go towards runways and after landing taxi to their assigned gate. But the thrust produced resulting in a jet blast might cause damage to the terminal building or equipment. Engines close to the ground may also blow sand and debris forward and then suck them into the engine, causing damage to the engine. The only time they use external assistance is to push back from the gate. Large turbofan aircraft need help to reverse via a pushback tractor. The engines are turned on after the pushback is complete and the aircraft can move forward under Its power. To be accurate, some aircraft can reverse using a variable pitch prop or thrust reversing on turbofans but generally reversing is done via pushback tractors. Blasting jet reversers blows debris In the crowded gate area creating foreign object damage hazards for adjacent aircraft, gate equipment, or terminal waiting area glass windows.
The disadvantages of using aircraft engine power to move it on the ground at the Airport are given below,
- Fuel consumption.
- Wear and tear on the engine.
- Effectively a loss of control can happen, especially during high power engine running. Damage can occur to the aircraft itself, other aircraft nearby, or airside structures.
- There is a risk of injury to ground support personnel who may be in relative proximity to the aircraft.
- It is easier for the truck driver to see the surroundings better than the pilot sitting in the cockpit with a limited window. The pushback driver knows the airport better than the pilot.
- It also saves fuel Virgin Atlantic had proposed a new system in which pushback trucks will move the aircraft to the runway to save fuel and reduce the impact on the environment.
- The plane engines are very loud. When more than one plane will add up its sound then it will not be pleasant for passengers and others near the airport.
Taxing:
- Taxing (rarely spelled taxying) is the movement of an aircraft on the ground, under its power, in contrast to towing or push-back where the aircraft is moved by a tug. The aircraft usually moves on wheels, but the term also includes aircraft with skis or floats (for water-based travel).
- An airplane uses taxiways to taxi from one place in an airport to another for example, when moving from a hangar to the runway. The term "taxing" is not used for the accelerating run along a runway before takeoff, or the decelerating run immediately after landing, which is called the takeoff roll and landing rollout, respectively.
- Aircraft are not always moved with tugs (the small vehicle you refer to). Much of the time, they operate under their power. Airliners are generally pushed back from the gate using a tug, as that's the simplest and most efficient method. They then taxi to the runway (and up to the gate, after landing) using their engines to provide thrust. This is true of both jets and propeller aircraft.
- Some work is being done on self-contained electric-powered ground propulsion one major player in this area is a company called WheelTug. They use high-torque motors and the aircraft APU to allow the aircraft to move without starting its engines or requiring a tug to be connected and disconnected.
Case 4: How an aircraft is pushed to runway when its ready to take off?
Pushback:
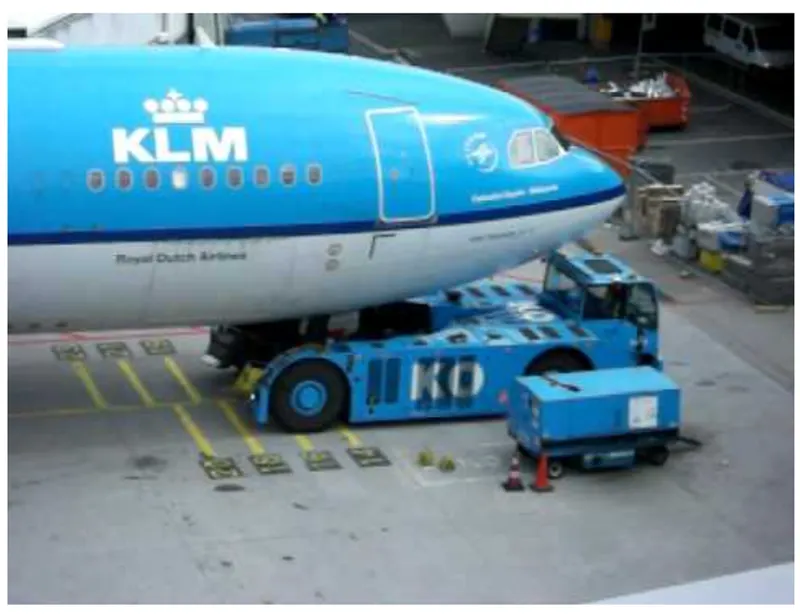
Pushback is when an aircraft is pushed backward away from the airport gate by vehicles called tugs or tractors. Closer to departure, an aircraft tug will park right in front of the nose wheel. The tug might be directly attached to the plane's nose gear with a tow bar, or could be a "wheel-lift" tug. These tugs cradle the nose gear, then lift it before moving the plane. That gives the tug driver control over the plane's direction during pushback.
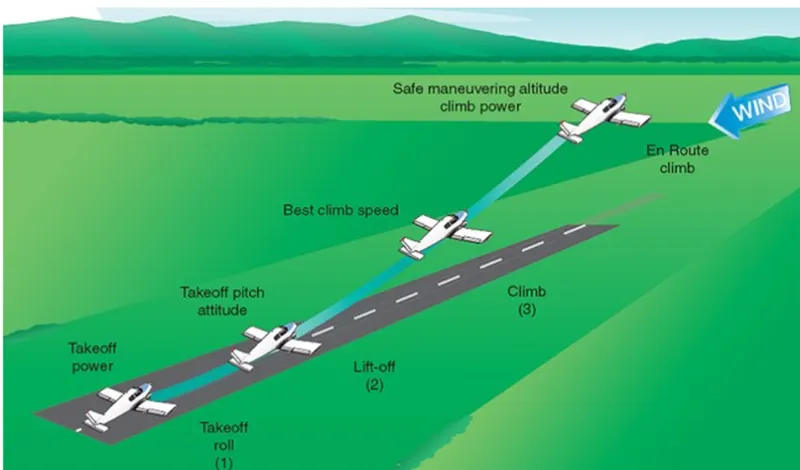
Phases of take-off flight:
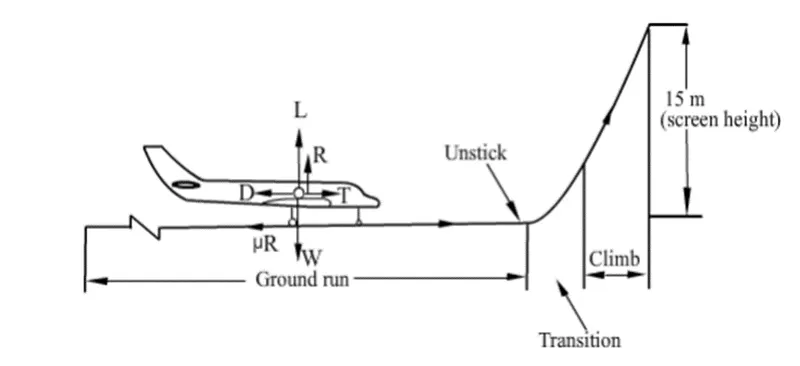
The take-off flight is generally divided into two phases namely
Take-off ground run
Transition and climb phases
(i) Take-off ground run
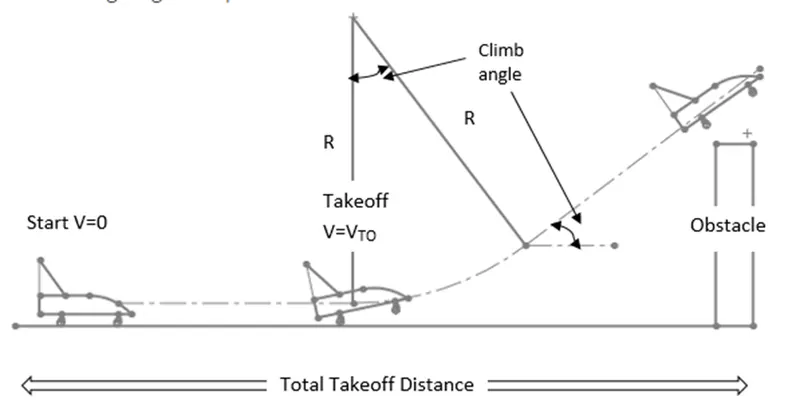
Take-off ground run During the ground run the airplane starts from rest and accelerates to the take-off speed (VT0 or V1). The flaps and engine(s) are adjusted for their take-off settings. In the case of an airplane with a tricycle type of landing gear, all three wheels remain in contact with the ground till a speed of about 85% of the VT0 is reached. This speed is called ‘Nose wheel lift-off speed’. At this speed, the pilot pulls the stick back and increases the angle of attack of the airplane to attain a lift coefficient corresponding to take-off (CLT0). At this stage, the nose wheel is off the ground and the speed of the airplane continues to increase. As the speed exceeds the take-off speed the airplane gets airborne and the main landing gear wheels also leave the ground. When the airplane has a tailwheel type of landing gear, the angle of attack is high at the beginning of the take-off run. However, the tail wheel is lifted off the ground as soon as some speed is gained and the deflection of the elevator can rotate the airplane about the main wheels. This action reduces the angle of attack and consequently the drag of the airplane during most of the ground run. As the take-off speed is approached the tail wheel is lowered to get the incidence corresponding to CLT0. When VT0 is exceeded, the airplane gets airborne. The point at which all the wheels have left the ground is called the ‘Unstick point’.
(ii) Transition and climb phases
During the transition phase, the airplane moves along a curved path and the pilot tries to attain a steady climb. As soon as the airplane attains an altitude equal to the screen height, the take-off flight is complete. For airplanes with a high thrust-to-weight ratio, the screen height may be attained during the transition phase itself.
Phases of take-off flight
Case 5: Learn about take-off power, tire design, rolling resistance, tire pressure, and brake forces when landing.
(a) Take off power
For light aircraft, usually, full power is used during takeoff. Large transport category (airliner) aircraft may use a reduced power for takeoff, where less than full power is applied to prolong engine life, reduce maintenance costs and reduce noise emissions. In some emergency cases, the power used can then be increased to increase the aircraft's performance. Before takeoff, the engines, particularly piston engines, are routinely run up at high power to check for engine-related problems. The aircraft is permitted to accelerate to rotation speed (often referred to as Vr). The term rotation is used because the aircraft pivots around the axis of its main landing gear while still on the ground, usually because of gentle manipulation of the flight controls to make or facilitate this change in aircraft attitude.
Take-off power can also be predicted using a simple measure of the acceleration of the aircraft along the runway based on force equilibrium.
The forces involved will be.
T is a Thrust of propulsion system pushing aircraft along the runway.
D is the Aerodynamic Drag of a vehicle resisting the aircraft's motion.
F is Rolling resistance friction due to the contact of wheels or skids on the ground.
During the take-off run, the imbalance in these forces will produce an acceleration along the runway.
m*(DV/dt)=T-D-F
where DV/dt is the acceleration along the runway and m is the mass of the vehicle.
The procedure for take-off will be that the vehicle will accelerate until it reaches a safe initial flying speed. The pilot can then rotate the vehicle to an attitude to produce a climb lift and it will ascend from the ground. The determination of this safe flying speed or rotation speed. V is a critical factor in determining take-off performance. Take-off rules vary slightly depending on the aircraft category.
For Small commuter aircraft
V= 1.1*VSTALL
or
V=1.05*V Control
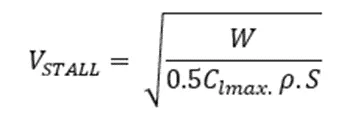
Where S= Length of Runway
Take-off Power = Force* Displacement
`(m.dv/dt) .2.S_1 → (T – D - F). S_1`
(b) Tyre design
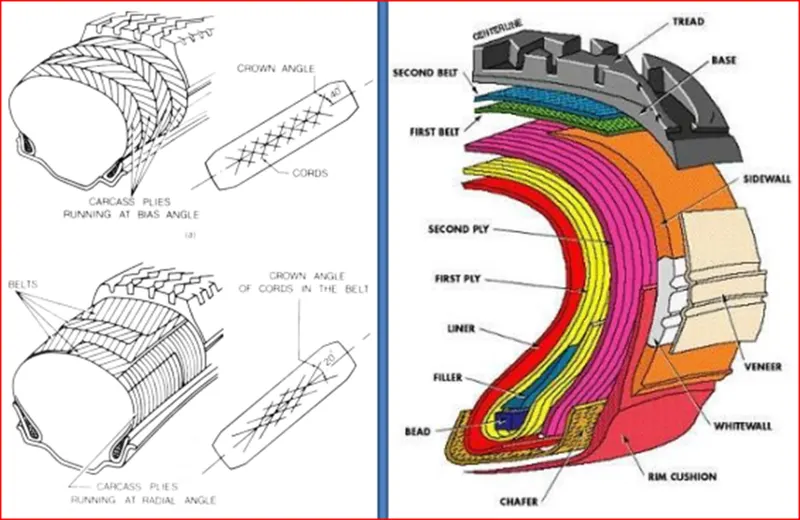
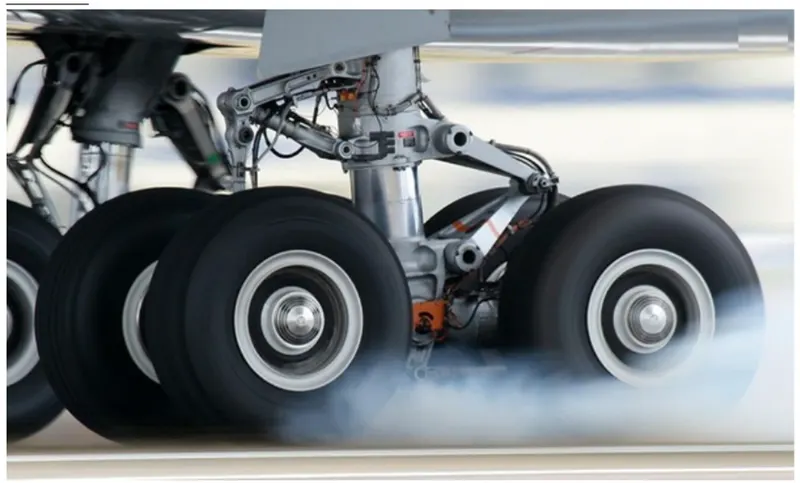
An aircraft tire or tire is designed to withstand extremely heavy loads for short durations. The number of tires required for aircraft increases with the weight of the aircraft, as the weight of the airplane needs to be distributed more evenly. Aircraft tire tread patterns are designed to facilitate stability in high crosswind conditions, to channel water away to prevent hydroplaning, and for braking effect.
Aircraft tires also include fusible plugs (which are assembled on the inside of the wheels), designed to melt at a certain temperature. Tires often overheat if maximum braking is applied during an aborted takeoff or an emergency landing. The fuses provide a safer failure mode that prevents tire explosions by deflating in a controlled manner, thus minimizing damage to aircraft and objects in the surrounding environment.
Based on the type of plies used the tires can be:
Radial ply tires - these tires feature a flexible casing that is constructed of rubber-coated ply cords which extend around the beads and are substantially at 90° to the centerline of the tread. The casing is stabilized by an essentially inextensible circumferential belt.
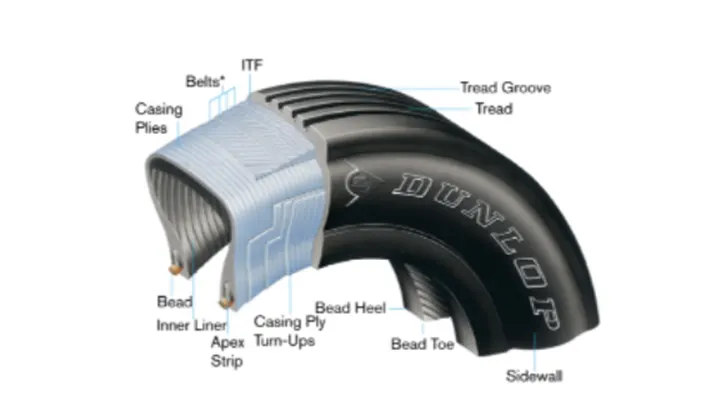
Composition of a radial-ply tire
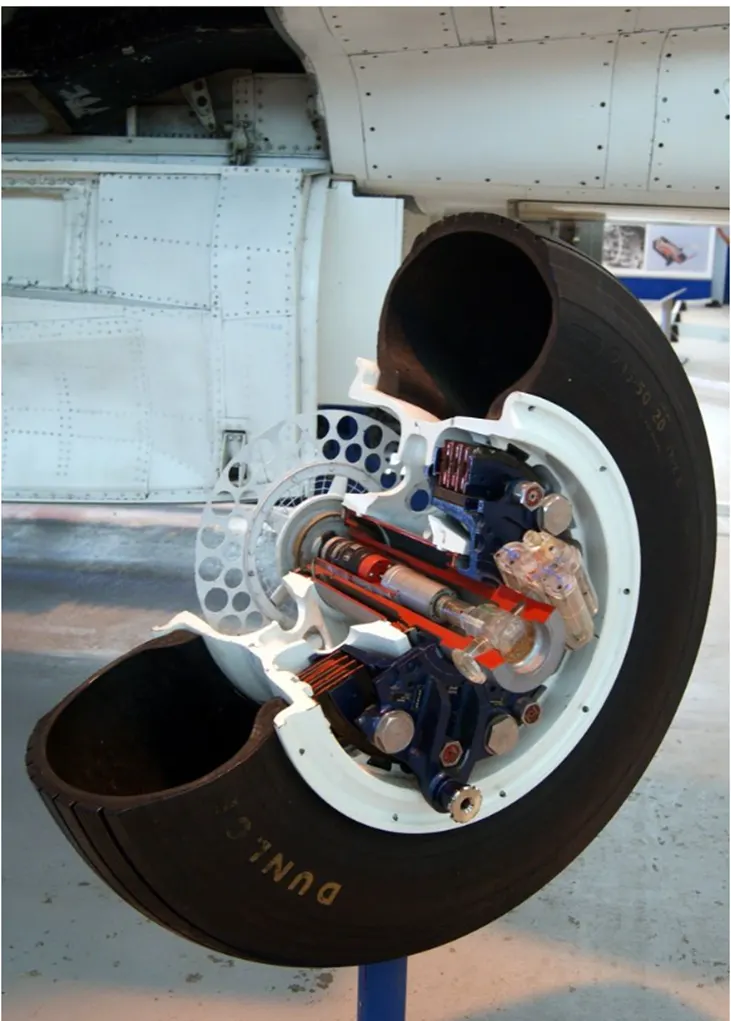
Bias-ply tires - these tires feature a casing that is constructed of alternate layers of rubber-coated ply cords which extend around the beads and are at alternate angles substantially less than 90° to the centerline of the tread.
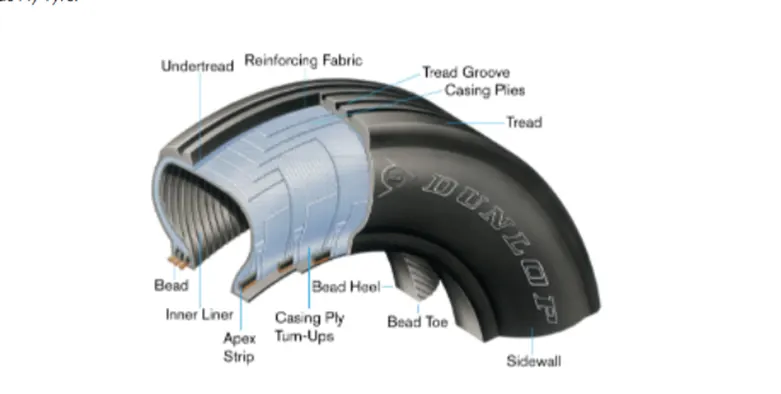
Composition of a bias-ply tire
Based on the method for containing the inflation gas the tires can be:
Tube-type tires - these require tubes for inflation retention.
Tubeless tires - these do not require tubes. They are constructed with an inner liner (integral rubber lining that is engineered to prevent the diffusion of the inflation gas into the casing.)
Aircraft tires may be tube-type or tubeless. They support the weight of the aircraft while it is on the ground and provide the necessary traction for braking and stopping. The tires also help absorb the shock of landing and cushion the roughness of takeoff, rollout, and taxi operations. Aircraft tires must be carefully maintained to perform as required. They accept a variety of static and dynamic stresses and must do so dependably in a wide range of operating conditions.
(c) Rolling Resistance And Measurement of Rolling friction:
Rolling resistance sometimes called rolling friction or rolling drag is the force resisting the motion when a body (such as a ball, tire, or wheel) rolls on a surface. The measurement of the rolling friction was accomplished by recording the pull between a towing vehicle and a loaded trailer equipped with the wheel and tires to be tested. The resistance thus measured included, of course, that due to the wheel bearings as well as that of the tires.
The tires and wheels tested included two sizes of each of the types generally classified as standard high pressure, low pressure, and extra-low pressure. The tests were run at various speeds under several conditions of wheel loading and tire inflation pressure. The ground surface conditions investigated were concrete, firm turf, and soft turf.
As an indication of the probable effect on the take-off of the differences in rolling friction occasioned by the various conditions, calculations were made of the distance required to leave the ground for two hypothetical airplanes of different loading characteristics for each case several values of rolling-friction coefficient, covering the range determined by the tests.
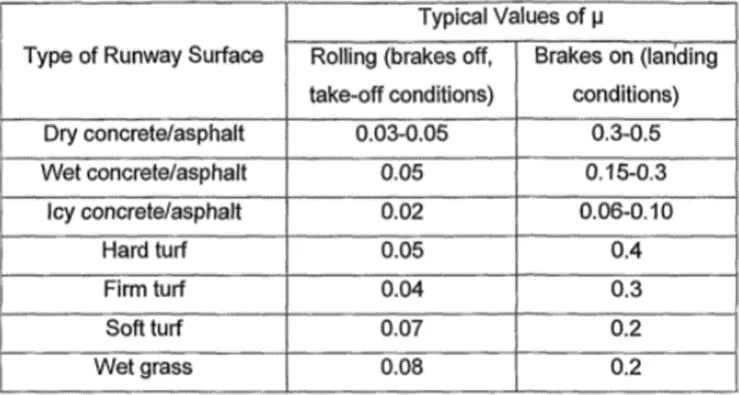
Rolling Resistance Coefficient:
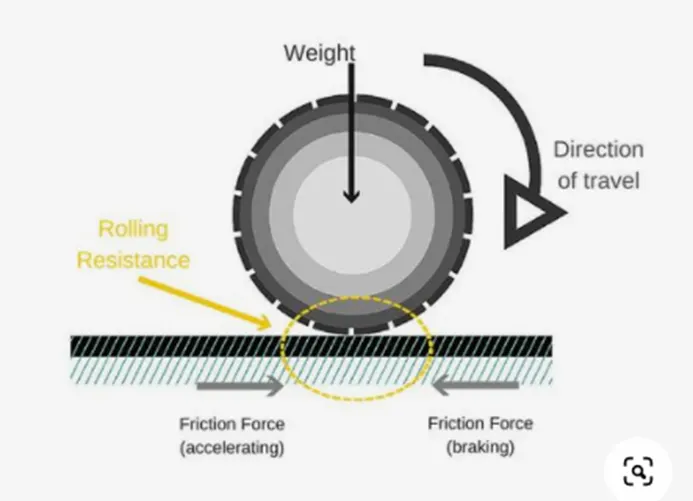
The coefficient of rolling friction is the indication of how great the rolling resistance is for a given normal force between the wheel and the surface upon which it is rolling. This ratio is based on the Standard Friction Equation.
The Standard Friction Equation is,
Fr = μrN
Dividing by N, you can get the equation for the coefficient of rolling friction,
μr = Fr/N
where,
μr is the coefficient of rolling friction for the two surfaces (Greek letter "mu" sub r)
Fr is the resistive force of rolling friction
N is the normal or perpendicular force of the wheel on a surface
(d) Tyre Pressure
Aircraft tires operate at such high extremes of pressure, load, and speed, that their care and service are critically important. The most important action an operator can take to prevent tire-related events is to maintain proper tire inflation pressure. Failure to keep aircraft tires properly inflated can lead to very serious consequences. The most serious of these is the structural failure of the tire. If the tire operates under-inflated or over deflected/overloaded, the nylon cords which form the structure of the tire go in and out of compression as the tire rotates. This weakens the cords – much like a paperclip that is bent back and forth – until eventually, the cords break. If enough cords break, the entire structure will eventually fail.
Another serious consequence of under-inflation is the thrown tread. Overdeflection increases shear between components in the tire as it rolls in and out of contact and deforms. This results in a more rapid buildâ€up of heat within the tire than would be evident if the tire were properly inflated. At some point, the excessive heat will cause the rubber to revert, or reverse cure. This reverted rubber is like grease with no strength or adhesion to contain the structure. This can allow the tire to decompose, throwing the entire tread or pieces of it. In addition to destroying the tire, thrown treads often result in expensive aircraft damage.
Rated conditions in Aircraft tire
Aircraft tires are designed and tested to “rated” conditions. These rated conditions are specified by industry standards bodies like The Tire and Rim Association (T&RA) and The European Tyre and Rim Technical Organisation (ETRTO). However, most aircraft are not operated at the rated limits. This means that an operator must consult the aircraft’s Aircraft Maintenance Manual (AMM) or Pilot Operating Handbook (POH) to find out the recommended operating pressure range.
To check the pressure every day
Because of the high pressures and extreme temperatures at which aircraft tires operate, they do not hold air perfectly. An aircraft tire can lose up to 5 percent of its pressure in 24 hours and still be perfectly serviceable. It’s important to check tire pressures when they are cold if at all possible. Michelin recommends checking a tire’s pressure no sooner than three hours after it has last rolled. Tires that have rolled under load recently heat up, making it very difficult to determine what the proper pressure should be.
Aircraft tires are usually inflated with nitrogen to minimize expansion and contraction from extreme changes in ambient temperature and pressure experienced during flight. Dry nitrogen expands at the same rate as other dry atmospheric gases (normal air is about 80% nitrogen). but common compressed air sources may contain moisture, which increases the expansion rate with temperature.
Also, the use of inert gas for tire inflation eliminates the possibility of a tire explosion.
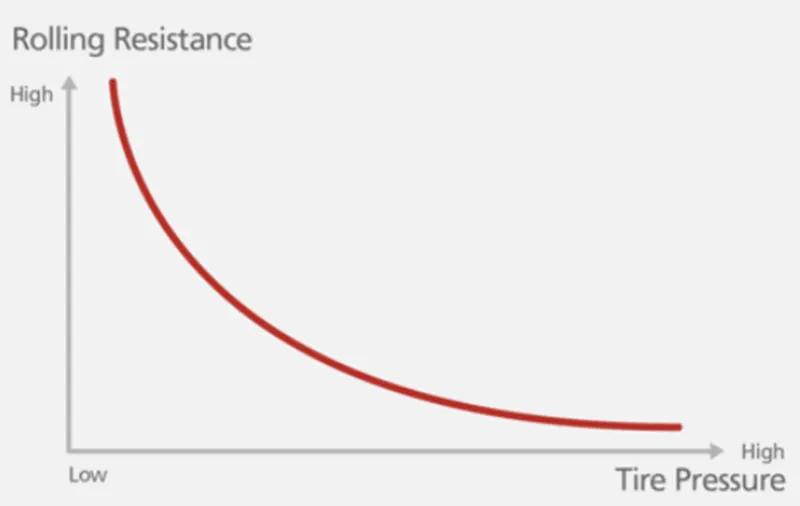
Relation to Rolling Resistance and Tire Pressure:
Rolling resistance and Tire pressure are inversely proportional.
(e) Braking System:
In the typical brake system, mechanical and/or hydraulic linkages to the rudder pedals allow the pilot to control the brakes. Pushing on the top of the right rudder pedal activates the brake on the right main wheel(s) and pushing on the top of the left rudder pedal operates the brake on the left main wheel(s). The basic operation of brakes involves converting the kinetic energy of motion into heat energy through the creation of friction. A great amount of heat is developed and forces on the brake system components are demanding. Proper adjustment, inspection, and maintenance of the brakes are essential for effective operation.
Types and construction of aircraft brakes:
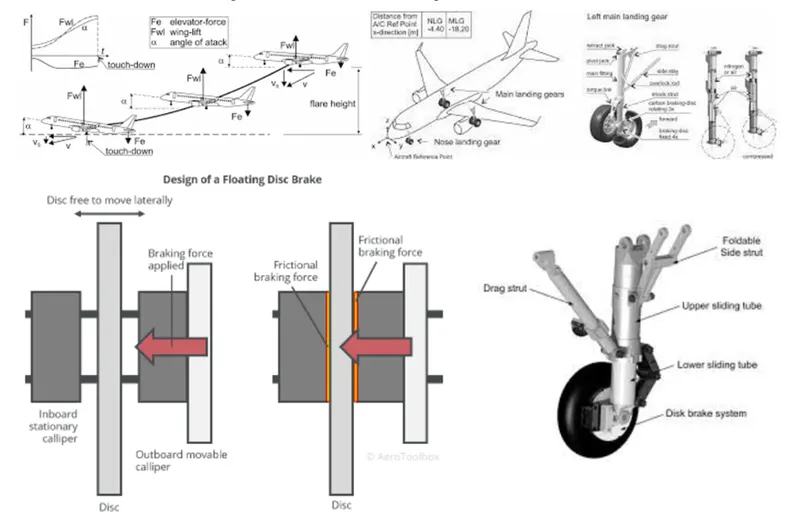
Modern aircraft typically use disc brakes. The disc rotates with the turning wheel assembly while a stationary caliper resists the rotation by causing friction against the disc when the brakes are applied. The size, weight, and landing speed of the aircraft influence the design and complexity of the disc brake system. Single, dual, and multiple disc brakes are common types of brakes. Segmented rotor brakes are used on large aircraft. Expander tube brakes are found on older large aircraft. The use of carbon discs is increasing in the modern aviation fleet.
Braking forces when landing:
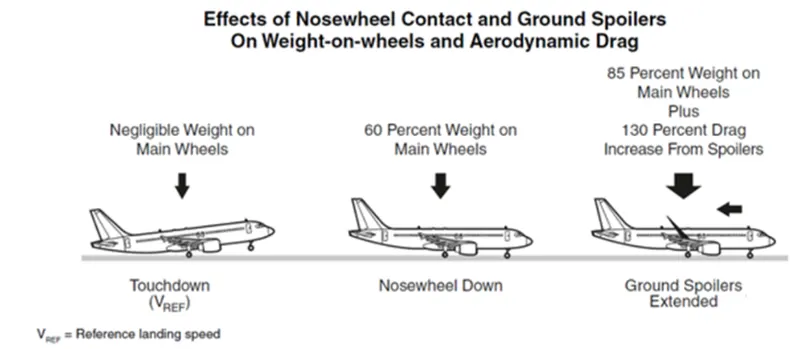
Following braking devices are used to decelerate the aircraft -
Spoilers.
Wheel Brakes (Including Anti-Skid systems & Auto-Brake systems).
Reverse Thrust
Spoilers:
The mechanical deflection of parts of the wing's upper surface by increasing aerodynamic drag on the moving aircraft. This can be achieved by raising upper wing surface panels called ground spoilers or by operating a tail cone 'clamshell-type air brake and also by increasing the effective downward load on the landing gear and thereby increasing the efficiency of the wheel braking.
Wheel Brakes:
To be effective, braking action at any speed depends upon sufficient friction existing between the tires and the runway surface achieved through freely rotating wheels.
Anti-skid system: When landing on slippery runways, there's a chance that the wheels may start to skid as the brakes are applied. To stop this from happening and to maintain maximum effective braking, each wheel has anti-skid protection.
Using a variety of sources to determine the aircraft speed, the brake units know how fast the wheels should be spinning. If that speed drops significantly, it's because the current brake pressure on that wheel is too great and the wheel is just skidding over the surface. In this situation, the anti-skid system automatically reduces the braking on that wheel to a point where the skid stops before reapplying the pressure.
Reverse Thrust:
Thrust reversers provide a deceleration force that is independent of runway conditions. Thrust reverser efficiency is higher at high airspeed, therefore. reversers must be selected as early as possible after touchdown.
Thrust reversers should be returned after reverse idle at low airspeed to prevent engine stall or foreign object damage.
BRAKEFORCE:-
In aircraft types, the brake units are powered by the hydraulics system. An electrical signal is sent from the flight deck to hydraulic actuators near the main landing gear. Here, hydraulic fluid at 3000 pounds per square inch is used to force the brake unit against the wheel, thus slowing it down.
Part B:
Case 6: A. With necessary assumptions, calculate the force and power required to push/pull an aircraft by a towing vehicle
The force required to push/pull an aircraft by a towing are rolling resistance force and aerodynamic drag force.
Rolling resistance force:
It is the force resisting the motion when a body(such as a ball, tire, or wheel) rolls on a surface. Its governing equation is given as
F=Crr*N
F=Crr*m*g
Where,
Crr= rolling resistance coefficient
M= mass of the body
g = acceleration due to gravity
aerodynamic drag force:
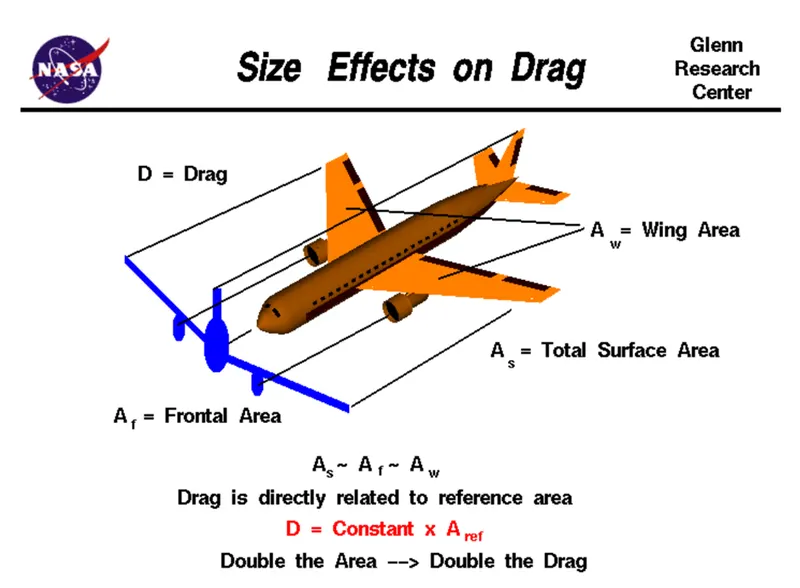
It is the force opposing the motion of the body. The drag coefficient is a common measure in automotive design as it pertains to aerodynamics. Drag is a force that acts parallel to and in the same direction as the airflow. The drag coefficient of an automobile measures the way the automobile passes through the surrounding automobile drag coefficient in addition to the other performance characteristics. Aerodynamic drag increases with the square of speed; therefore it becomes critically important at higher speeds. Reducing the drag coefficient in an automobile improves the performance of the vehicle as it pertains to speed and fuel efficiency. The governing equation of these forces is given as follows:
Fd=1/2*pv^2CdA
Where,
Fd= drag force
P=mass density of air
V= flow velocity relative to the object
Cd= drag coefficient
A= reference area
Calculation:
Let us assume that,
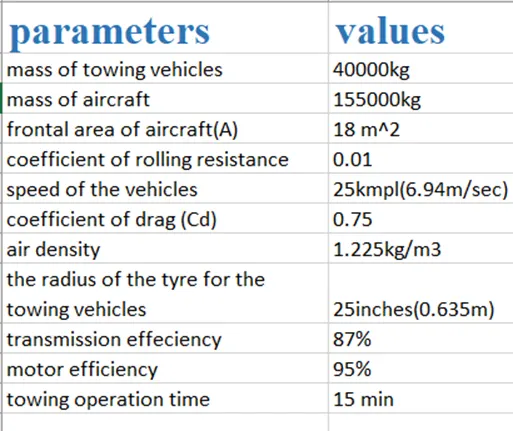
Mass of towing vehicle=40000kg
Mass of aircraft = 155000kg
Total mass (m) = 40000+155000=195000kg
Frontal area of the aircraft(A)=18m2
speed of the vehicle (v) =25 kmpl
converting it into m/sec
v=25*(1000/3600)=6.944m/sec
drag cpoefficient (Cd)=0.75
air density(p)=1.225kg/m3
calculating rolling resistance force(Frr) =Crr*m*g.
=0.01*195000*9.8
=19110N
Calculating aerodynamic drag force (Fd) =0.5*p*Cd*A*v2
=0.5*1.225*18*0.75*(6.9445)2
=398.769N
Therefore the force and power required to push / pull an aircraft by a towing vehicle(F)=Frr+Fd
=19110+398.769
=19508.769N
Calculating the power(P) = force*velocity
=19508.769*6.9445
=135.478kW
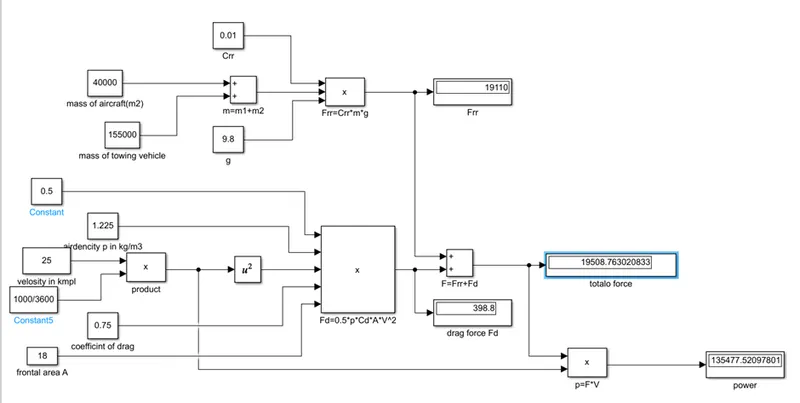
- Develop the model for the calculated force and power using Simulink
Explanation:
- For calculating power, we have to multiply both total force and velocity in m/sec for this we have used product block(P=F*V)
- For calculating total force we have added both For and Fd by using the sum block as shown in the above fig.
- To find the value of For we used to produce to multiply the values Crr, total mass(m), and gravity(g).which are to be entered in the constant block
- Similarly for calculating drag force we have to multiply the velocity, drag coefficient, frontal area of aircraft(A), and constant 0.5 which are to be entered in the constant block
- To convert velocity in ample to m/sec, we have multiplied it by 1000/3600
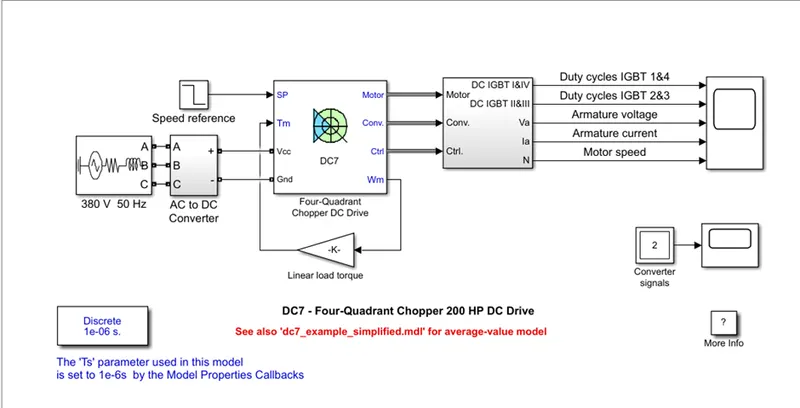
Case 7: A. Design an electric powertrain with the type of motor, its power rating, and energy requirement to fulfill aircraft towing application in Simulink. Estimate the duty cycle range to control the aircraft speed from zero to highest. Make all required assumptions. Prepare a table of assumed parameters. Draw a block diagram of the powertrain.
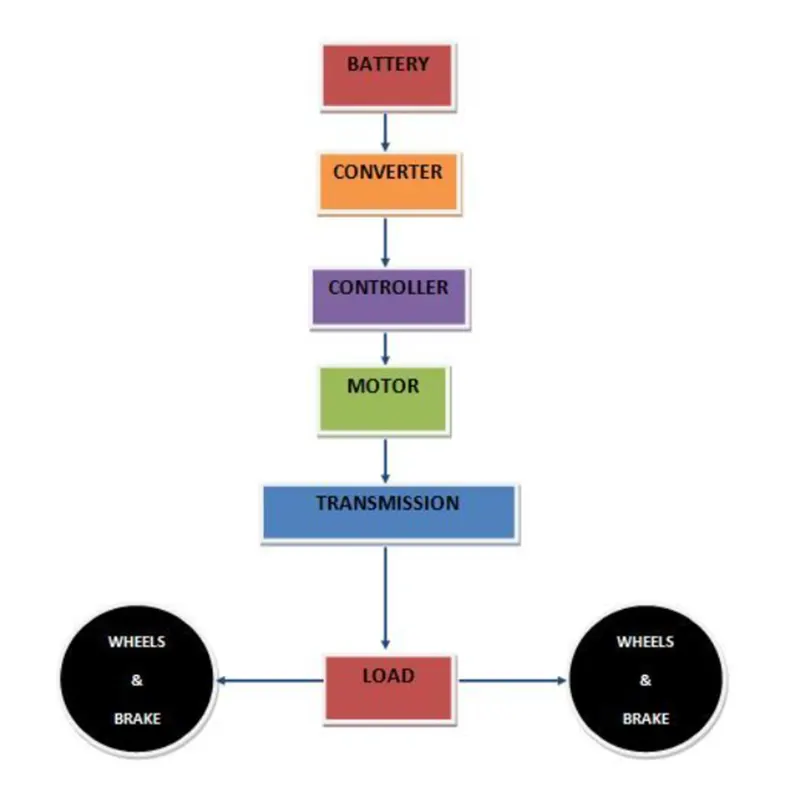
Block diagram of powertrain:
Based on the calculation done in 6A.
The force required to push/ pull the aircraft =19.508KN
Power required =135.478 kw
Let us assume,
The radius of the tyre=25 inches=0.635m
Gear ratio = 8
Transmission efficiency (ᶯt)=87%
Motor efficiency (ᶯm)=95%
The torque required for the wheels(Tw)= total force*radius in meters
=19.508*0.635
=12.387KNm
Motor torque= wheel torque/(gear ratio*ᶯt)
=12.387/(8*0.87)
=1.778KNm
For ᶯm=95%
The required motor torque(Tm) =1.778/0.95=1.871KNm
The total power required by the motor considering all the efficiency(pt) = 135.478/(0.87*0.95)=163.917Kw
Let us assume the towing operation was done for a 15 min duration.
Then, total energy consumed = 163.917*0.25=40.98KWh
If we consider the battery capacity = 220 kW is used by the towing vehicle then the duty cycle range to control the speed from 0 to max speed. (3m/s) is given as
Duty cycle (d) = (required power)/(rated power) = 163.917/220 =0.75
Therefore the controller will be able to provide a duty cycle ranging from 0 to 75 % to control the towing speed
Block diagram:
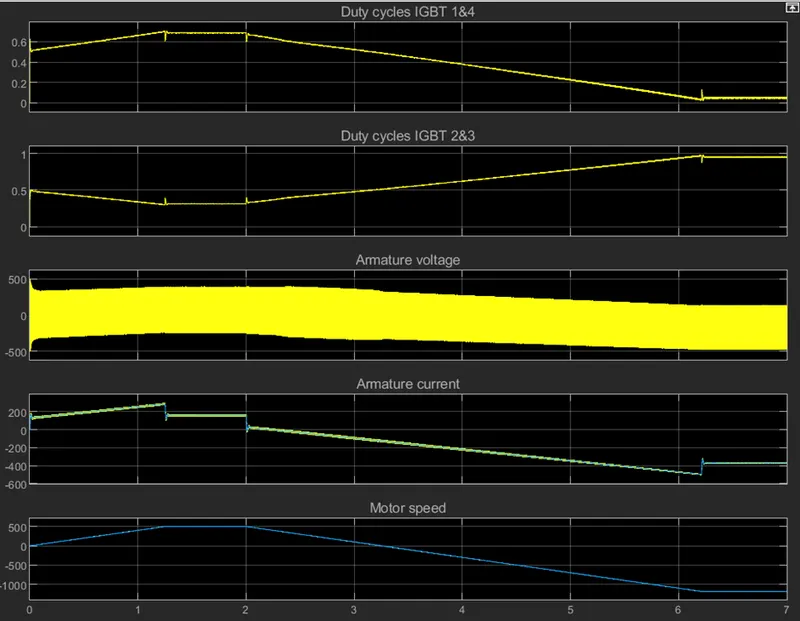
Output:
B.Design the parameters in an excel sheet