Project 1 - Parsing NASA thermodynamic data
PROJECT_1:- PARASING NASA THERMODYNAMIC DATA
AIM:- write a code in matlab to parse the nasa thermodynamic data file and then calculate the thermodynamic properties of various species.
objective:-
1. write a function that extracts the 14 co-efficients and calculate.
2. we have calculate the enthalphy, entrophy, specific heat for all species in the data file.
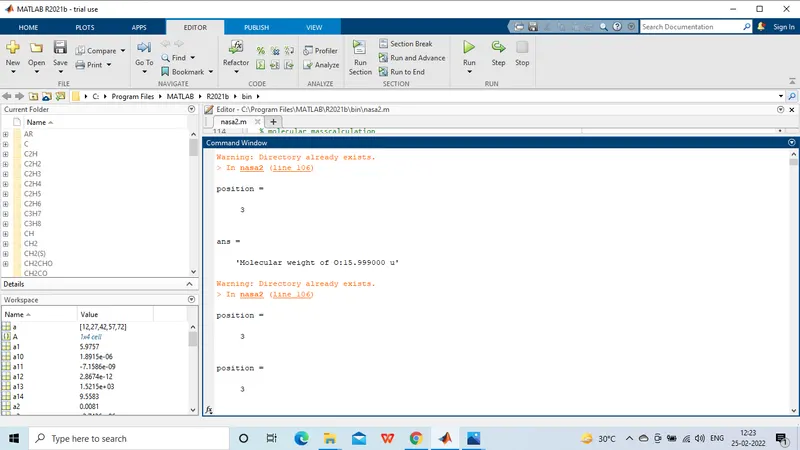
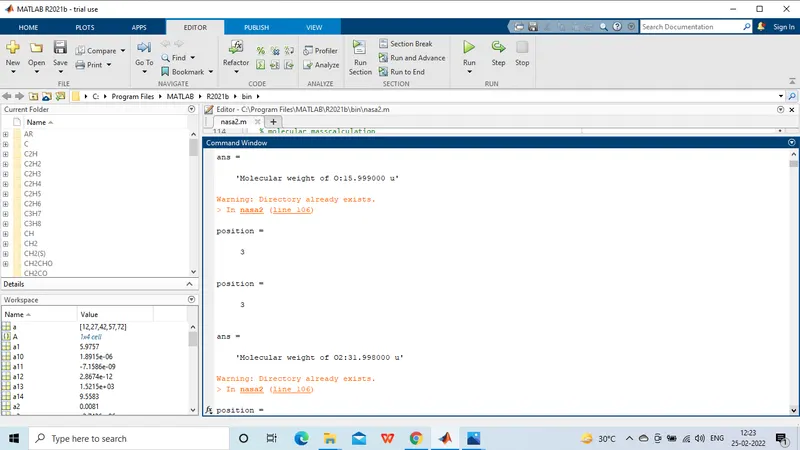
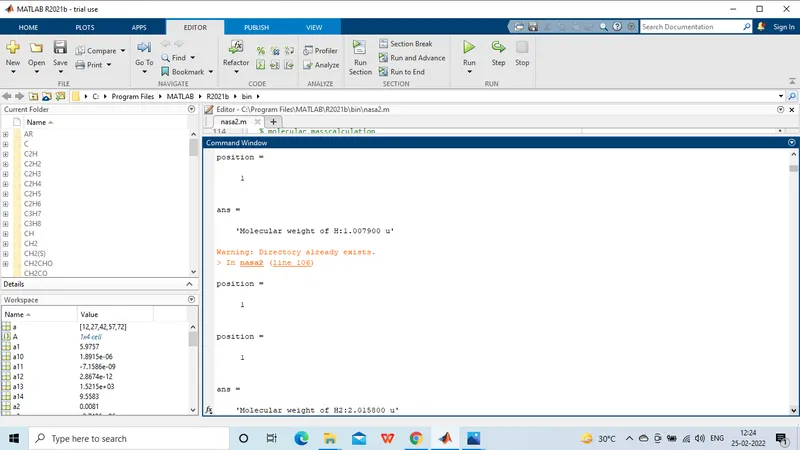
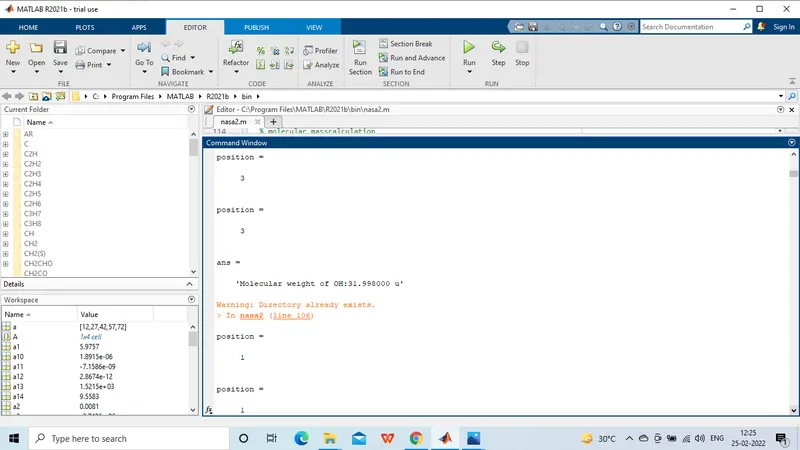
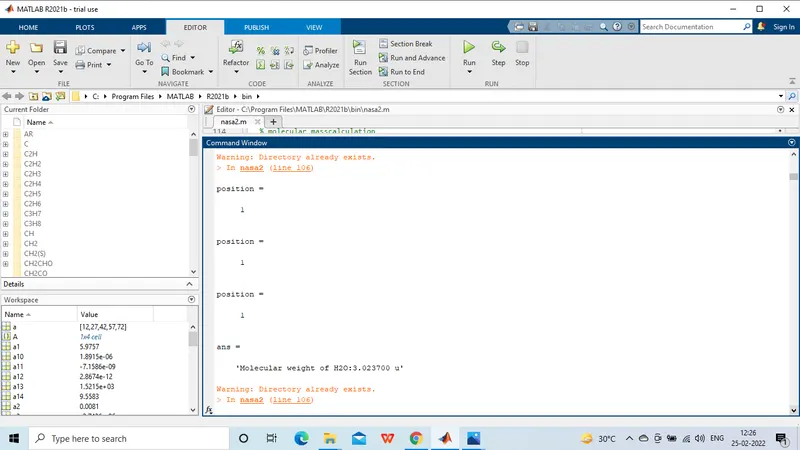
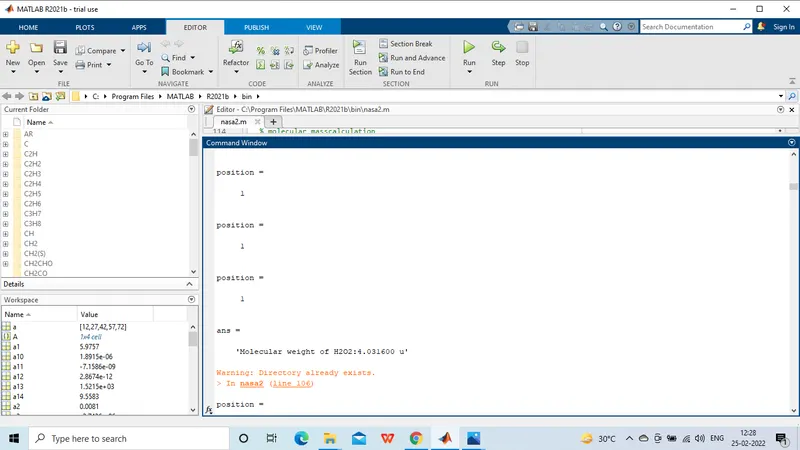
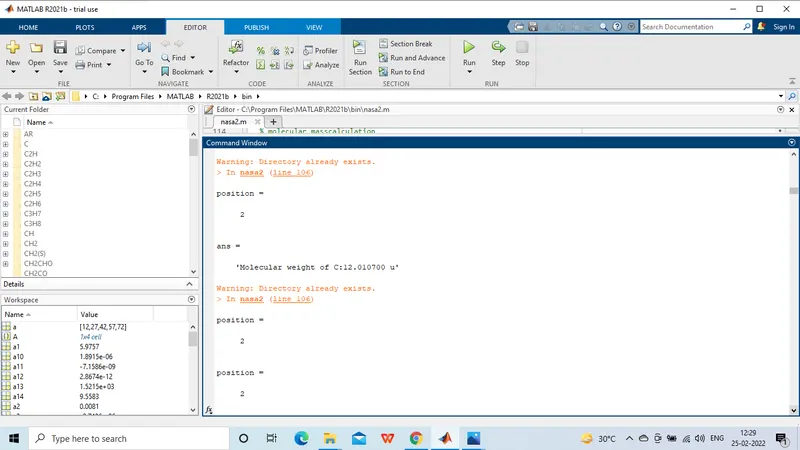
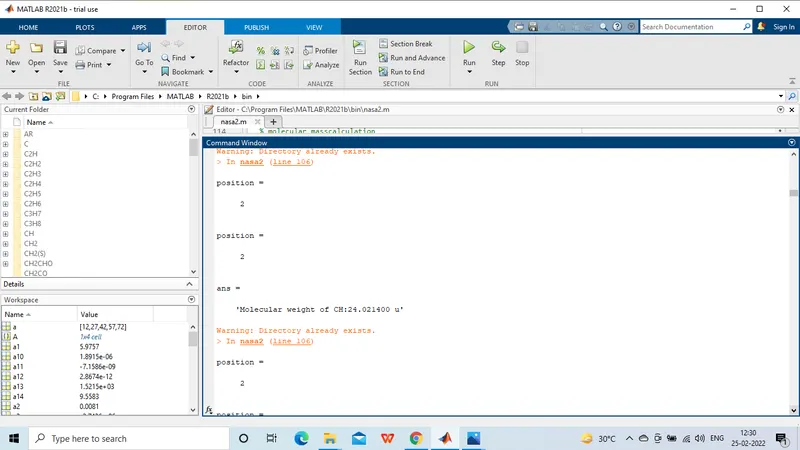
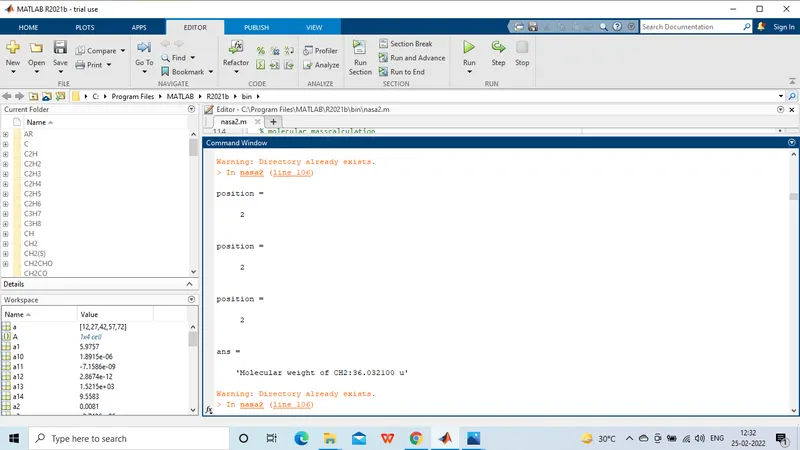
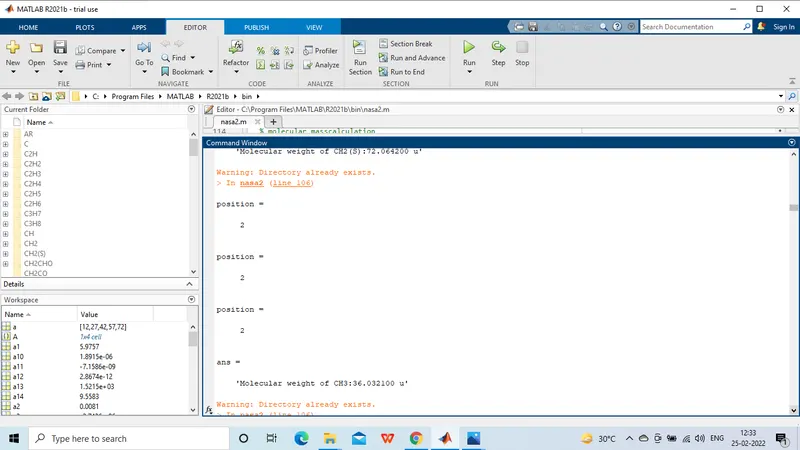
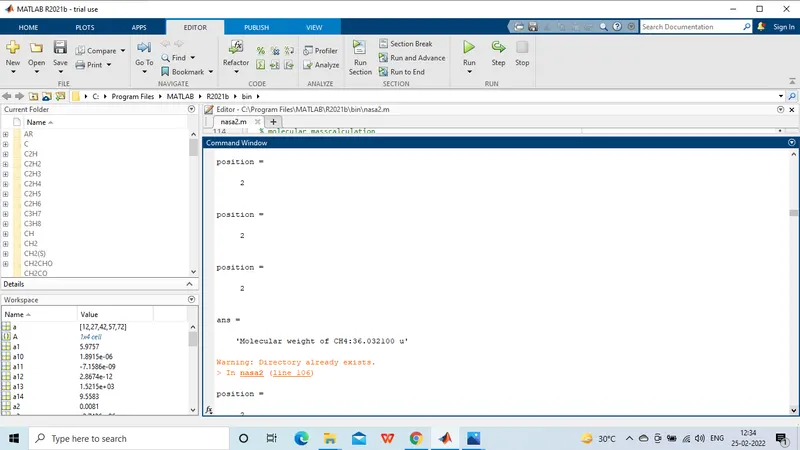
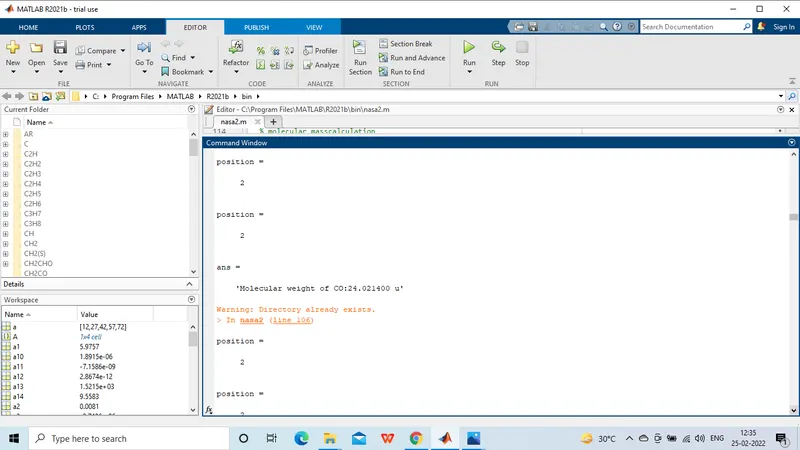
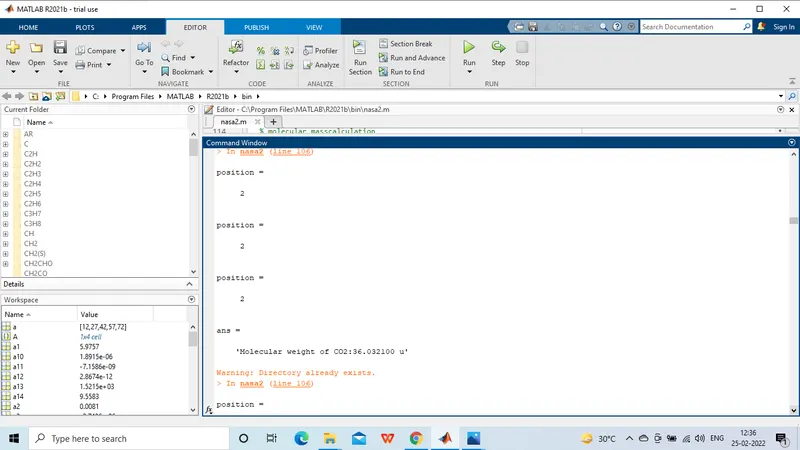
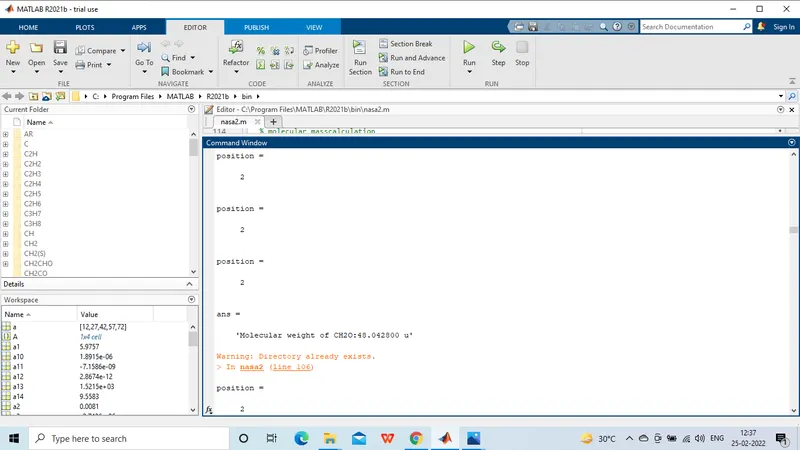
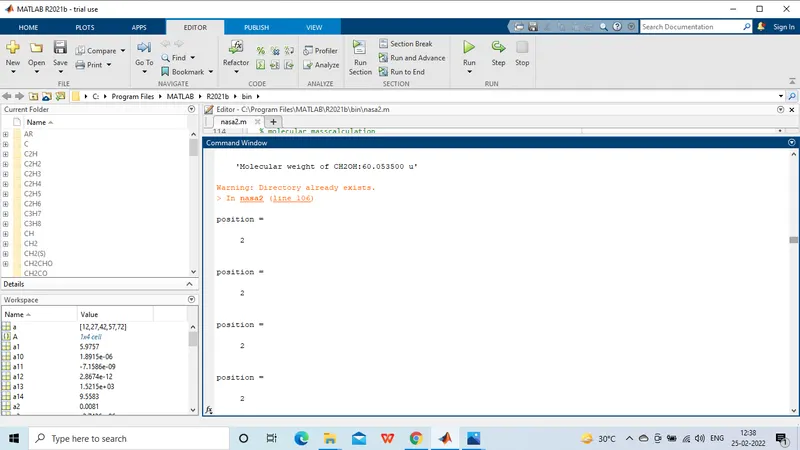
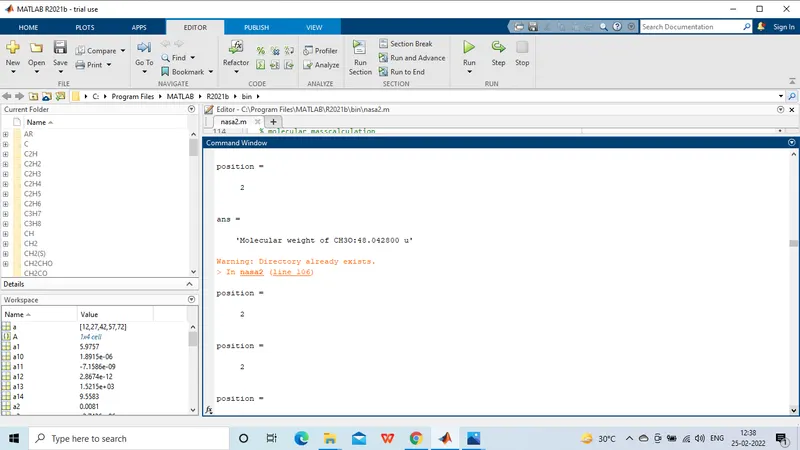
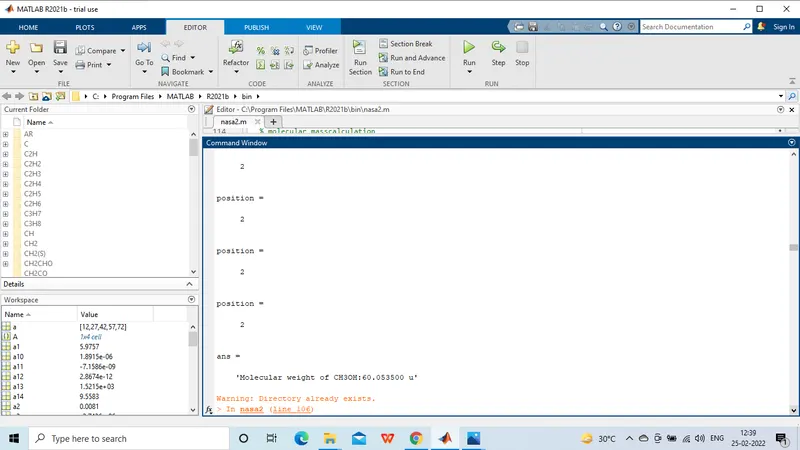
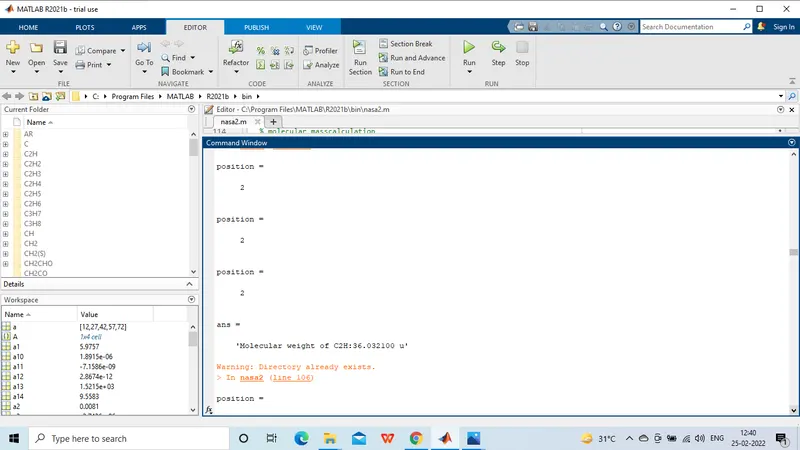
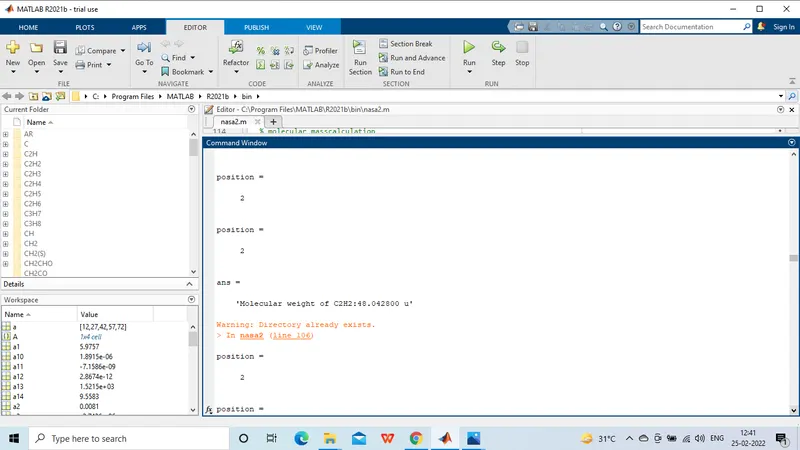
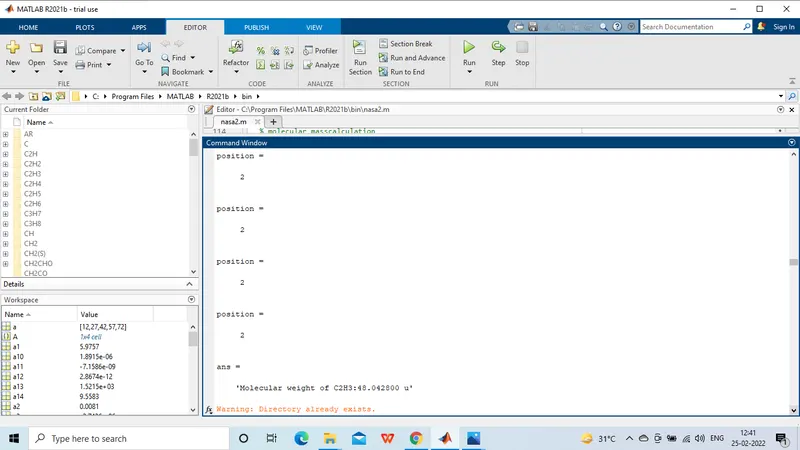
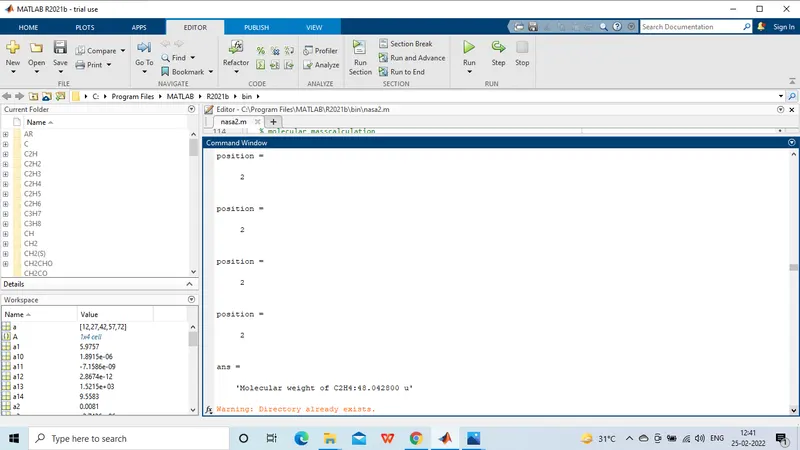
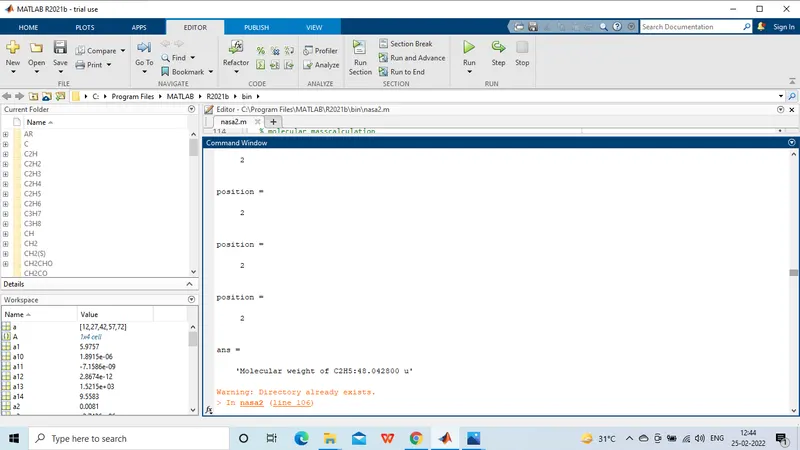
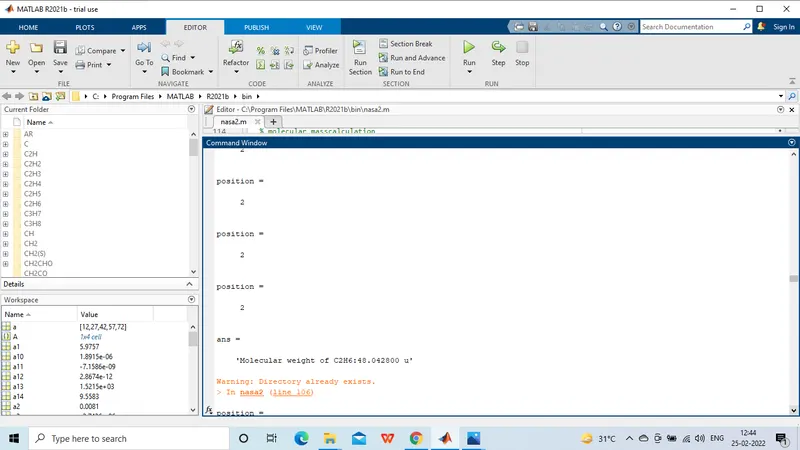
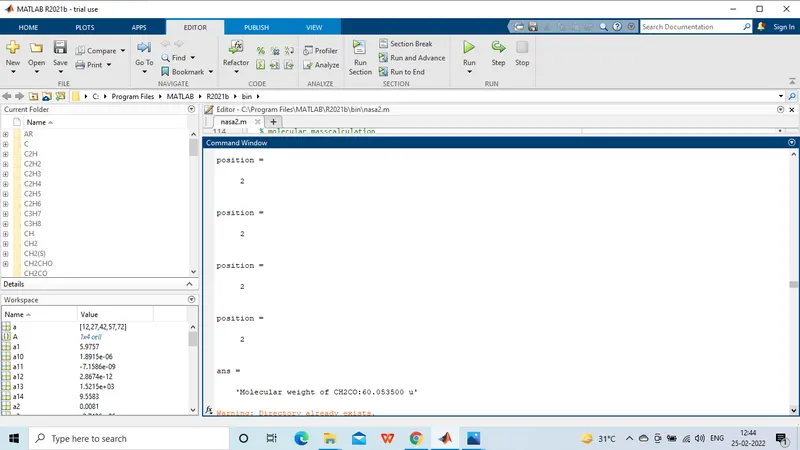
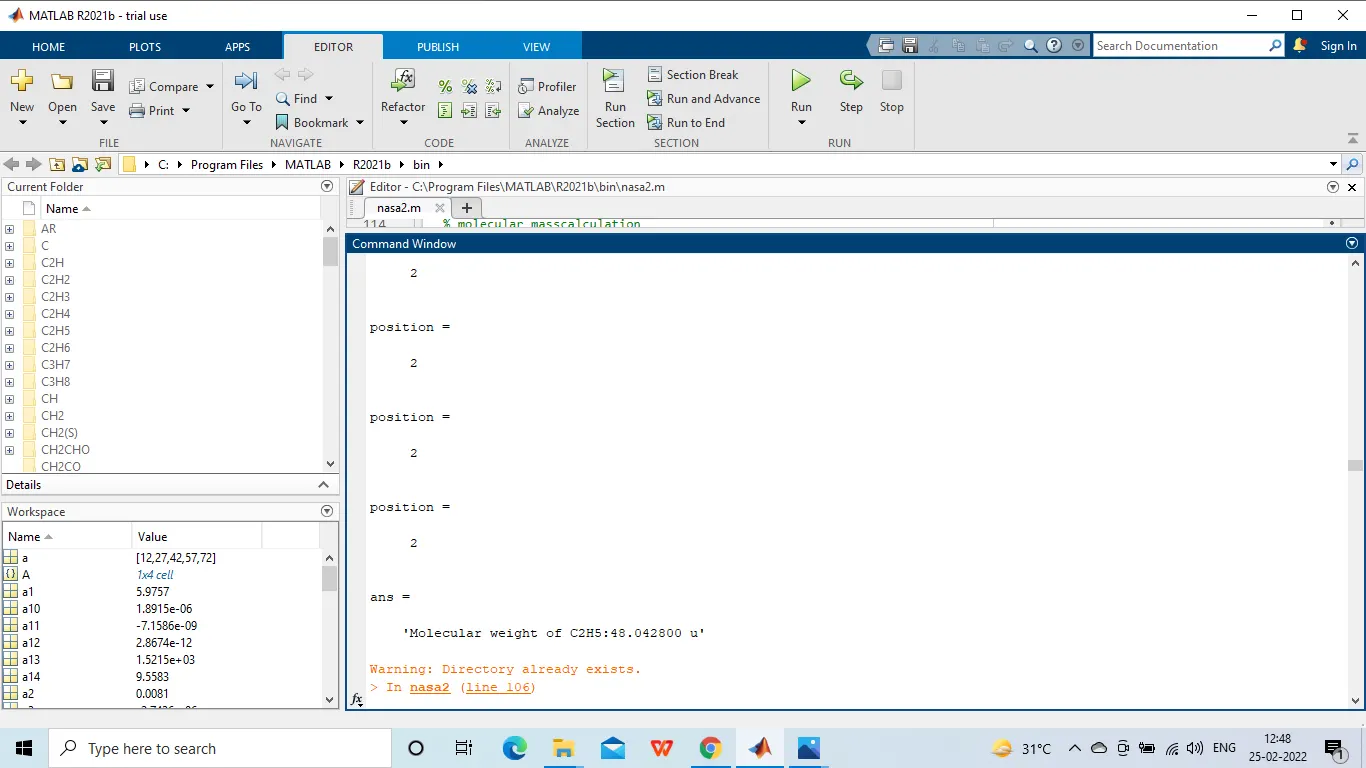
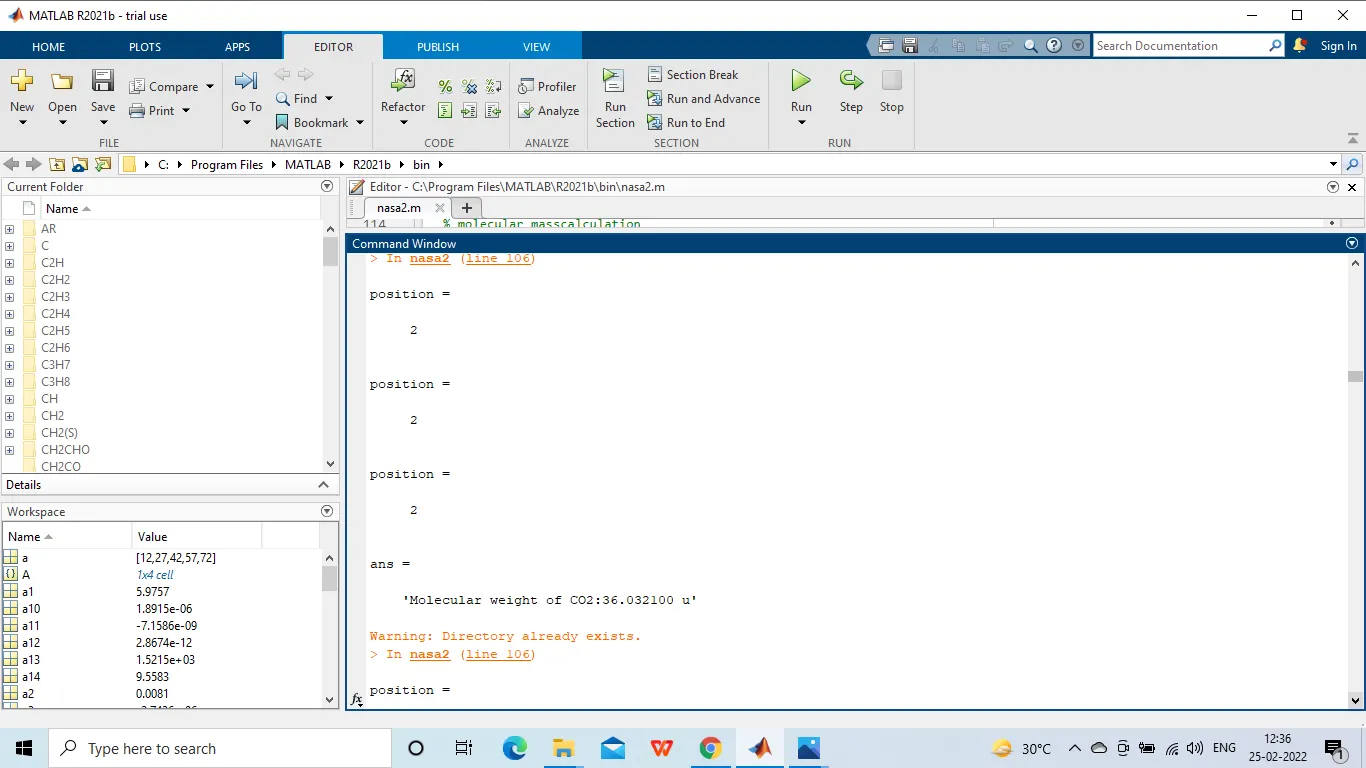
3. to calculate the molecular weight of each species and display in the command window
4. finally , we have plot the enthalphy,entrophy, specific heat for the local temperature range
5. we have calculate the low temperatures and higher temperature.
6. the main program we have saved as 'thermo.dat' file.
7. input generate cp,H,s
8. plots for O2,N2,CO2, species
File parasing:- The file parasing is the process of anlyzing a string of symbols, either in natural language. the term parasing comes from pars means part of spreach.
some parasing alogrithms may generate a parasing in front of its list of parse trees of syntallically.
NASA THERMO DATA FILE:-
WHERE R = UNIVERSAL GAS CONSTANT
T = TEMPERATURE
CP = SPECIFIC HEAT[KJ]
S = ENTROPHY[KJ/MOL]
H = ENTHALPHY
a(i) = co-efficients
where i = 1to 14
Important definitions of specific heat, enthalphy, entrophy:-
specific heat:- specific heat , it is the quantity of heat required to rise the temperature of one gram of a substance by a celcius degree. the inputs of specific heat are usually calories or joules per gram celcius degree.
cp = R*(a1+(a2*T)+(a3*T.^2)+(a4*T.^3)+a5*(T).^4......................[1]
Enthalphy:- Enthalphy is the measurement of energy in a thermodynamic system. the quantity of enthalphy equals to the total content heat of system, equivalent to the systems internal energy plus the product of volume and pressure.
H = R*T*(a1+((a2*T)/2)+((a3*T.^2/3)+((a4*(T).^3/4+((a5*(T).^4/5)+((a6./T)).......................[2]
Entrophy:- the second law of thermodynamics states that the total entrophy of a system either increase or remains constant in any spontenous process . it never decreases.
s = R*(a1.*log(T)+(a2*T)+(a2*T)+((a3*T.^2/2)+((a4*T.^3/3)+((a5*T.^4)+a7)..........................[3].
steps:-
1. Thermo.dat file [input parameter].
2. fgetl[we read temperature and split the temperature].
3. strsplit(convert in to cell array).
4. str2num[to find lower temperature and higher temperature].
5. mkdir [ to create the file folder].
6. cd [ change in to the directory]
Findings of nasa thermodynamic data:-
[a]. local tempeatures and higher temperatures.
[b]. enthalphy, entrophy, specific heat.
[c]. molecular weight.
MAIN CODE OF NASA THERMO DYNAMIC DATA:-
clear all
close all
clc
% getting the data file
f1 = fopen('Thermo.dat','r');
fgetl(f1);
% reading the header information
tline = fgetl(f1);
A = strsplit(tline,' ');
global_low_temp = str2num(A{2});
global_mid_temp = str2num(A{3});
global_high_temp = str2num(A{4});
fgetl(f1);
fgetl(f1);
fgetl(f1);
for i = 1:53
l1 = fgetl(f1);
m = strsplit(l1,' ');
species_name = m{1};
endl = length(m);
local_low_temp = str2num(m{endl-3});
local_high_temp = str2num(m{endl-2});
local_mid_temp = str2num(m{endl-1});
tline1 = fgetl(f1);
a = findstr(tline1,'E');
a1= tline1(1:a(1)+3);
a1 = str2num(a1);
a2 = tline1(a(1)+4:a(2)+3);
a2 = str2num(a2);
a3 = tline1(a(2)+4:a(3)+3);
a3 = str2num(a3);
a4 = tline1(a(3)+4:a(4)+3);
a4 = str2num(a4);
a5= tline1(a(4)+4:a(5)+3);
a5 = str2num(a5);
tline2 = fgetl(f1);
b = findstr(tline2,'E');
a6 = tline2(1:b(1) +3);
a6 = str2num(a6);
a7 = tline2(b(1)+4:b(2)+3);
a7= str2num(a7);
a8 = tline2(b(2)+4:b(3)+3);
a8 = str2num(a8);
a9 = tline2(b(3)+4:b(4)+3);
a9 = str2num(a9);
a10 = tline2(b(4)+4:b(5)+3);
a10 = str2num(a10);
tline3 = fgetl(f1);
c = strfind(tline3,'E');
a11 = tline3(1:c(1)+3);
a11 = str2num(a11);
a12 = tline3(c(1)+4:c(2)+3);
a12 = str2num(a12);
a13 = tline3(c(2)+4:c(3)+3);
a13 = str2num(a13);
a14 = tline3(c(3)+4:c(4)+3);
a14 = str2num(a14);
T = linspace(200,350,1000);
R = 8.314;
% to get array of specific heat,enthalphy and entrophy
% for i = 1:length(T)
% to compare the species temperature to assign the co-efficients
% a1-a7(high temperature co-efficients), a8-a14(low temperature
% co-efficients)
if(T>local_mid_temp)
% high temperature coefficients.
cp = (a1+a2*T+a3*T.^2+a4*T.^3+a5*T.^4)*R;
H = (a1+(a2*T)/2+(a3*T.^2)/3+(a4*T.^3)/4+(a5*T.^4)/5+(a6./T))*R.*T;
S = a1*log(T)+a2*T+(a3*T.^3)/2+(a4*T.^3)/3+(a5*T.^4)/4+a7;
% low temperatures coefficients
else
cp = (a8+a9*T+a10*T.^2+a11*T.^3+a12*T.^4)*R;
H = (a8+(a9*T))/2+(a10*T.^2)/3+(a11*T.^3)/4+(a12*T.^4)/5+(a13./T)*R.*T;
S = a8*log(T)+a9*T+(a10*T.^2)/2+(a11*T.^3)/3+(a12*T.^4)/4+a14;
end
figure(1)
plot(T,cp)
xlabel('temp');
ylabel('specific heat');
figure(2)
plot(T,S)
xlabel('temp');
ylabel('entropy');
figure(3)
plot(T,H)
xlabel('temp');
ylabel('enthalphy');
grid on
mkdir(species_name);
cd (species_name);
saveas(1,'tempvscp','jpg');
saveas(2,'tempvsentropy','jpg');
saveas(3,'tempvsenthalphy','jpg');
cd ..('c\users\bin\skilllync')% changing directory to original mat lab path
% molecular_masscalculation
elements = ['H','C','O','N','A'];
atomic_weight = [1.0079 12.0107 15.999 14.00673 39.948];
mol_mass = 0;
for i = 1:length(species_name)
for m = 1:length(atomic_weight)
if strcmp(species_name(1),elements(m))
mol_mass = mol_mass+atomic_weight(m);
position = m
end
end
n = str2double(species_name(1));
if n>1
mol_mass = mol_mass+atomic_weigtht(position)*(n-1);
end
end
sprintf('Molecular weight of %s:%f u', species_name,mol_mass)
end
fclose(f1)
screen shots of main program:-
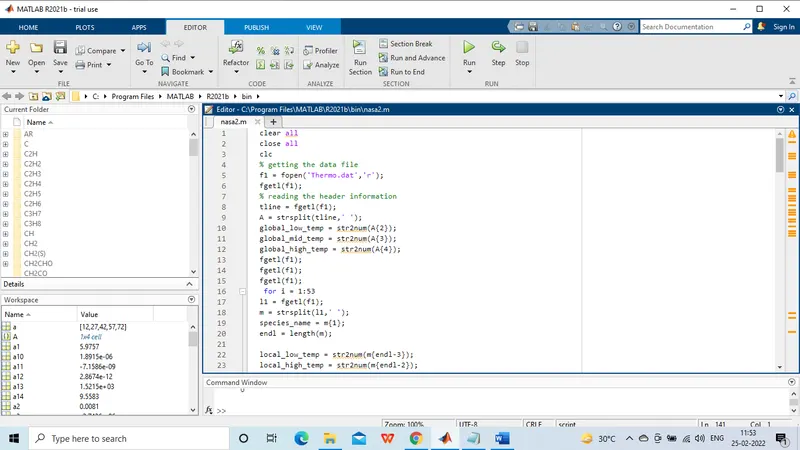
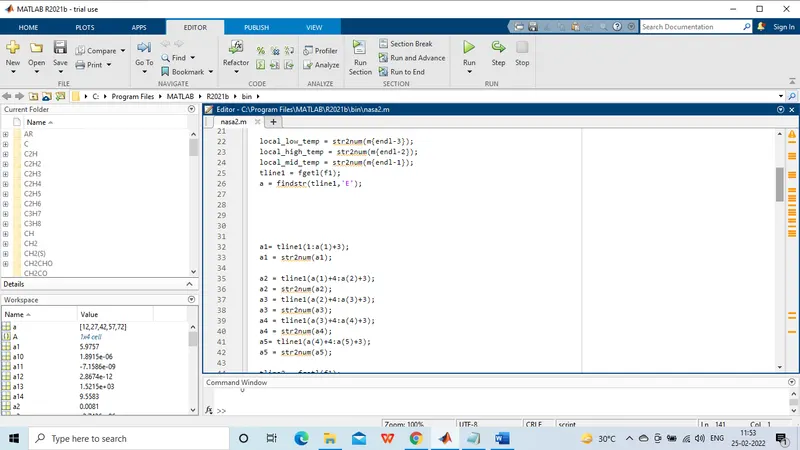
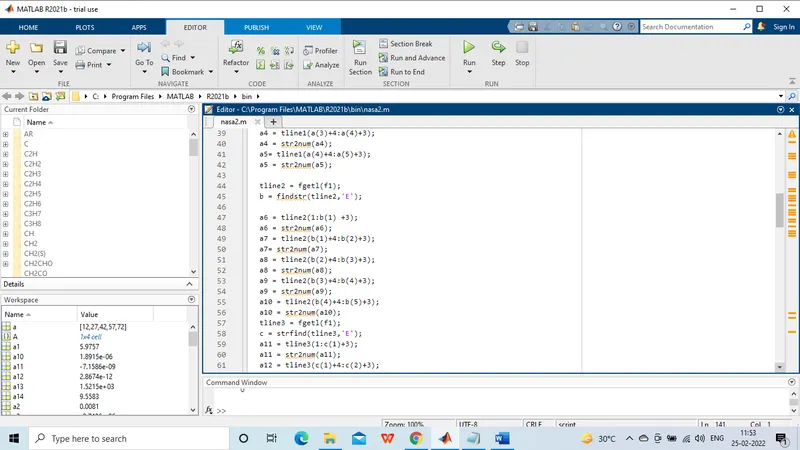
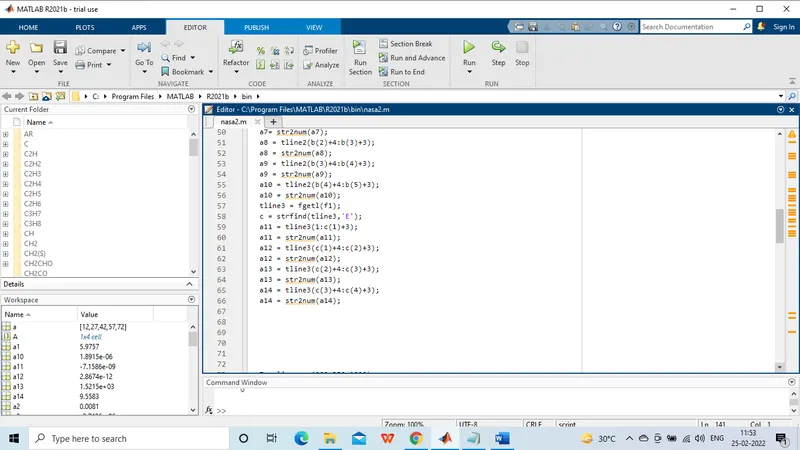
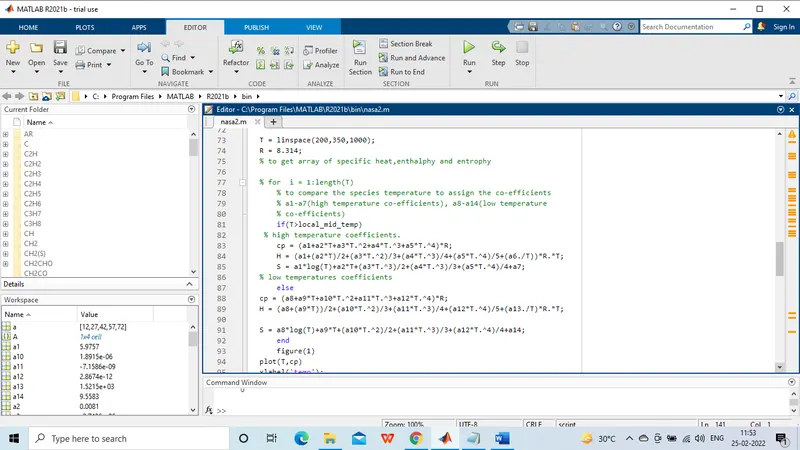
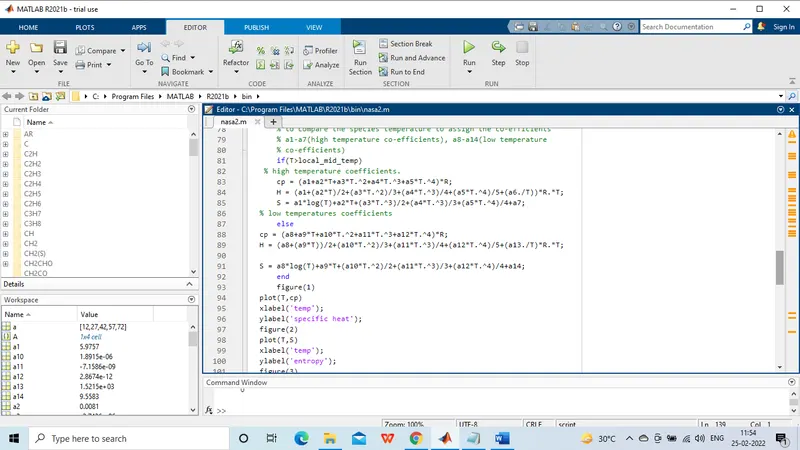
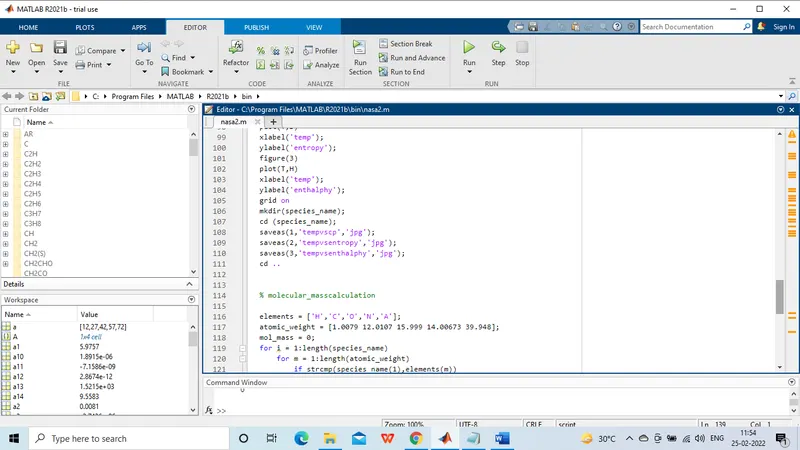
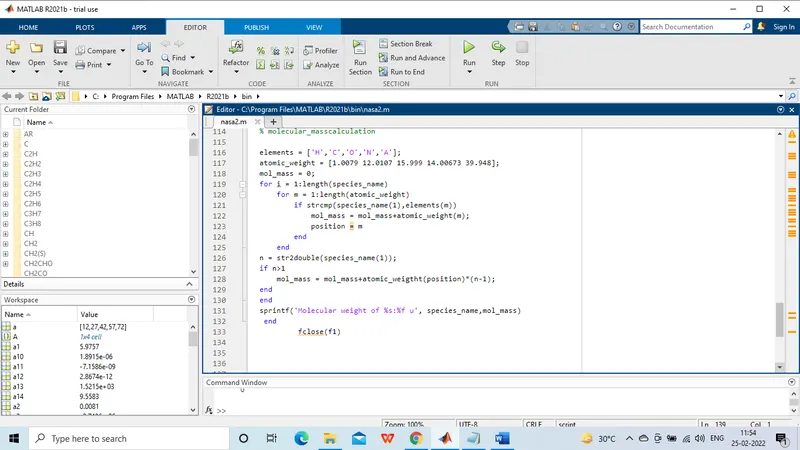
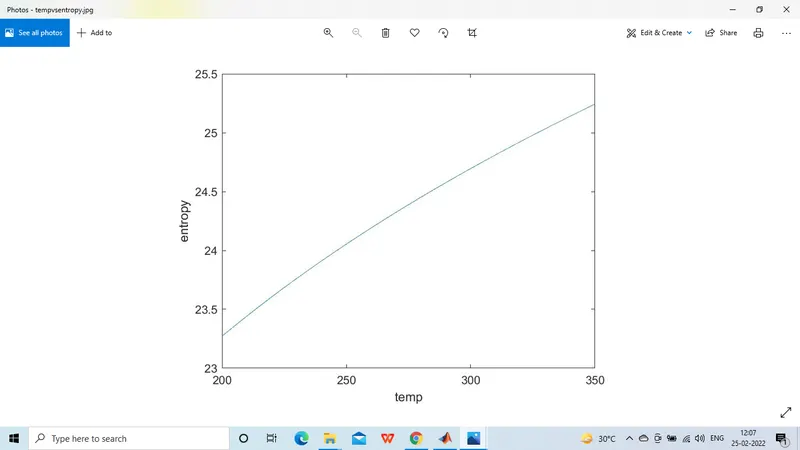
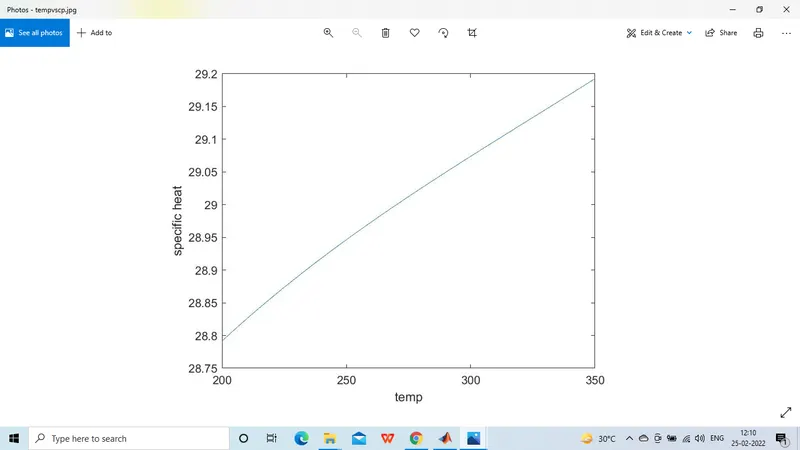
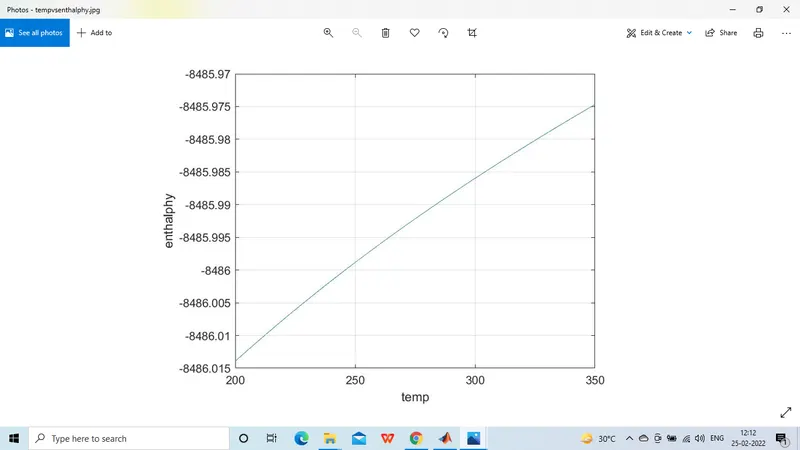
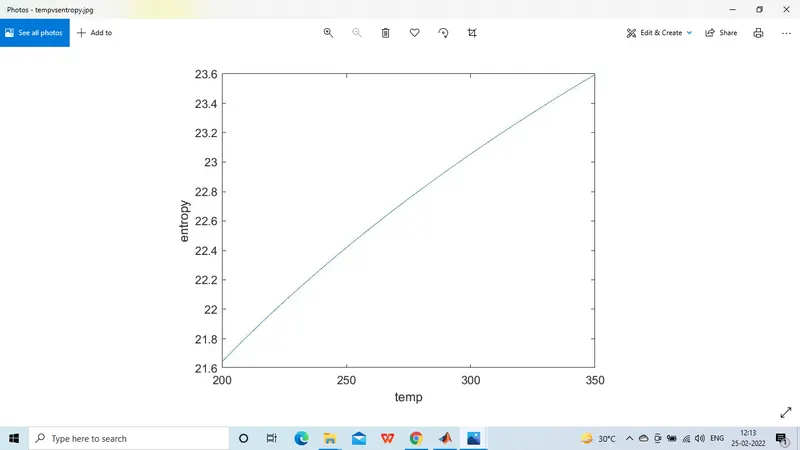
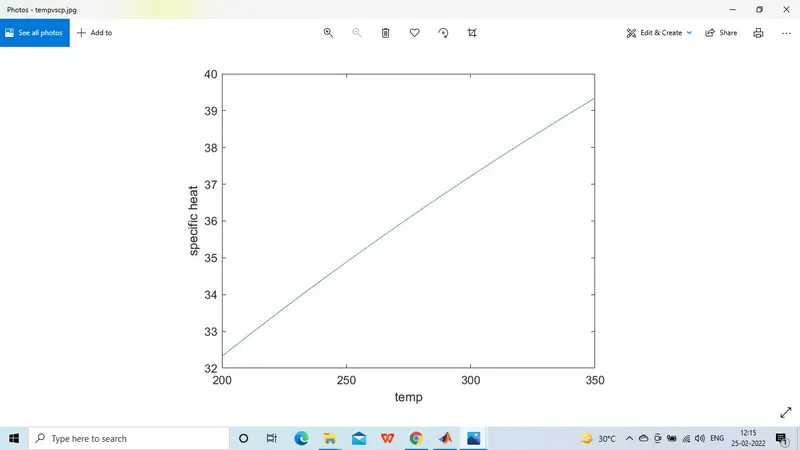
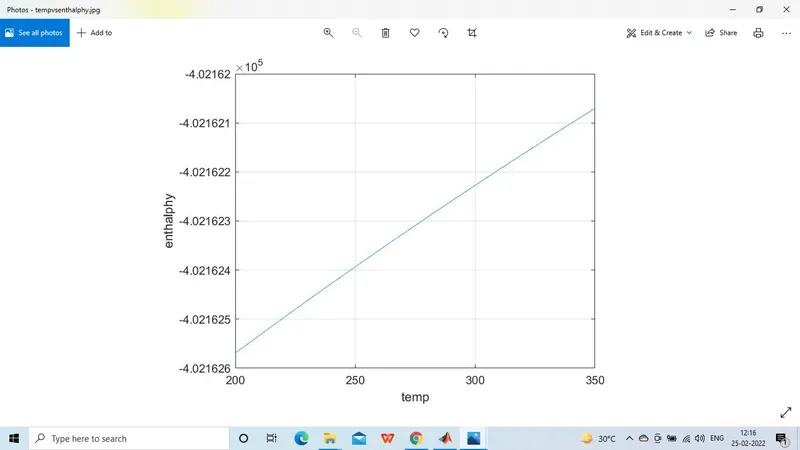
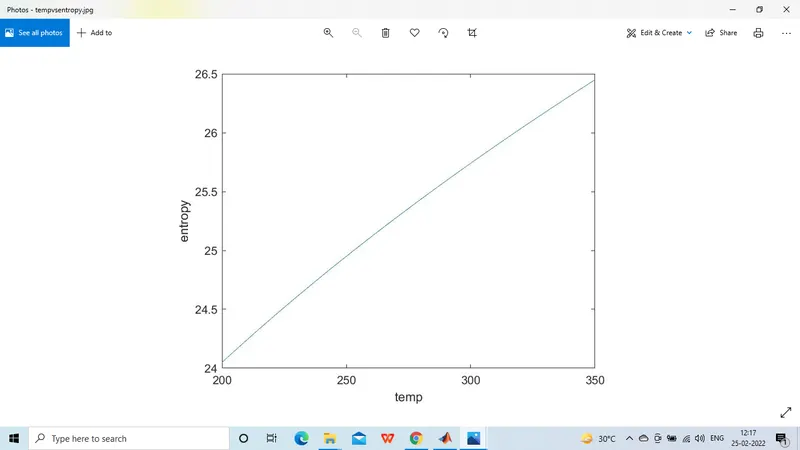
GRAPHS O2,N2,CO2:-
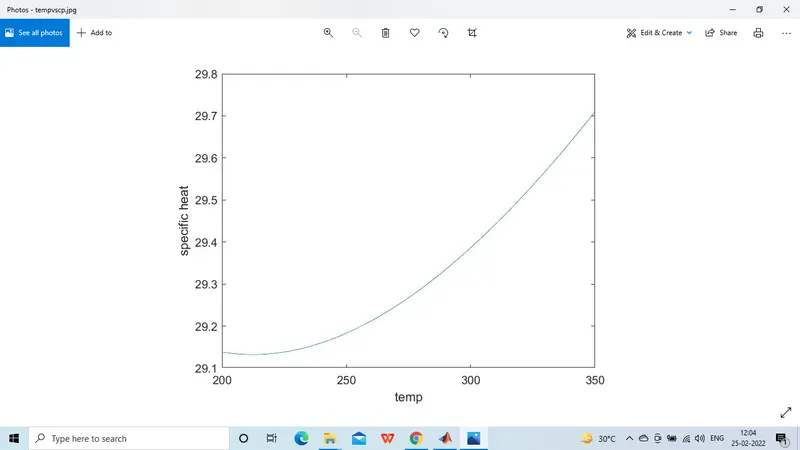
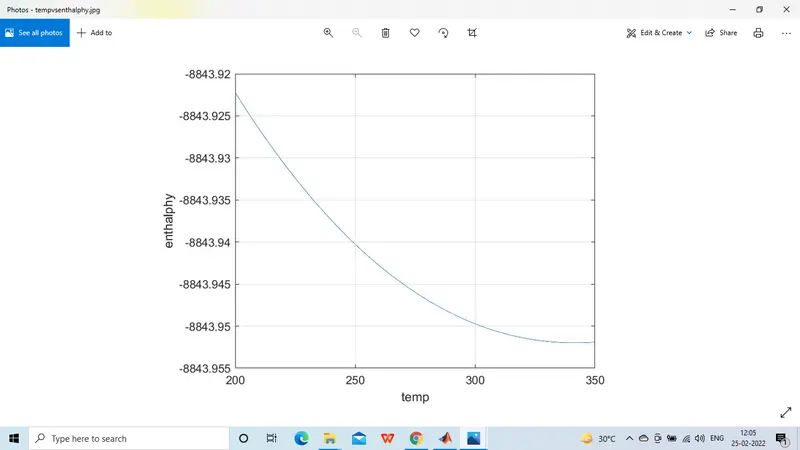
O2 GRAPH:-
TEMPERATURE VS SPECIFIC HEAT:-
TEMPERATURE VS ENTHALPHY:-
ENROPHY VS TEMP
N2 GRAPHS:-
C02 GRAPHS:-
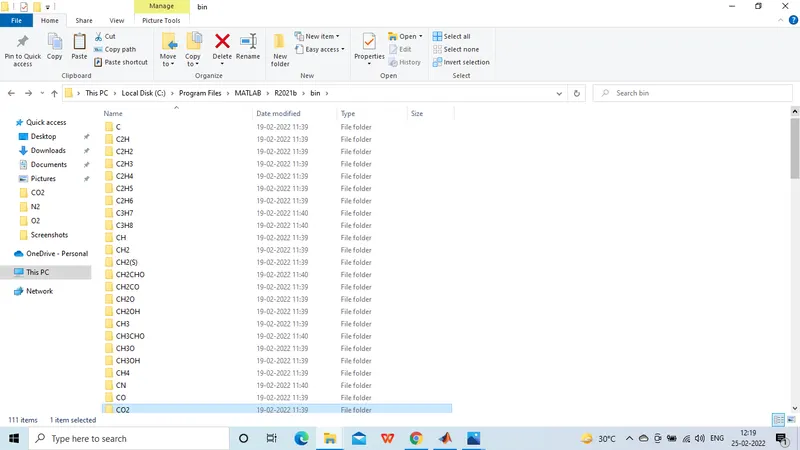
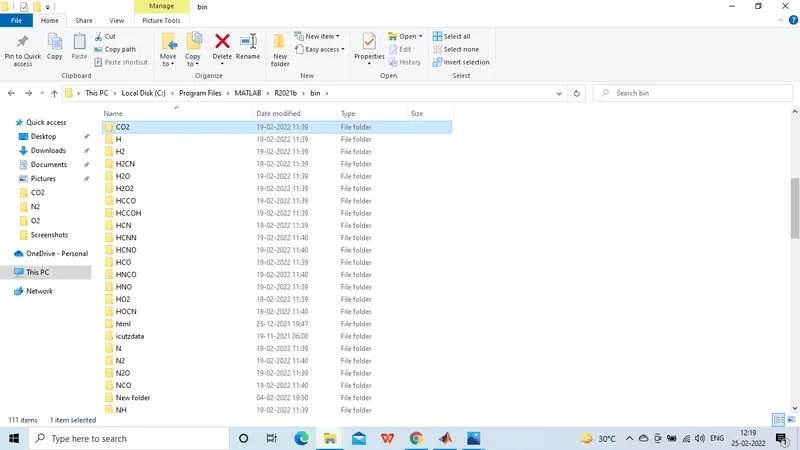
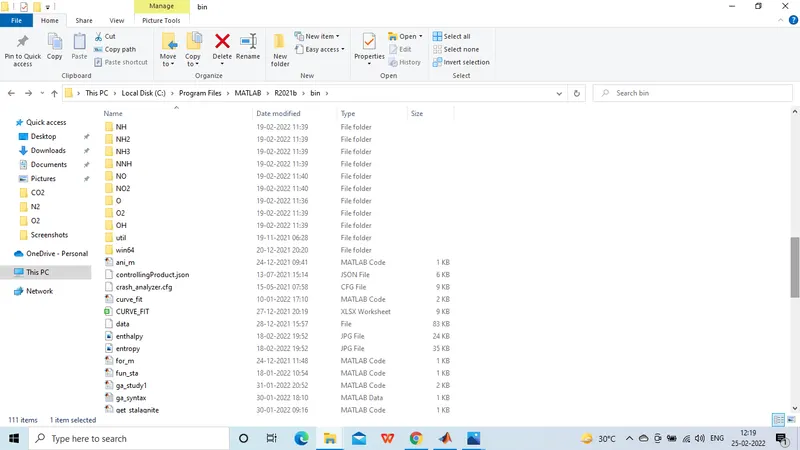
FOLDERS LIST OF 53 SPIECIS:-
MOLECULAR WEIGHT OF SPECIES:-