Project 1 - Parsing NASA thermodynamic data
Parsing NASA Thermodynamic Data (MATLAB)
Aim- The aim of this project is to write a MATLAB/OCTAVE for performing parsing of NASA Thermodynamic Data File and calculation of thermodynamic properties of each species.
Objectives-
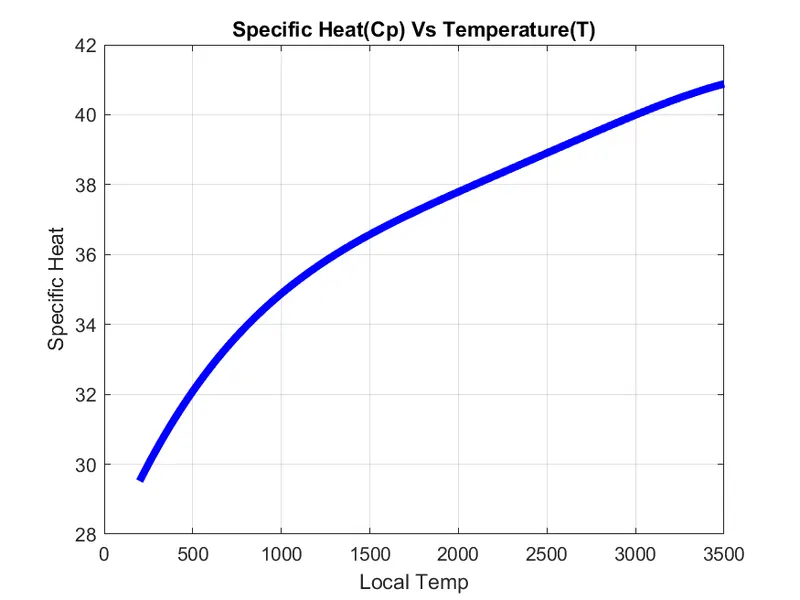
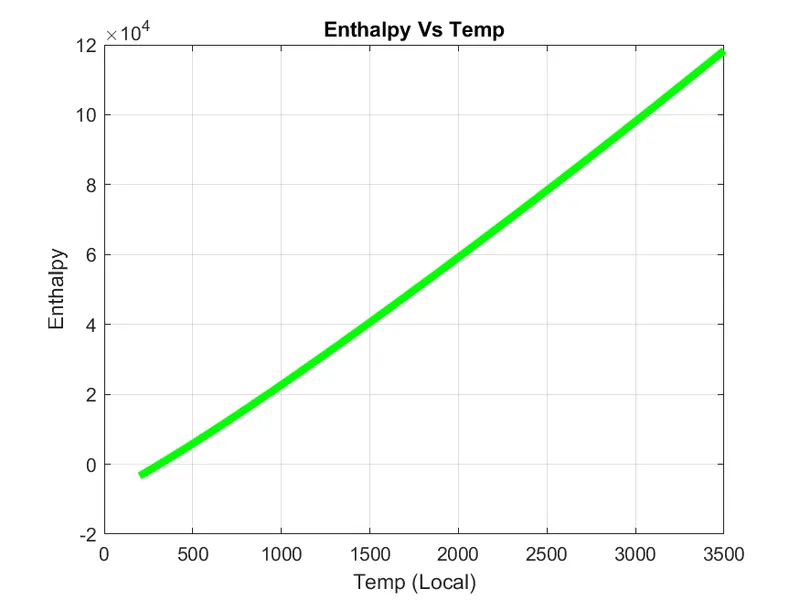
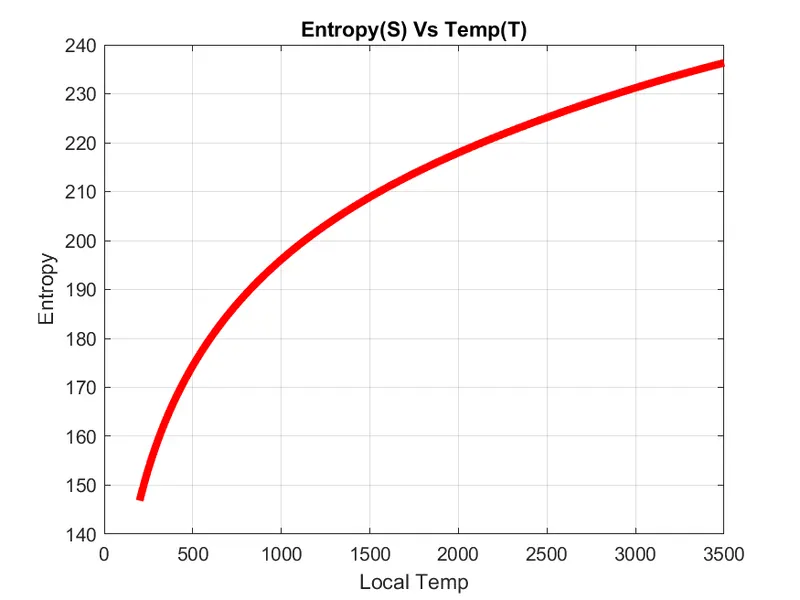
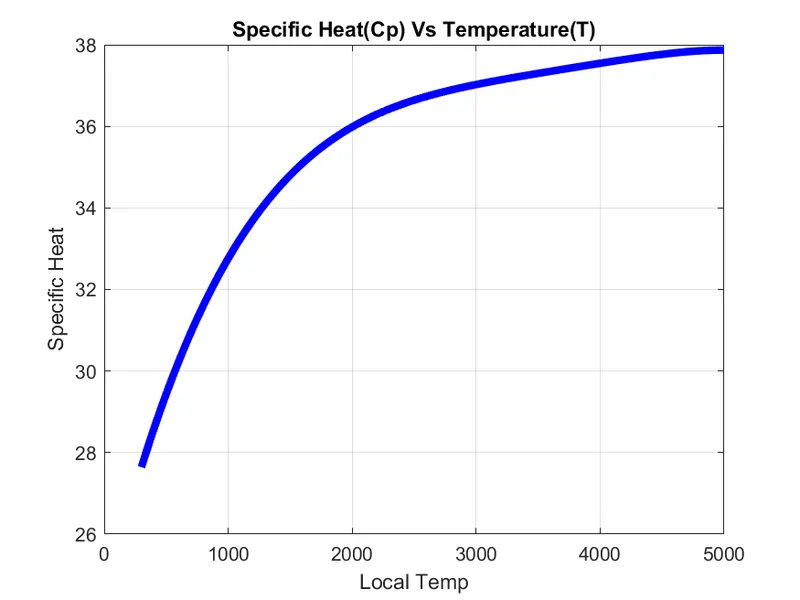
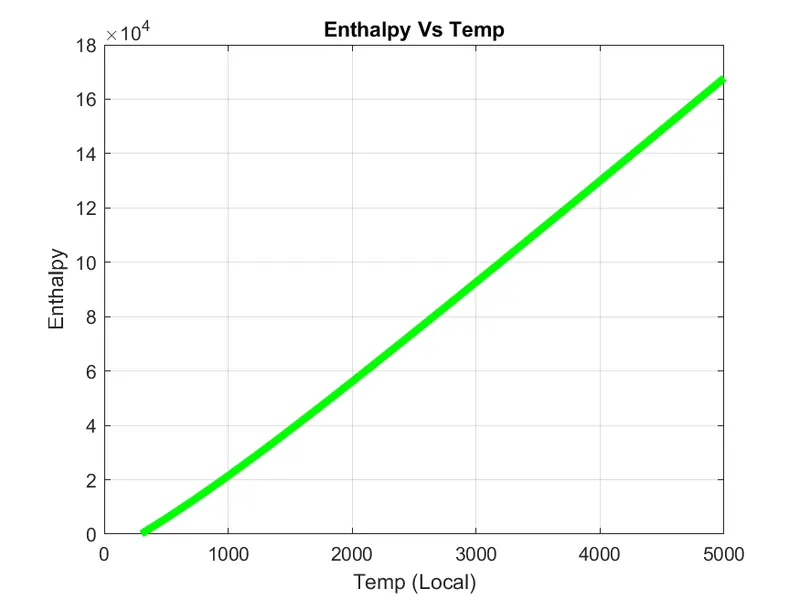
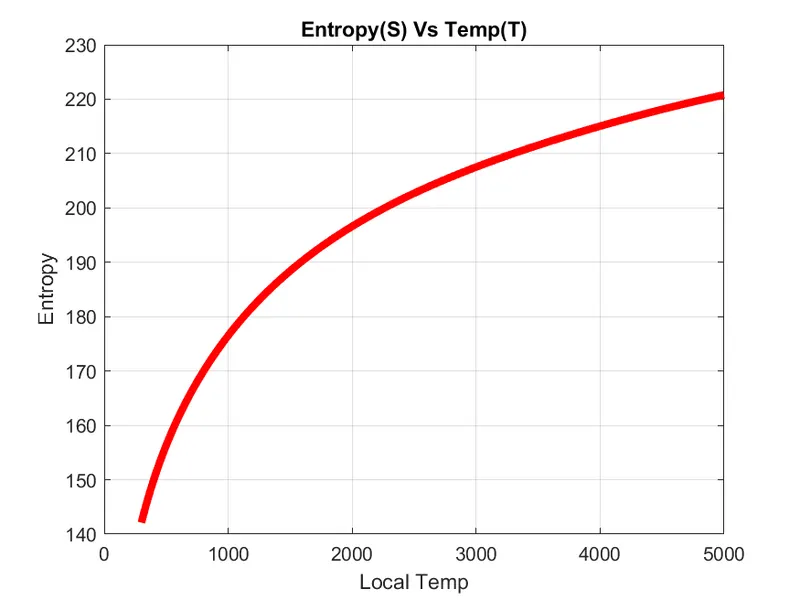
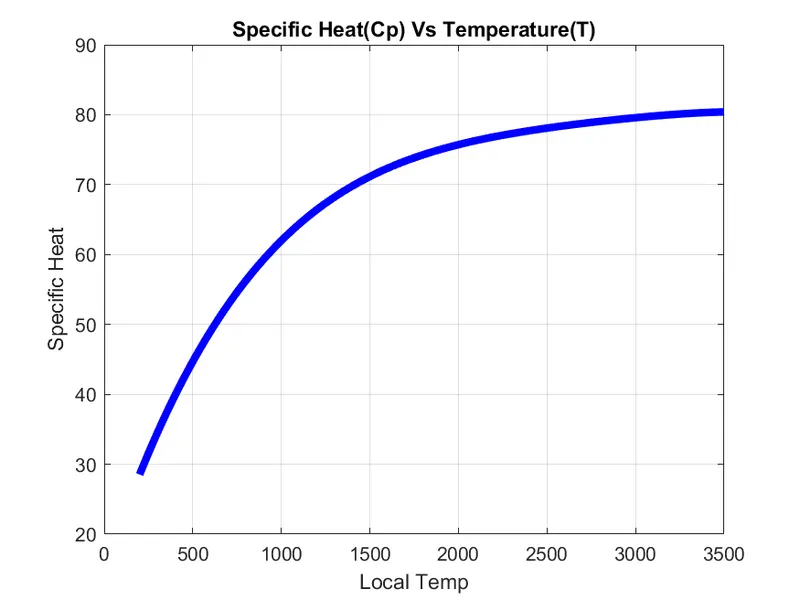
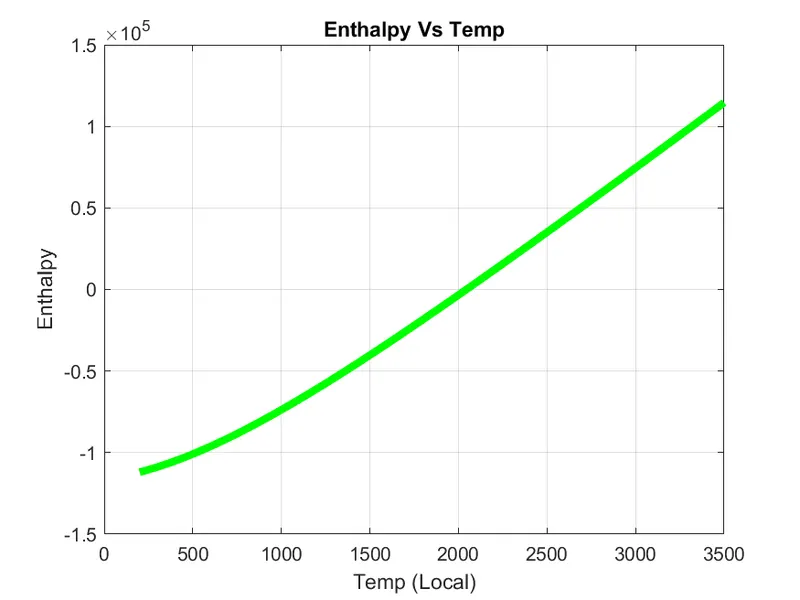
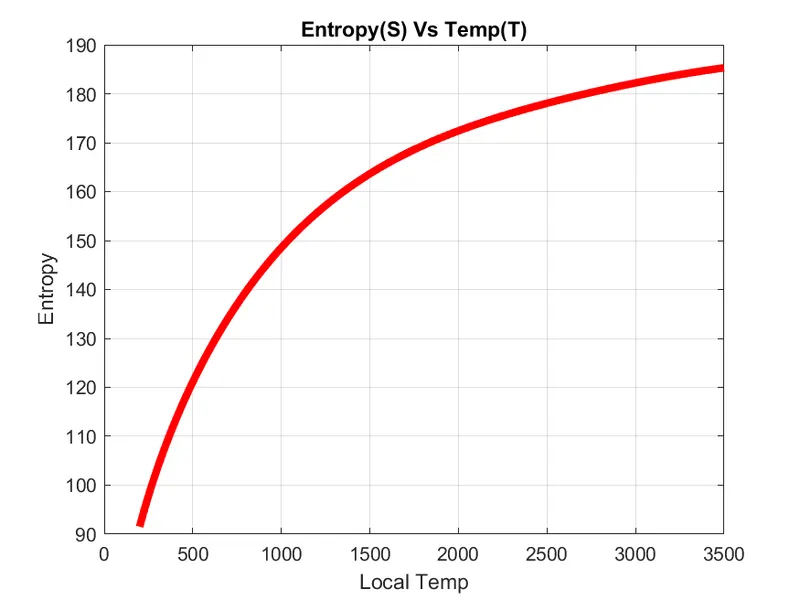
a) Plotting the specific heat(Cp), enthalpy(H) and entropy(S) for the local temperature range by writing a function.
b) Extraction of all 14 coefficients for all the given species from the given file by writing a function.
c) Calculation of molecular weight of species by writing a function.
d) Calculation of specific heat(Cp), enthalpy(H) and entropy(S) for the local temperature range by writing a function.
Basic Temanology-
- Parsing or syntax analysis, or syntactic analysis is the process of analyzing a string of symbols, either in natural language, computer language, or data structures, conforming to the rules of formal grammar. The term Parsing comes from Latin.
- Within computational linguistics the term is used to refer to the formal analysis by a computer of a sentence or other string of words into its constituents, resulting in a parse tree showing their syntactic relation to each other, which may also contain semantic and other information (pvalues). Some parsing algorithms may generate a parse forest or list of parse trees for syntactically ambiguous input.
- So basically parsing of a file implies 'splitting' i.e data from an external file can be read, split, stored, or manipulated and used in a computer program. By doing this a string is split into parts which are subsequently recognized and converted into something simpler than a string.
- Specific Heat- Specific heat is the amount of heat energy required to raise the temperature of the body per unit of mass. Specific heat is also known as specific heat capacity or mass-specific heat. In SI units, specific heat is the amount of heat in joules required to raise 1 gram of a substance 1 Kelvin.
- Enthalpy- When a substance changes at constant pressure, enthalpy tells how much heat and work was added or removed from the substance. Enthalpy is similar to energy but not the same. When a substance grows or shrinks, energy is used up or released.
- Entropy- The entropy of an object is a measure of the amount of energy that is unavailable to do work. Entropy is also a measure of the number of possible arrangements of atoms a system can have. In this sense, entropy is the measure of uncertainty or randomness.
- Gas Constant- The gas constant is a physical constant denoted by R and is expressed in terms of units of energy per temperature increment per mole. The gas constant value is equivalent to the Boltzmann constant but expressed as the pressure-volume product instead of energy per increment of temperature per particle.
- Molecular Weight- Molecular weight is a measure of the sum of the atomic weight values of the atoms in a molecule. Molecular weight is used in chemistry to determine stoichiometry in chemical reactions and equations.
- Thermodynamic properties like Enthalpy, Entropy, Specific Heat for various species values at different temperatures are required to extensively analyze the thermodynamics process. For example, if the combustion process is considered during this, these quantities are required to observe how the combustion is going on and how efficient it will be. It eventually allows seeking the scope of improvement in the process. Similarly in the other processes like refrigeration, air conditioning, chemical kinetics, nozzle flow, detonation process, etc, these quantities are widely involved to observe the phenomenon.

Where,
R = Universal gas constant
T = Temperature
Cp = Specific Heat (K)
S = Entropy (kJ/mole-K)
H = Enthalpy (kJ/mole)
- Creating function For calculating Cp , H , S -
% Function for Calculation of Cp,Entropy & Enthalpy
% for the local temp range, specific for each species

function [ Cp H S ]=Func(A1,A2,A3,A4,A5,A6,A7,a1,a2,a3,a4,a5,a6,a7,T,G_mid_T)
% T = Temp. Range
% Cp = Specific Heat of species at constant Pressure
% H = Enthalpy
% G_mid_T = Global Mid Temp.
% S = Entropy

% R = Gas Constant
R = 8.314;


for q = 1: length(T)
if T(q) >= G_mid_T
Cp = (A1+ (A2.*T) + (A3.*T.^2) + (A4.*T.^3) + (A5.*T.^4)) * R ;
H = (A1+(A2.*(T./2))+(A3.*(T.^2)./3)+(A4.*(T.^3)./4)+(A5.*(T.^4)./5)+(A6./T)).*(T.*R);
S = ((A1.* log(T))+(A2.*T)+(A3.*T.^2)+(A4.*T.^3)+(A5.*T.^4)+A7)* R ;
else
Cp =(a1+ (a2.*T) + (a3.*T.^2) + (a4.*T.^3) + (a5.*T.^4)) * R ;
H = (a1+(a2.*(T./2))+(a3.*(T.^2)./3)+(a4.*(T.^3)./4)+(a5.*(T.^4)./5)+(a6./T)).*(T.*R);
S = ((a1 *log(T))+(a2.*T)+(a3 *T.^2)+(a4.*T.^3)+(a5.*T.^4)+a7)* R ;
end

end- To calculate Molecular Weight of the species-
% Function for callculation of Molecular Weight
function MW= Mol_Wt(species)
atoms={'H','C','N','O','A'};
% H=Hydrogen(1), C=Carbon(12), N=Nitrogen(14), O=Oxygen(16), A=Argon(40)
atomic_weight=[1 12 14 16 40];

MW=0;
for i=1:length(species)

for j=1:length(atomic_weight)

% for comparing atoms of the species with atoms
if (strcmp(species(i),atoms(j))==1)

MW = MW + atomic_weight(j);

% to find the position of atoms in the species
rank=j;

end
end


% For the weights of the repeating atoms
m=str2num(species(i));
if m>1
n=m-1;
MW=MW+atomic_weight(rank)*(n);

end
end

end
Main Program-
clc
clear all
close all

% Program for Parsing NASA thermodynamic data
% For opening the data file & set to read mode
file = fopen('THERMO.dat','r');

% To read the Header line(file name)
file_name = fgetl(file) ;

% To read the 1st line after Header
first_line = fgetl(file) ;


% To extract temp from 1st line
Global_Temp_Range=strsplit(first_line,' ');

% To get the Global low temperature
G_low_T = str2num(Global_Temp_Range{2});

% To get the Global mid temperature
G_mid_T = str2num(Global_Temp_Range{3});

% To get the Global high temperature
G_high_T = str2num(Global_Temp_Range{4});

for i= 1:3
a= fgetl(file) ; % To read the next 3 lines after first line

end


for j= 1:53

%To read 1st line of species,as ranked 1 on RHS of data file
line_1 = fgetl(file);

% To split 1st line
L1 = strsplit(line_1,' ');

% To extract Species from 1st line
species = (L1{1});

% To find the position of G in 1st line
G = strfind(line_1,'G ');

% To extract LOCAL Low Temperature
L_low_T = str2num(line_1(G+3:G+10));

% To extract LOCAL High Temperature
L_high_T = str2num(line_1(G+12:G+20));

% To extract LOCAL Midium Temperature
L_mid_T = str2num(line_1(G+22:G+30));

% To set a range of Local Temperature
T = linspace(L_low_T,L_high_T,500);

%To read 2nd line of species,as ranked 2 on RHS of data file
line_2 = fgetl(file);

% To find the position of E in 2nd line
L2 = strfind(line_2,'E');

% To extract 1st coefficient for High Temperature
A1 = str2num(line_2(1:L2(1)+3));

% To extract 2nd coefficient for High Temperature
A2 = str2num (line_2(L2(1)+4:L2(2)+3));

% To extract 3rd coefficient for High Temperature
A3 = str2num (line_2(L2(2)+4:L2(3)+3));

% To extract 4th coefficient for High Temperature
A4 = str2num (line_2(L2(3)+4:L2(4)+3));

% To extract 5th coefficient for High Temperature
A5 = str2num (line_2(L2(4)+4:L2(5)+3));

%To read 3rd line of species,as ranked 3 on RHS of data file
line_3 = fgetl(file);

% To find the position of E in 3rd line
L3 = strfind(line_3,'E');

% To extract 6th coefficient for High Temperature
A6 = str2num(line_3(1:L3(1)+3));

% To extract 7th coefficient for High Temperature
A7 = str2num (line_2(L3(1)+4:L3(2)+3));

% To extract 1st coefficient for Low Temperature
a1 = str2num (line_2(L3(2)+4:L3(3)+3));

% To extract 2nd coefficient for Low Temperature
a2 = str2num (line_2(L3(3)+4:L3(4)+3));

% To extract 3rd coefficient for Low Temperature
a3 = str2num (line_2(L3(4)+4:L3(5)+3));

%To read 4th line of species as ranked 4 on RHS of data file
line_4 = fgetl(file);

% To find the position of E in 4th line
L4 = strfind(line_4,'E');

% To extract 4th coefficient for Low Temperature
a4 = str2num(line_4(1:L4(1)+3));

% To extract 5th coefficient for Low Temperature
a5 = str2num (line_4(L4(1)+4:L4(2)+3));

% To extract 6th coefficient for Low Temperature
a6 = str2num (line_4(L4(2)+4:L4(3)+3));

% To extract 7th coefficient for Low Temperature
a7 = str2num (line_4(L4(3)+4:L4(4)+3));


% Function To Calculate Cp,Enthalpy and Entropy
[Cp,H,S] = Func(A1,A2,A3,A4,A5,A6,A7,a1,a2,a3,a4,a5,a6,a7,T,G_mid_T);

% To creat Folders with species name
% To give Folder names
Folder_name = sprintf('%d) [%s]',j, species);

% To specify the current directory
current_dir = pwd;

% All The Function Program And Thermodynamic Data file are stored in a folder,that specify current
% To creat a Folder
mkdir(Folder_name);

% To load plots in that new folder
cd(Folder_name);

figure (1);
plot(T,Cp,'b','linewidth',4)
grid on
xlabel('Local Temp');
ylabel('Specific Heat')
title('Specific Heat(Cp) Vs Temperature(T)')

% To give a name of the file
IMAGE1 = sprintf("Cp Vs T of [%s].png",species);

% To save the image file
saveas(gca,IMAGE1)
figure (2);
plot(T,H,'g','linewidth',4)
grid on
xlabel('Temp (Local)');
ylabel('Enthalpy')
title('Enthalpy Vs Temp')

% To give a name of the file
IMAGE2 = sprintf(" H Vs T of [%s].png",species);

% To save the image file
saveas(gca,IMAGE2)
figure (3);
plot(T,S,'r','linewidth',4)
grid on
xlabel('Local Temp');
ylabel('Entropy')
title('Entropy(S) Vs Temp(T)')

% To give a name of the file
IMAGE3 = sprintf("S Vs T of [%s].png",species);

% To save the image file
saveas(gca,IMAGE3)

% To give a path,return to current directory
cd(current_dir);

% Function To Calculate Molecular Weight
MW = Mol_Wt(species);

% To display as output
fprintf(' %d) Molecular Weight of [%s] is %d.',j,species,MW)

% To set the next output after 2 line interval
fprintf('  ')


end- First step is to clear all, close all, clc. The clear all command helps to clear the workspace. The close all command closes all figures and the clc command clears the command window.
- The fopen command is used in reading mode to read the THERMO.dat file.
- The temperature values are calculated by using strsplit,str2num commands.
- Then the comment lines are stored in three variables i.e., line3, line4, line5.
- The for loop is used to create an array that contains every line of the file.
- Then the coefficients are founded by using the findstr, str2num.
- Then the directory is created to save the plots in png format with species name.
- The cp, h, s functions are called to the main program which have been created separate script.
- Then the plots are created between temperature and cp, s, h.
- The saves are used to save the plots in png extension.
- Finally, the Mol_Wt function is called for calculating the molecular weight of the species.
- The fclose command is used to end the reading of the file.
Moleculer Weights in Command Window-

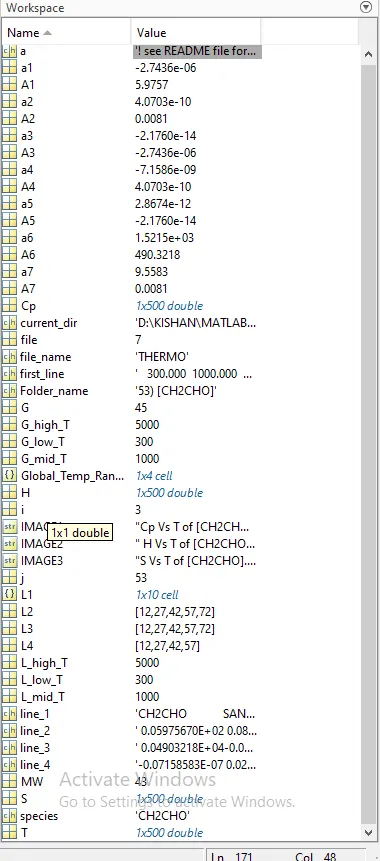
Workspace-
Plots for o2 species-
Cp vs T
H vs T
S vs T
Plots for N2 species-
Cp vs T
H vs T
S v T
Plots for Co2 species
Cp vs T
H vs T
S v T
Screenshot of the window where all the folders are saved:-

Conclusion-
Using MATLAB code, the necessary coefficients required to evaluate various thermodynamic parameters for different species are extracted from NASA thermodynamic data file. The specific heat, enthalpy, and entropy for all the species are calculated and plotted against the local temperature range. The molecular weight is calculated for all the species.This is the conclusion that I preferred.