Project 1 - Parsing NASA thermodynamic data
Aim:-1. Write a Matlab program that extracts the 14 co-efficients and calculates the enthalpy, entropy and specific heats for all the species in the data file. That we will be reading from the file NASA thermodynamic data.
2. Calculate the molecular weight of each species and display in the command window.
3. Plot the Cp, Enthalpy and Entropy for the local temperature range (low temperature : high temperature) specific for each species.
4. Save the plots as images with appropriate names and dump them in separate folders for each species with suitable name.
Theory:- In order to write a program in matlab that reads data from a file first we have to understand the concept of file parsing in matlab.Parsing: Parsing a file means reading in a data stream and building a memory model of the content of that data. This aims at facilitating perfoming some kind of transformation on the data. Parsing splits a file or other input into pieces of data that can be easily stored or manipulated.Here the file which we were given for our study was the file that consisted the nasa thermodynamic datas with the help of which we needed to calculate the enthalpy,entropy and the specific heats of the different species given in the file the formula for calculating the above quantities is given below
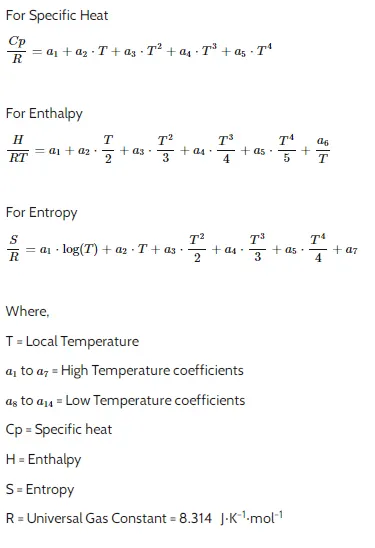
Matlab program:-So our main objective here is to extract the required coefficients from the data file along with the local high,low,middle temperatures that shall be used in order to calculate the required parameters.
clear all
close all
clc
f1=fopen('THERMO (1).dat','r') %Opening the data file
l1=fgetl(f1);                  %Getting the first two lines
l2=fgetl(f1);
A=strsplit(l2,' ');            %Splitting the second line for global temperatures
glo_low_temp=str2num(A{2});    %Converting string to numbers
glo_mid_temp=str2num(A{3});
glo_hi_temp=str2num(A{4});
Explanation;-*Here we use the fopen command to read from the file and used the fgetl() command to obtain the first line of the file every time we call fgetl it will give us the next line and store it as a string in an array.
*The global low and high temperatures were in the third line that we obtained first using getl and then by splitting them using the space marker and converted and stored into different variables using str2num() funtion.
*Now we need the speicies name and local temperatures for which we extract the line that contains these enteties and split them accordingly.
% Reading the heaader line to obtain species and local temperature
l6=fgetl(f1);
head=strsplit(l6,' ');         %Using the split command for splitting the obtained line
species_name=head{1};

l=length(species_name);
lo_low_temp=str2num(head{end-3});%Storing the local temperatures for the species
lo_hi_temp=str2num(head{end-2}); %The local temperatures are present at the end of the line
lo_mid_temp=str2num(head{end-1});%for which we use end-3 and 2 respectively
*After this we extract the coefficients for the data file and store them in variables for further use.
% Now we obtain the first 5 coefficients
coffl=fgetl(f1);
A1=strfind(coffl,'E');
a1=str2double(coffl(1:A1(1)+3));
a2=str2double(coffl(A1(1)+4:A1(2)+3));
a3=str2double(coffl(A1(2)+4:A1(3)+3));
a4=str2double(coffl(A1(3)+4:A1(4)+3));
a5=str2double(coffl(A1(4)+4:A1(5)+3));
%Now we obtain the next five coeeficients
coffl2=fgetl(f1);
A2=strfind(coffl2,'E');
a6=str2double(coffl2(1:A2(1)+3));
a7=str2double(coffl2(A2(1)+4:A2(2)+3));
a8=str2double(coffl2(A2(2)+4:A2(3)+3));
a9=str2double(coffl2(A2(3)+4:A2(4)+3));
a10=str2double(coffl2(A2(4)+4:A2(5)+3));
%Now we obtain the last 4 coefficients
coffl3=fgetl(f1);
A3=strfind(coffl3,'E');
a11=str2double(coffl3(1:A3(1)+3));
a12=str2double(coffl3(A3(1)+4:A3(2)+3));
a13=str2double(coffl3(A3(2)+4:A3(3)+3));
a14=str2double(coffl3(A3(3)+4:A3(4)+3));
*Here in the above code we obtain all the fourteen coefficients and then store them to find out the values of entropy, enthalpy and specific heat.
t=linspace(lo_low_temp,lo_hi_temp,1000); %Finding the values of enthalpy,entropy and specific heats with respect to temperature values
R=8.314;                                 %Value for the universal gas constant
for k=1:length(t)
    if t(k)
*Next we plot the graphs for the different species using the values of the temperatures and their cp,h,s datas.
%%Plotting the graphs of cp,h,s for the givne species
        figure(1)
        grid on
        plot(t,cp,'r')
        title(species_name)
        xlabel('Temperature');
        ylabel('Specific heat');


         figure(2)
        grid on
        plot(t,h,'b')
        title(species_name)
        xlabel('Temperature');
        ylabel('Enthalpy');


         figure(3)
        grid on
        plot(t,s,'g')
        title(species_name)
        xlabel('Temperature');
        ylabel('Entropy');
*After plotting all the graph we require to store these graphs in the respective folder of their species for which we used the mkdir() command that made a specific folder for each of the species and stored the graphs of the entropy,enthalpy and specific heats vs temperature for the species.
%Creating folders for storing graphs
mkdir(['File_parsing\',species_name]);
cd(['File_parsing\',species_name]);
saveas (1,'Specific Heat','png');
saveas (2,'Enthalpy','png');
saveas (3,'Entropy','png');
cd ..
cd ..
*Our next task is to determine the molecular weight for each of the species and display it in the command windows for which we use a function here moleweight that calculates the molecular weight of the given species.Here an if statement is used so as to check for the no of atoms in the molecule of the gas and add the atomic weight accordingly, the num-1 indicates that the atomic weight needed to be multiplied only once as initially while comparing the character the loop runs for once to calculate the molecular weight.
function [mm]=moleweight(species_name)

atoms=['H','C','N','O','A','S'];
atomic_weight=[1,12,14,16,40,32];
mm=0;

for i=1:length(species_name)
    for j=1:length(atoms)
        if strcmpi(species_name(i),atoms(j))
            mm=mm+atomic_weight(j);
            a=j;
        end

        num=str2num(species_name(i));
end
   if num>1
            mm=mm+atomic_weight(a)*(num-1);
   end
end
end
*And display it(the molecular weight) in the command window.
%Calculating molecular weight
mm=moleweight(species_name);         %Function calling process for calculating the molecular weight
f=sprintf('Molecular Weight of %s=%f ',species_name,mm); %Printing the values on the command window
disp(f);
end                                  %The main for loop ends here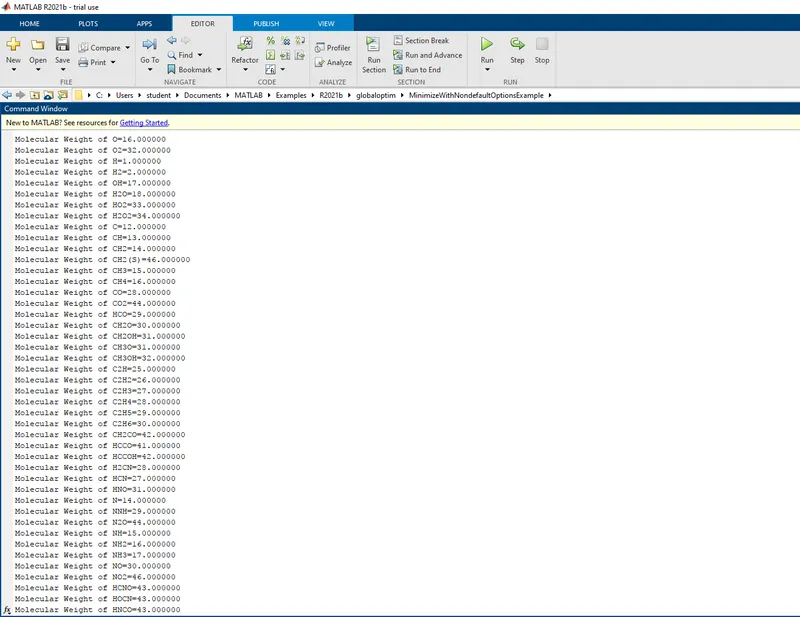
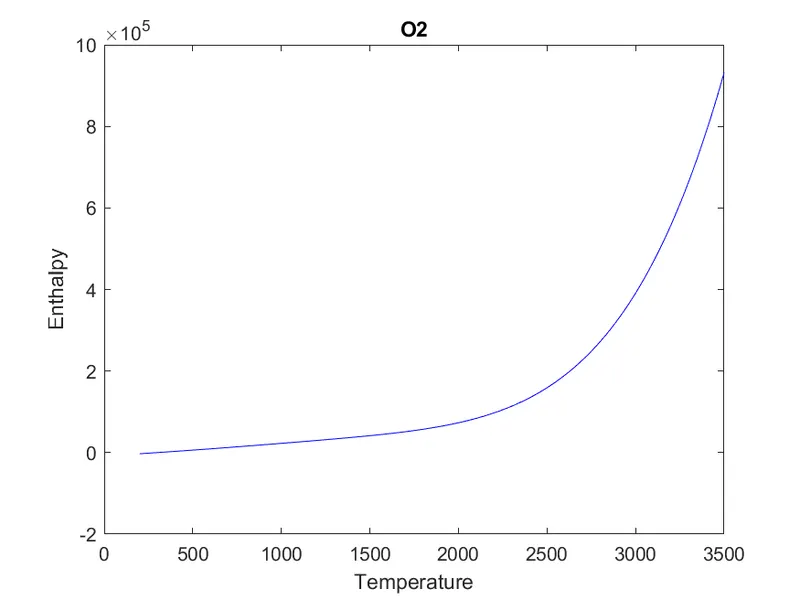
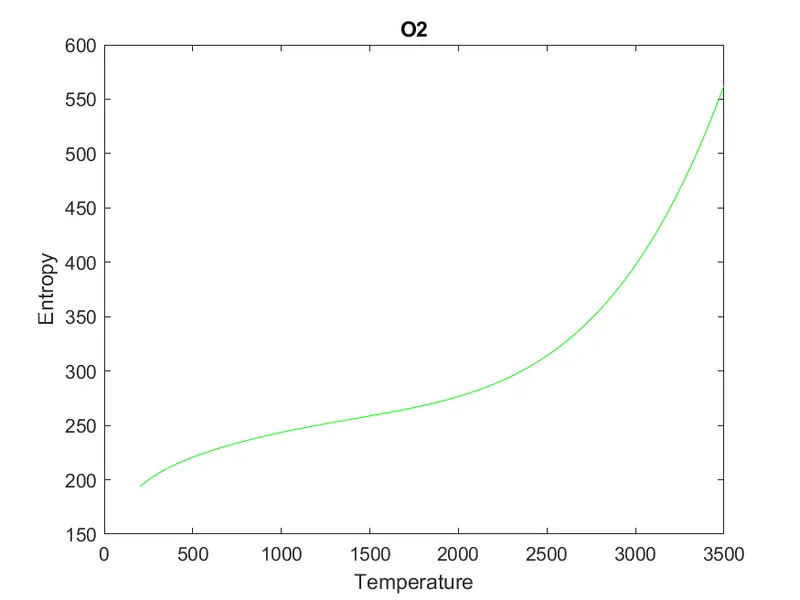
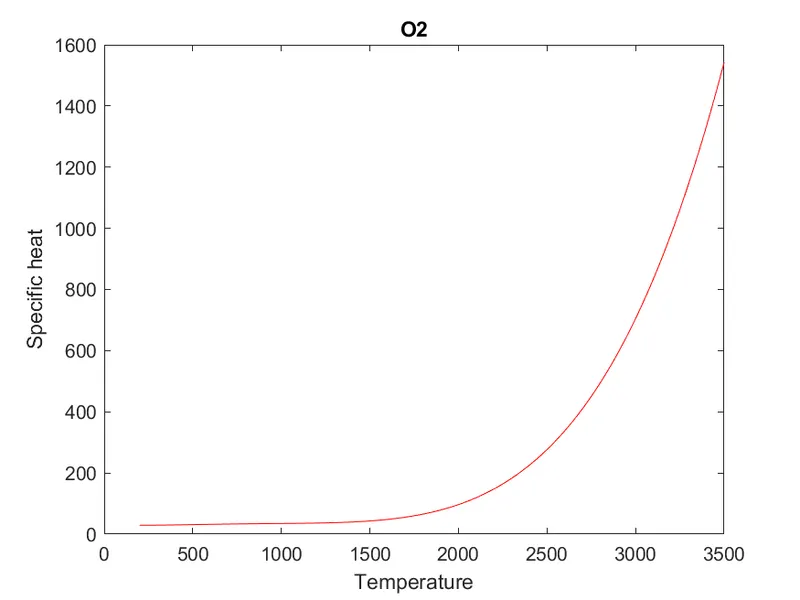
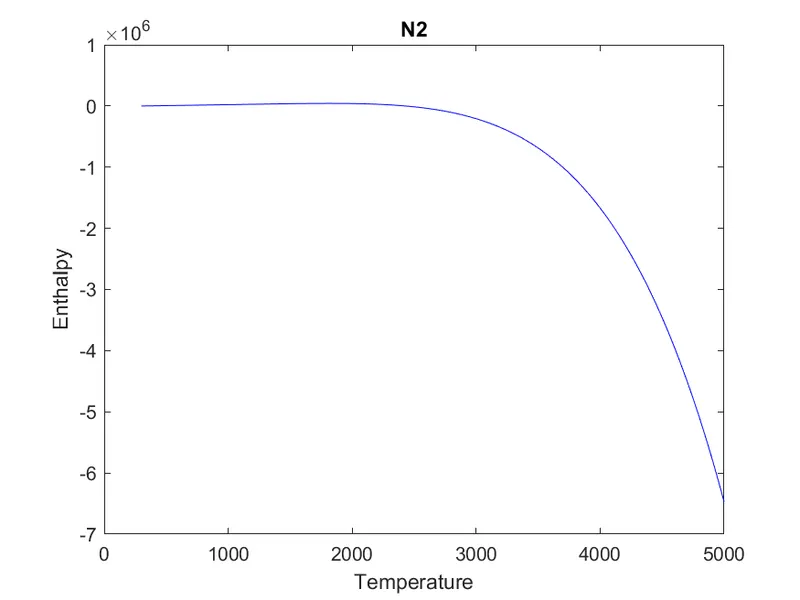
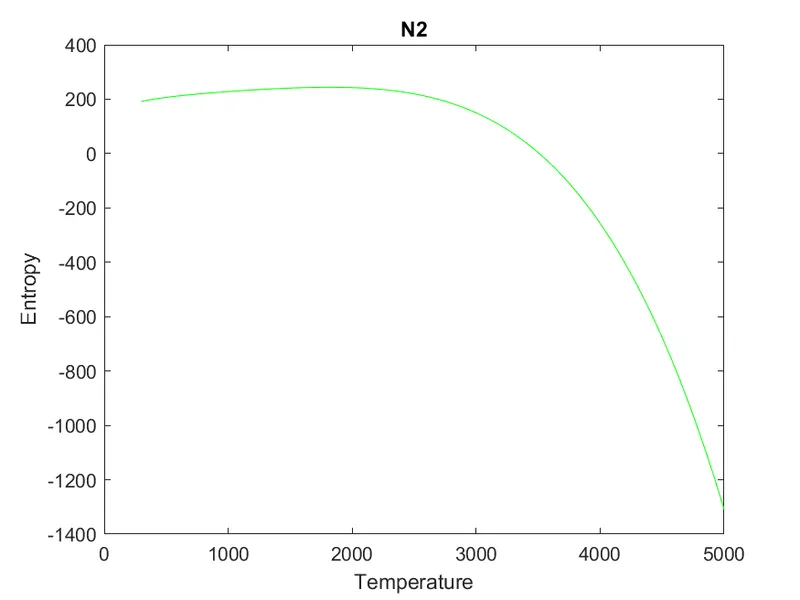
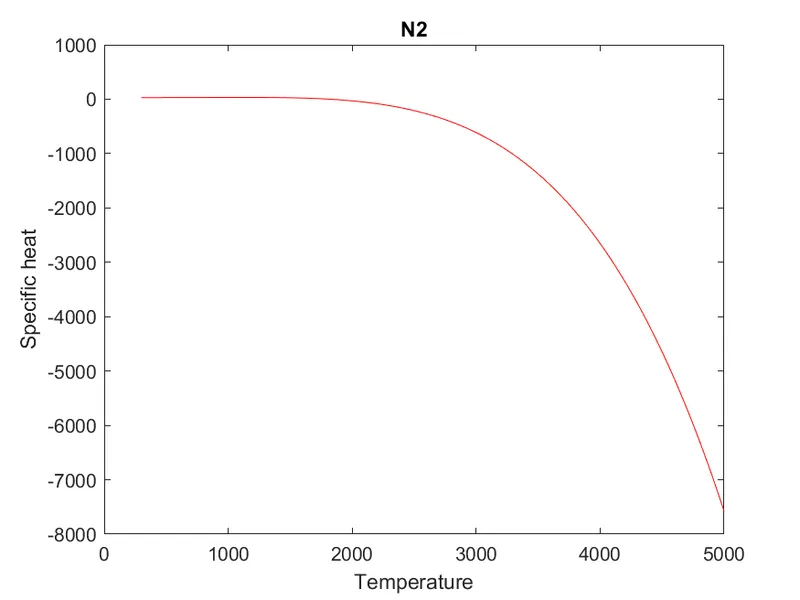
*Plots for o2, N2 and Co2 species
For O2
For N2
For CO2
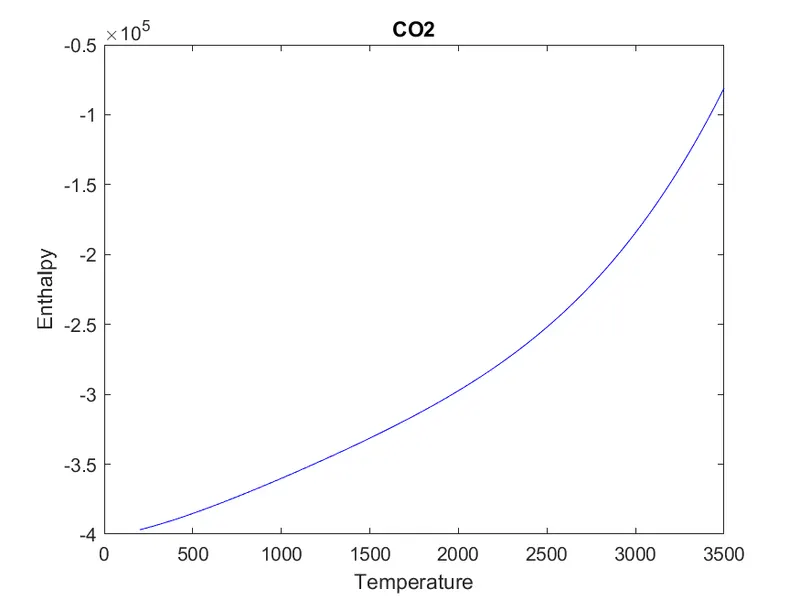
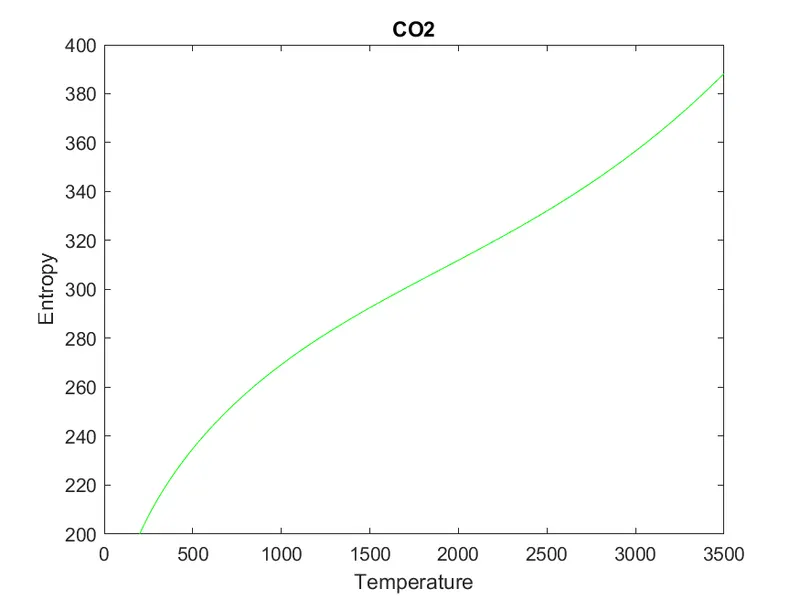
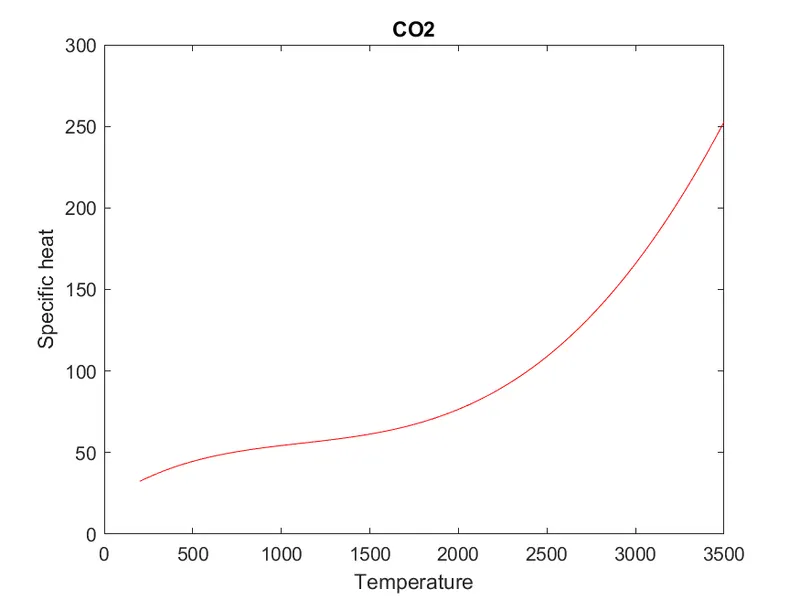
*Image of the folder depicting the stored graphs for the respective speicies

Further insights into the logic used.
*Logic that was used to parse the data from the given file was in order to get the coefficients for all the given species we needed the code to run for 53 times as there were 53 species of gas molecules that all had fourteen respective coefficients which included the high temperature and low temperature coefficients as well. The trick that we used was to mark the position of the exponent character 'E' to find the end and start of the coefficient and split the string accordingly.And we needed to repeat all the proces for 53 species so we put the code in a for loop running from i=1:53 iterations.
*The funtions that were used for data extraction are explained above along with the code.
*Now for the molecular weight calculation when we got a species name we first matched it with our array that contained the gas atoms and we also created an array that contained thire respective molecular weights at the coinciding positions with the atoms that was used to calculate the molecular weights.Here also the process of doing so is mentioned above along with the code.
*The complete program code.
clear all
close all
clc
f1=fopen('THERMO (1).dat','r') %Opening the data file
l1=fgetl(f1);                  %Getting the first two lines
l2=fgetl(f1);
A=strsplit(l2,' ');            %Splitting the second line for global temperatures
glo_low_temp=str2num(A{2});    %Converting string to numbers
glo_mid_temp=str2num(A{3});
glo_hi_temp=str2num(A{4});
for i=1:3                      %Skipping the next three lines
fgetl(f1);
end

for i=1:53                     %The main loop that controls the total no of iterations

% Reading the heaader line to obtain species and local temperature
l6=fgetl(f1);
head=strsplit(l6,' ');         %Using the split command for splitting the obtained line
species_name=head{1};

l=length(species_name);
lo_low_temp=str2num(head{end-3});%Storing the local temperatures for the species
lo_hi_temp=str2num(head{end-2}); %The local temperatures are present at the end of the line
lo_mid_temp=str2num(head{end-1});%for which we use end-3 and 2 respectively

% Now we obtain the first 5 coefficients
coffl=fgetl(f1);
A1=strfind(coffl,'E');
a1=str2double(coffl(1:A1(1)+3));
a2=str2double(coffl(A1(1)+4:A1(2)+3));
a3=str2double(coffl(A1(2)+4:A1(3)+3));
a4=str2double(coffl(A1(3)+4:A1(4)+3));
a5=str2double(coffl(A1(4)+4:A1(5)+3));
%Now we obtain the next five coeeficients
coffl2=fgetl(f1);
A2=strfind(coffl2,'E');
a6=str2double(coffl2(1:A2(1)+3));
a7=str2double(coffl2(A2(1)+4:A2(2)+3));
a8=str2double(coffl2(A2(2)+4:A2(3)+3));
a9=str2double(coffl2(A2(3)+4:A2(4)+3));
a10=str2double(coffl2(A2(4)+4:A2(5)+3));
%Now we obtain the last 4 coefficients
coffl3=fgetl(f1);
A3=strfind(coffl3,'E');
a11=str2double(coffl3(1:A3(1)+3));
a12=str2double(coffl3(A3(1)+4:A3(2)+3));
a13=str2double(coffl3(A3(2)+4:A3(3)+3));
a14=str2double(coffl3(A3(3)+4:A3(4)+3));

t=linspace(lo_low_temp,lo_hi_temp,1000); %Finding the values of enthalpy,entropy and specific heats with respect to temperature values
R=8.314;                                 %Value for the universal gas constant
for k=1:length(t)
    if t(k)