Project 1 - Parsing NASA thermodynamic data
Aim:- The main objective of the project is to write a program to evaluate the thermodynamic data such as specific heat, enthalpy, the entropy of NASA thermodynamic data to create the plots for all the species and to create the plots for all the species and to display the molecular weight calculation using MATLAB coding.
Parsing:- In general the term parsing is mainly used to disintegrate the given sort of data into a convenient, readable thing and that data can be used to evaluate some particular values or graphs can be plotted by utilizing that information.
Definitions:-
- Specific Heat:- Specific heat is the ratio of a quantity of heat required to raise the temperature of a body one degree to that required to raise the temperature of an equal mass of water one degree. The SI unit of Cp is KJ/kg-K.
- Enthalpy:- The enthalpy of a thermodynamic system is defined as the sum of its internal energy and the work required to achieve its pressure and volume. The SI unit of H is KJ.
- Entropy:- Entropy is a measure of the degree of disorderliness of the system. The SI unit of S is KJ/mol-k.
File parsing formula:-
Specific heat(Cp)=R(a1+a2 T +a3 T^2+a4 T^3+a5 T^4)
Enthalpy(H)=RT(a1+a2 T/2+a3 T^2/3+a4 T^3/4+a5 T^4/5+a6/T)
Entropy(S)=R(a1 log(T)+a2 T+a3 T^2/2+a4 T^3/3+a5 T^4/4+a7)
MATLAB code:-
Parcing file code:
clear all
close all
clc

f1=fopen('THERMO.dat','r');

for i=1:5
fgetl(f1);
end

for i=1:53
tline1=fgetl(f1);
split_sline=strsplit(tline1,' ');
species=split_sline{1};
find_dot=strfind(tline1,'.');
local_low_temp=str2double(tline1(find_dot(1)-3:find_dot(1)));
high_local_temp=str2double(tline1(find_dot(2)-4:find_dot(2)));
mid_local_temp=str2double(tline1(find_dot(3)-4:find_dot(3)));

tline2=fgetl(f1);
find_e=strfind(tline2,'E');
a1=str2double(tline2(1:find_e(1)+3));
a2=str2double(tline2(find_e(1)+4:find_e(2)+3));
a3=str2double(tline2(find_e(2)+4:find_e(3)+3));
a4=str2double(tline2(find_e(3)+4:find_e(4)+3));
a5=str2double(tline2(find_e(4)+4:find_e(5)+3));

tline3=fgetl(f1);
find_e=strfind(tline3,'E');
a6=str2double(tline3(1:find_e(1)+3));
a7=str2double(tline3(find_e(1)+4:find_e(2)+3));
a8=str2double(tline3(find_e(2)+4:find_e(3)+3));
a9=str2double(tline3(find_e(3)+4:find_e(4)+3));
a10=str2double(tline3(find_e(4)+4:find_e(5)+3));

tline4=fgetl(f1);
find_e=strfind(tline4,'E');
a11=str2double(tline4(1:find_e(1)+3));
a12=str2double(tline4(find_e(1)+4:find_e(2)+3));
a13=str2double(tline4(find_e(2)+4:find_e(3)+3));
a14=str2double(tline4(find_e(3)+4:find_e(4)+3));

% molecular=Molecular_weight(species);
% sprintf('Molecular_weight of %s is %d', species,molecular)
T=linspace(local_low_temp,high_local_temp,100);
R=287;
if T> mid_local_temp
Cp=R*(a1+a2*T+a3*T.^2+a4*T.^3+a5*T.^4);
H=R*(a1+a2*T./2+a3*T.^2./3+a4*T.^3./4+a5*T.^4./5+a6./T).*T;
S=R*(a1*log(T)+a2*T+a3*T.^2./2+a4*T.^3./3+a5*T.^4./4+a7);
else
Cp=R*(a8+a9*T+a10*T.^2+a11*T.^3+a12*T.^4);
H=R*(a8+a9*T./2+a10*T.^2./3+a11*T.^3./4+a12*T.^4./5+a13./T).*T;
S=R*(a8*log(T)+a9*T+a10*T.^2./2+a11*T.^3./3+a12*T.^4./4+a14);
end

t=sprintf('%s',species);
mkdir(['C:\Users\Chirag\Documents\MATLAB\NASA\',species]);


figure(1)
plot(Cp,T)
title('Specific_heat vs Temperature')
xlabel('Specific heat(KJ)');
ylabel('Temperature(K)');
grid on


figure(2)
plot(H,T)
title('Enthalpy vs Temperature')
xlabel('Enthalpy (KJ)');
ylabel('Temperature(K)');
grid on


figure(3)
plot(S,T)
title('Entropy vs Temperature')
xlabel('Entropy(KJ/mol-k)');
ylabel('Temperature(k)');
grid on
cd(['C:\Users\Chirag\Documents\MATLAB\NASA\',species]);

saveas(1,'Specific_heat.jpg')
saveas(2,'enthalpy.jpg')
saveas(3,'entropy.jpg')
cd ..
end
Molecular weight code:
function [MW]=Molecular_weight(species);

elements=['O','H','C','N','R'];
AW=[16,1,12,14,40];


MW=0;
for i=1:length(species)
  for j=1:length(elements)
    if strcmp(species(i),elements(j))
      MW=MW+AW(j);
      position=j;
    end
  end
  n=str2num(species(i));
  if n>=1
      MW=MW+AW(position)*(n-1)
  end
end
end
Plots:-
Plots of O2
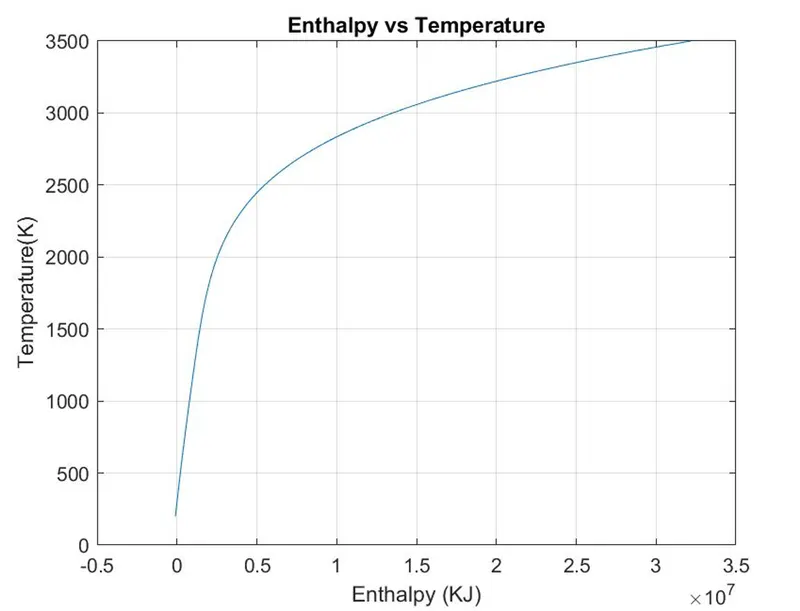
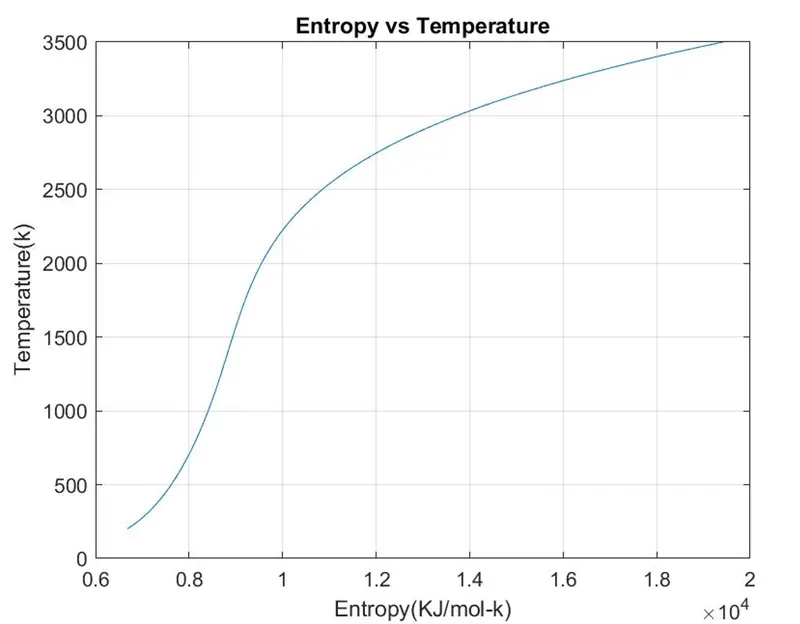
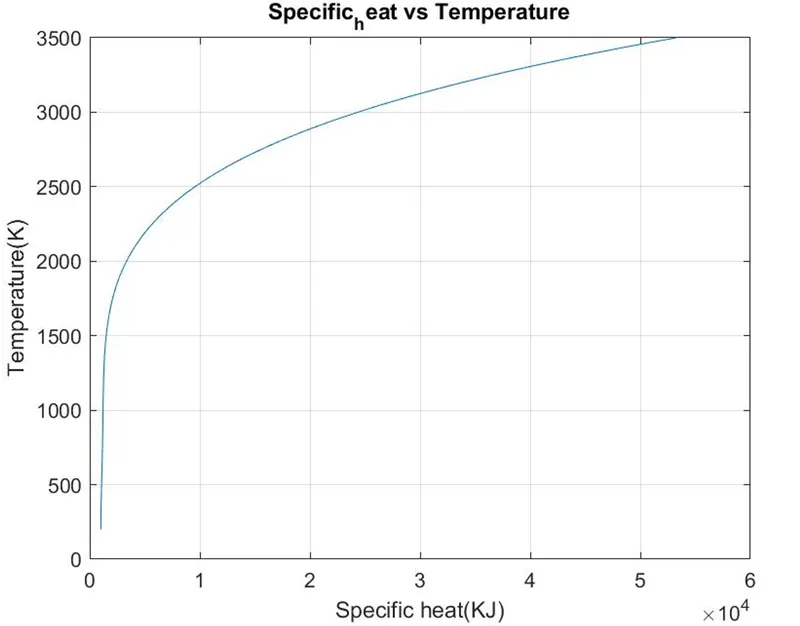
Total 53 graphs as below:

Conclusion:-
- The data has been extracted and thermodynamic property such as specific heat, enthalpy, entropy is calculated and graphs has been plotted and the files of individual species is created.