Project 1 - Parsing NASA thermodynamic data
Parsing NASA Thermodynamic Data -
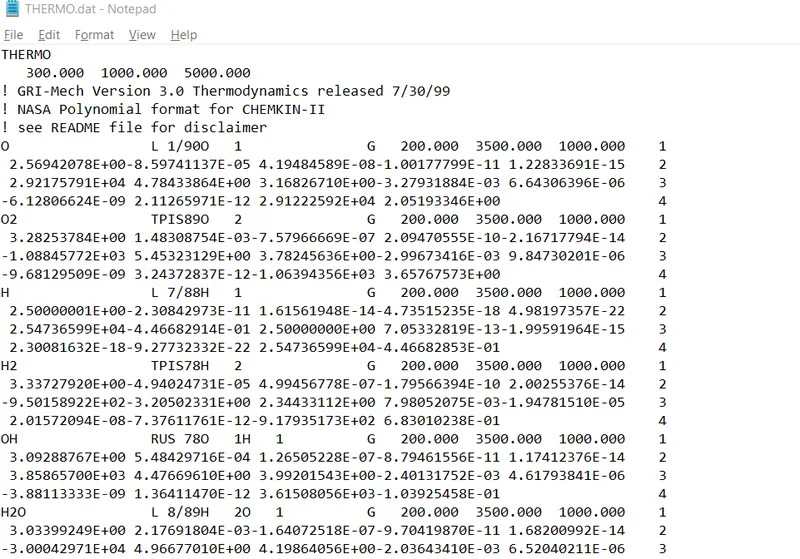
File Parsing is a process of extracting data from an m file. Then utlising that data later on a program. In the given THERMO.dat file we have coeffiecient values of different species and in several temperature ranges, we will use that data to calculate molecular weight, Specific heat, enthalpy and entropy for each species.
Screenshot of the file THERMO.dat
Equations to calculate Cp, H and S

First code to extract data from THERMO.dat file
%Parsing NASA Thermodynamic Data
%Extracting data from the given file
f1 = fopen('THERMO.dat','r');    %Openning the THERMO.dat file
l_1 = fgetl(f1);   %Skipping the header
l_2 = fgetl(f1);   %Temperature values
temp = strsplit(l_2,' ');       %splitting the second line
low_temp = str2num(temp{2});      %Lowest temperature on second line
medium_temp = str2num(temp{3});   %Medium temperature on second line
high_temp = str2num(temp{4});     %Highest temperature on second line

%Skipping next three lines as they are part of header
l_3 = fgetl(f1);
l_4 = fgetl(f1);
l_5 = fgetl(f1);

%Extracting Species information
for i = 1:53       %There are 53 species on the file
    species = fgetl(f1);      %Next line
    W = findstr(species,'.');     %Locating the . on the line
    temp1 = species(W(1)-3:W(1)+3);    %Locating minimum temperature string
    temp_min = str2double(temp1);        %Converting string to text
    temp2 = species(W(2)-4:W(2)+3);    %Locating maximum temperature string
    temp_max = str2double(temp2);        %Converting string to text
    temp3 = species(W(3)-4:W(3)+3);    %Locating medium temperature string
    temp_mid = str2double(temp3);        %Converting string to text

    species_name = species(1:6);     %Longest species has 6 letters

   %Extracting the constants
   l_6 = fgetl(f1);           %Next line
   X = findstr(l_6,'E');      %Locating E on the line
   a1 = str2double(l_6(1:(X(1)+3)));        %First co_efficient
   a2 = str2double(l_6((X(1)+4):(X(2)+3)));    %Second co_efficient
   a3 = str2double(l_6((X(2)+4):(X(3)+3)));    %Third co_efficient
   a4 = str2double(l_6((X(3)+4):(X(4)+3)));    %Fourth co_efficient
   a5 = str2double(l_6((X(4)+4):(X(5)+3)));    %Fifith co_efficient

   l_7 = fgetl(f1);        %Next line
   Y = strfind(l_7,'E');   %Locating E on the line
   a6 = str2double(l_7(1:(Y(1)+3)));        %Sixth co_efficient
   a7 = str2double(l_7((Y(1)+4):(Y(2)+3)));     %Seventh co_efficient
   a8 = str2double(l_7((Y(2)+4):(Y(3)+3)));     %Eighth co_efficient
   a9 = str2double(l_7((Y(3)+4):(Y(4)+3)));     %Ninth co_efficient
   a10 = str2double(l_7((Y(4)+4):(Y(5)+3)));    %Tenth co_efficient

   l_8 = fgetl(f1);      %Next line
   Z = findstr(l_8,'E');   %Locating E on the line
   a11 = str2double(l_8(1:(Z(1)+3)));     %Eleventh co_efficient
   a12= str2double(l_8((Z(1)+4):(Z(2)+3)));    %Twelveth co_efficient
   a13 = str2double(l_8((Z(2)+4):(Z(3)+3)));    % Thirtinth co_efficient
   a14 = str2double(l_8((Z(3)+4):(Z(4)+3)));    %Fourteenth co_efficient

   Temp = linspace(temp_min,temp_max,100);   %Taking 100 values between minimum and maximum temperature
   R = 8.314;    %Universal gas constant

   %Calculation of properties based on the lower and upper temperature
   %Specific heat
   specific_heat = function_specific_heat(a1,a2,a3,a4,a5,a6,a7,a8,a9,a10,Temp,R,temp_mid);

   %Enthalpy
   enthalpy = function_enthalpy(a1,a2,a3,a4,a5,a6,a7,a8,a9,a10,a11,a12,Temp,R,temp_mid);

   %Entropy
   entropy = function_entropy(a1,a2,a3,a4,a5,a7,a8,a9,a10,a11,a12,a13,Temp,R,temp_mid);

   %Calculation of molecular weight
   elements = ['H','C','O','S','A'];
   atomic_weight = [1,12,16,32,40];     %Atomic weight of respective molecules
   m = 0; %Initial value
   for i = 1:length(species_name)
       for j = 1:length(elements)
           if strcmp(species_name(i),elements(j))
               molecular_weight = m+atomic_weight(j);
               k = j;
           end
       end
       n = str2double(species_name(i));
       if n>1
           molecular_weight = m+(atomic_weight(k).*(n-1));
       end
   end
   fprintf('molecular weight of %s:%f',species_name,molecular_weight)
   disp('')

   %Creating the directory for each species
   mkdir('C:\Users\sinha\Desktop\NASA FILE PARSING\',species_name);

   %Plotting
   %Temperature vs Entropy

   figure(1)
   plot(Temp,entropy,'Linewidth',2,'color','r');
   title(['Entropy ', species_name]);
   xlabel('Temperature');
   ylabel('Entropy');


   %Temperature vs Enthalpy
   figure(2)
   plot(Temp,enthalpy,'Linewidth',2,'color','g');
   title(['Enthalpy ', species_name]);
   xlabel('Temperature');
   ylabel('Enthalpy');


   %Temperature vs Specific heat
   figure(3)
   plot(Temp,specific_heat,'Linewidth',2,'color','b');
   title(['Specific Heat ', species_name]);
   xlabel('Temperature');
   ylabel('Specific heat');


   new_folder = (['C:\Users\sinha\Desktop\NASA FILE PARSING\', species_name]);  %Creating folder after each loop
   cd(new_folder)   %Changing the directory for saving the plots


   saveas(1,'entropy','jpg');
   saveas(2,'enthalpy','jpg');
   saveas(3,'specific_heat','jpg');


end

fclose(f1);
Function code for specific heat
function specific_heat = function_specific_heat(a1,a2,a3,a4,a5,a6,a7,a8,a9,a10,Temp,R,temp_mid)

if Temp>temp_mid
    specific_heat = (a1+(a2.*Temp)+(a3.*Temp.^2)+(a4.*Temp.^3)+(a5.*Temp.^4)).*R;

else
    specific_heat = (a6+(a7.*Temp)+(a8.*Temp.^2)+(a9.*Temp.^3)+(a10.*Temp.^4)).*R;
end
Function code for enthalpy
function enthalpy = function_enthalpy(a1,a2,a3,a4,a5,a6,a7,a8,a9,a10,a11,a12,Temp,R,temp_mid)

if Temp>temp_mid
    enthalpy = (a1+((a2.*Temp)./2)+((a3.*Temp.^2)./3)+((a4.*Temp.^3)./4)+((a5.*Temp.^4)./5)+a6./Temp).*R;

else
    enthalpy = (a7+(a8.*Temp)./2+((a9.*Temp.^2)./3)+((a10.*Temp.^3)./4)+((a11.*Temp.^4)./5)+a12./Temp).*R;
end
Function code for entropy
function entropy = function_entropy(a1,a2,a3,a4,a5,a7,a8,a9,a10,a11,a12,a13,Temp,R,temp_mid)

if Temp>temp_mid
    entropy = (a1*log(Temp)+(a2.*Temp)+(a3.*Temp.^2)./2+(a4.*Temp.^3)./3+(a5.*Temp.^4)./5+a7).*R;

else
    entropy = (a8*log(Temp)+(a9.*Temp)+(a10.*Temp.^2)./2+(a11.*Temp.^3)./3+(a12.*Temp.^4)./5+a13).*R;

end
Explanation
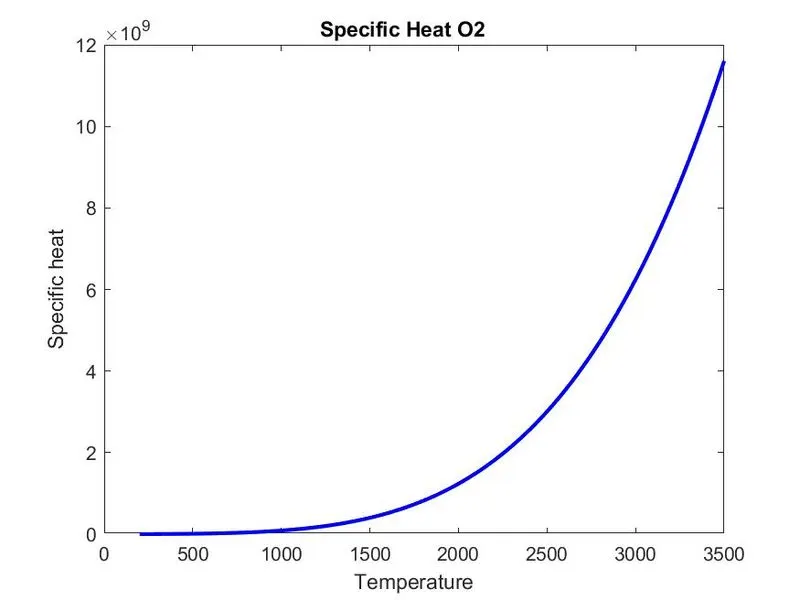
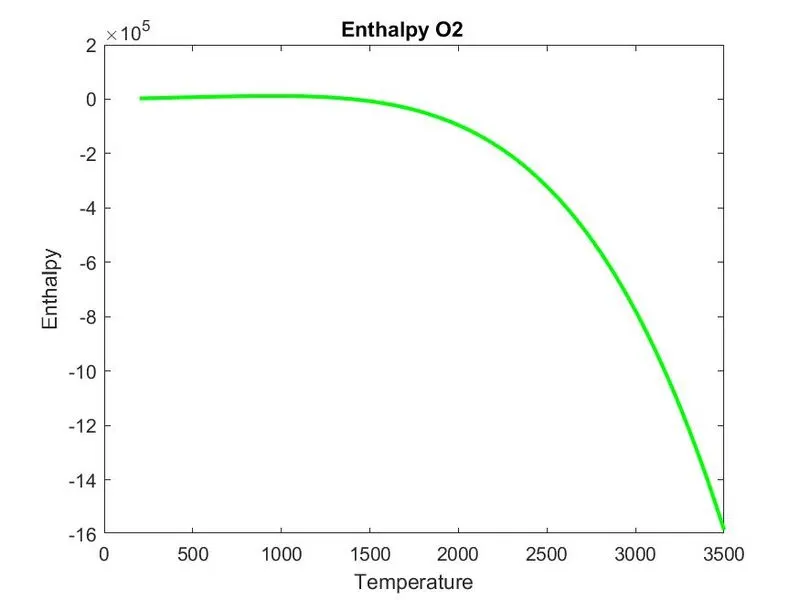
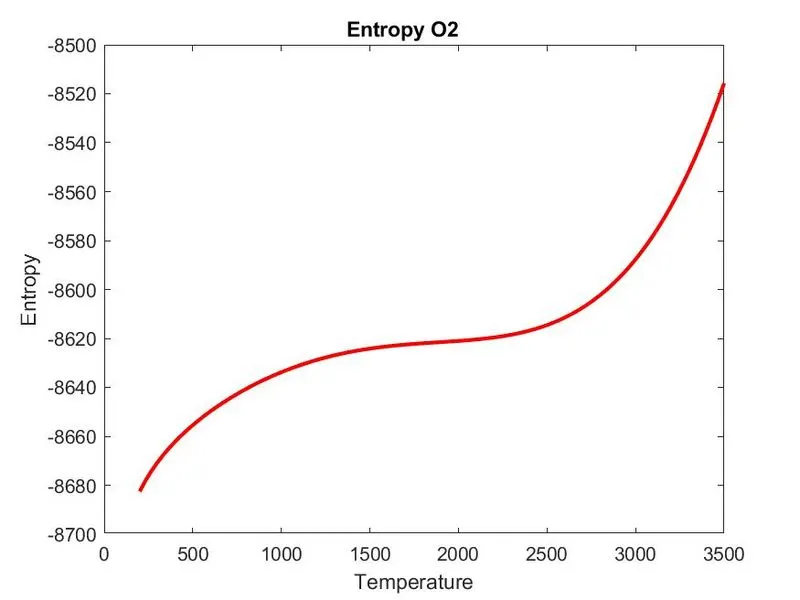
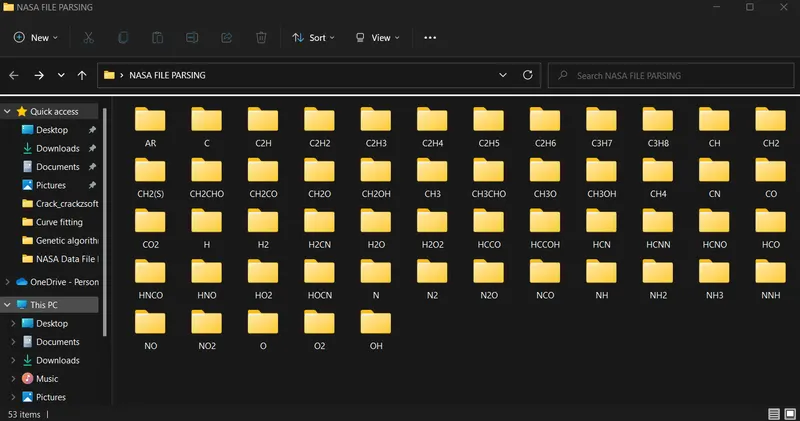
First we are using fopen command to open the THERMO.dat file. then to skip the unimportant lines we are using the fgetl command. strsplit command extracts the string containing temperatures. By using str2num command we are converting strings to numerical values. We are assiging the temperatures in diferent variables called low_temp,medium_temp,high_temp by comparing their values. The next three lines are useless so we skip that using fgetl. Now we are using for loop to extract coefficients of different elements from the file. We have 53 elements in the file. Now the next line has name of the species and values of temperatures in it species = fgetl(f1) . W represents the location of . in the line . Now by locating it we can extract the strings containing the temperatures. We are using str2double command to convert the strings into text and we'll get minimum,maximum and medium temperature values. The species name would be the first letter or the first 6 six letters of that line so we would use the command species_name = species(1:6). The next three lines contains values different coefficients. First we locate E on next three lines and then by its locations we extract the strings of coefficients then convert it into text. We take 100 values between minimum temperature and maximum temperature and assign it to a variable called Temp. Formulas of specific heat, enthalpy, entropy are given in the problem by using it we create function commands for three of these. Now we are creating a directory for each species by using the command mkdir. After plotting the required datas we are saving the picture .jpg file on its respective folder. Each time the for loop generates plots for different species the save directory changes. We are using cd command for this.
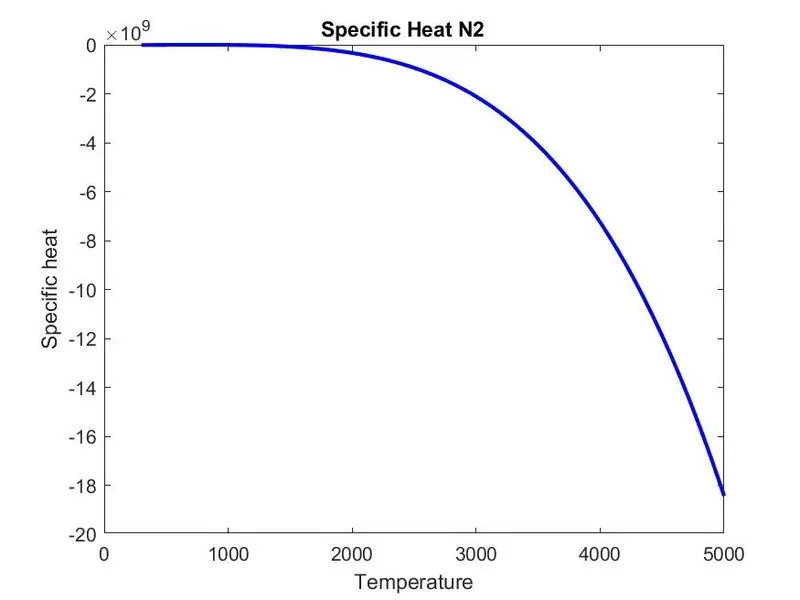
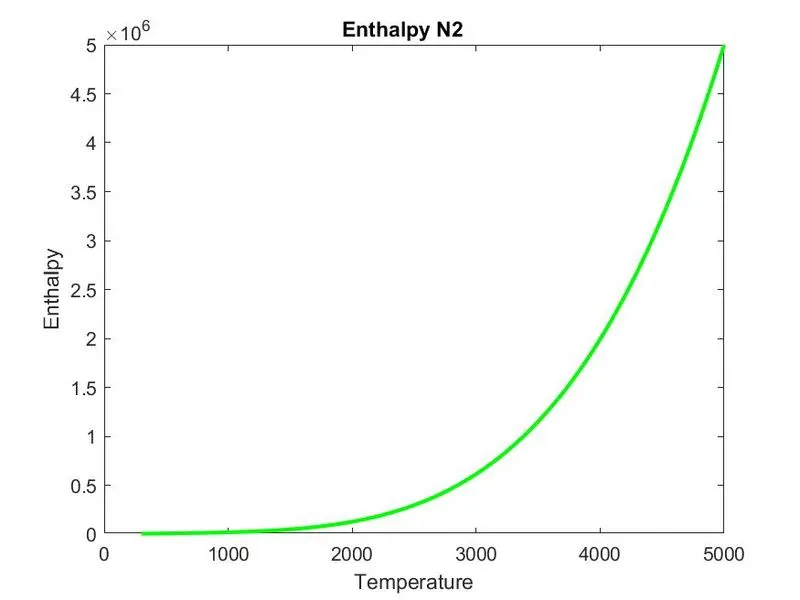
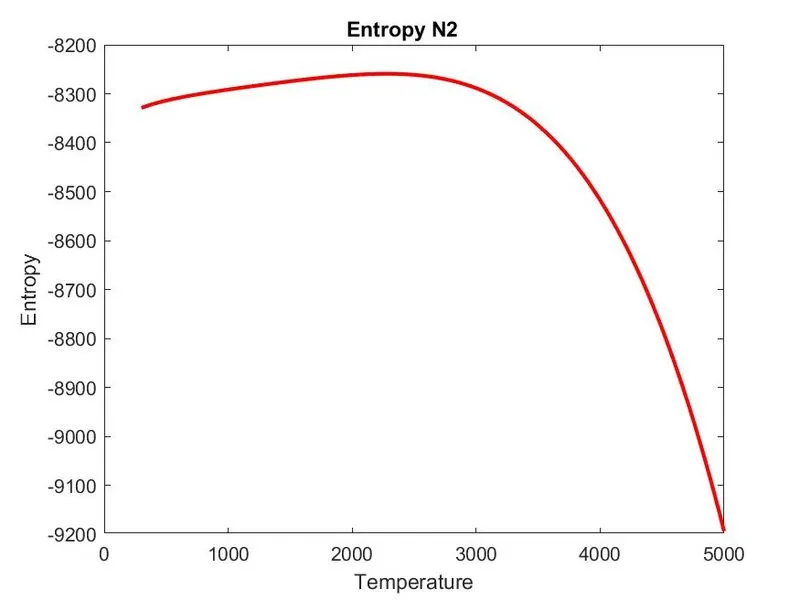
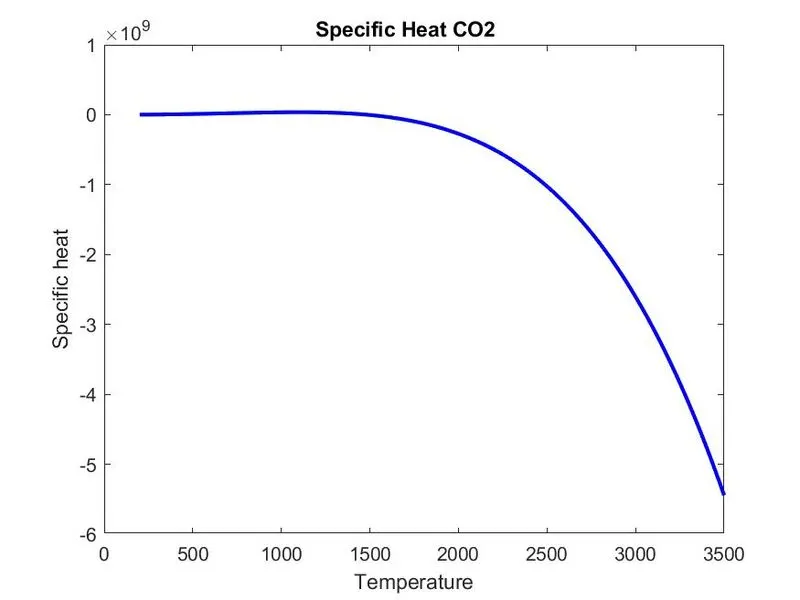
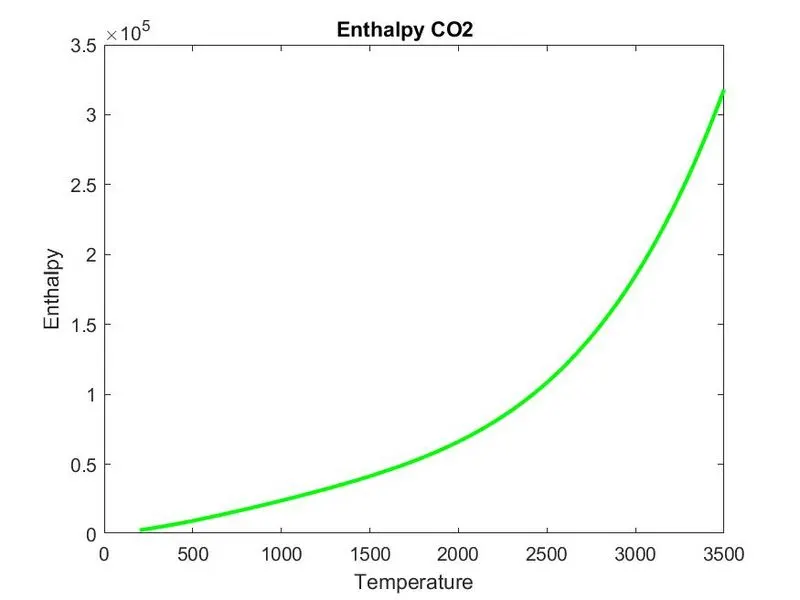
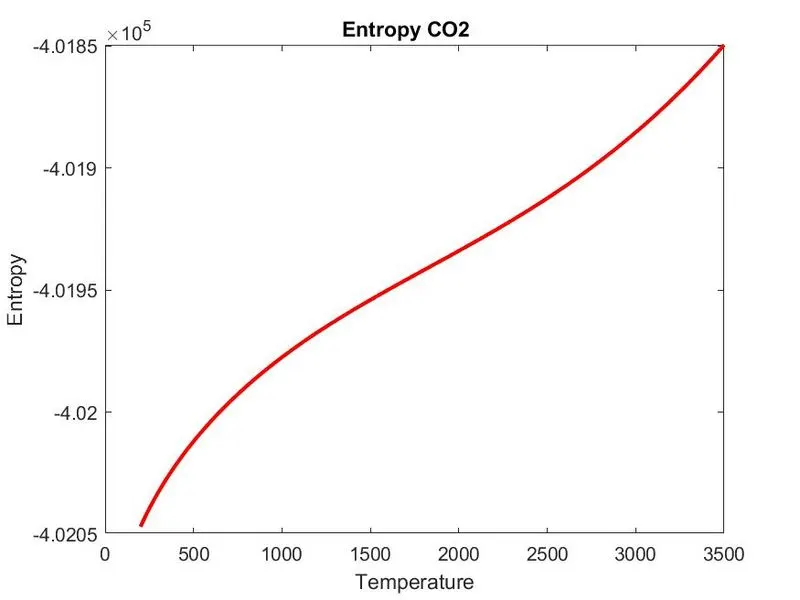
Specific heat, Enthalpy, Entropy plot of O2, N2, CO2
Molecular weights in the command window

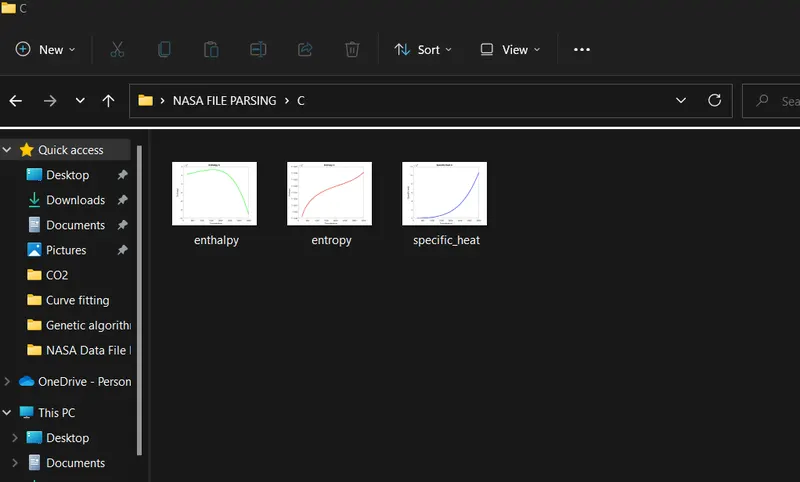
Screenshot of folders containing plot for different elements
references - 1. https://www.youtube.com/watch?v=XYJZ6n3HPwM
2. https://en.wikipedia.org/wiki/Parsing