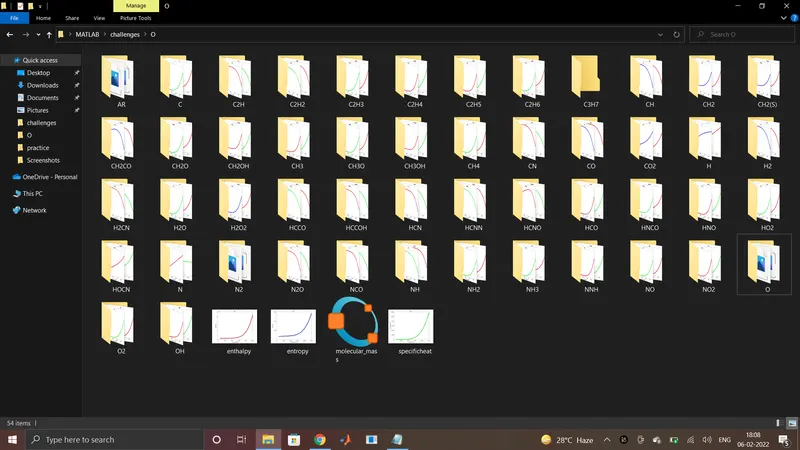
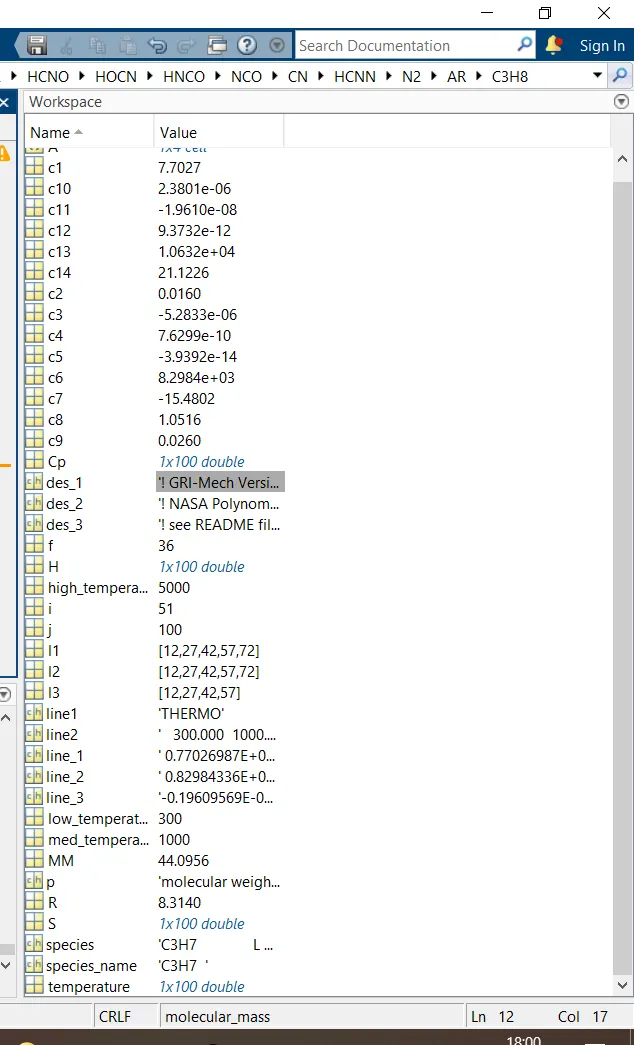
Project 1 - Parsing NASA thermodynamic data
Aim: to write a function that extracts the 14 coefficients and calculates the enthalpy, entropy, and specific heats for all the species in the data file.
To plot the parameters with specific local temperatures
To calculate the molecular weight of each species using the mentioned formula
Description:
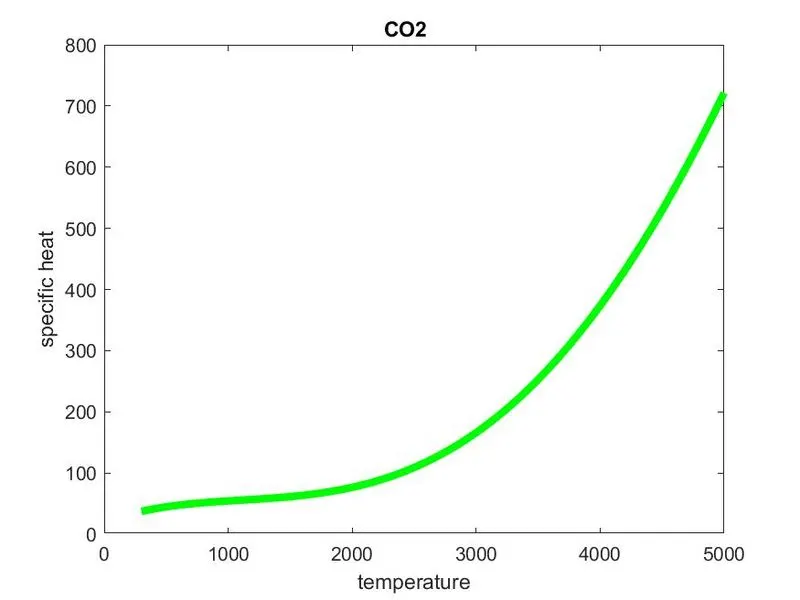
specific heat: It is the quantity of heat required to raise the temperature of one gram of a substance by one degree celsius.
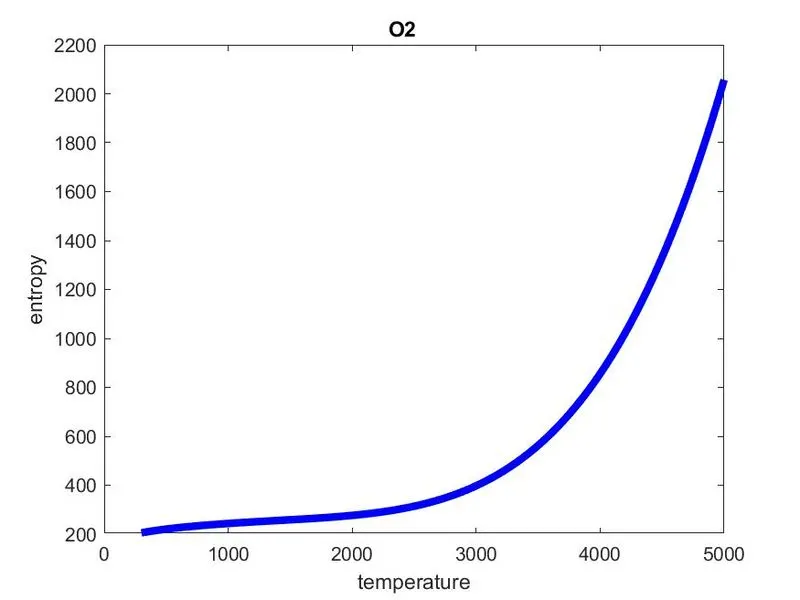
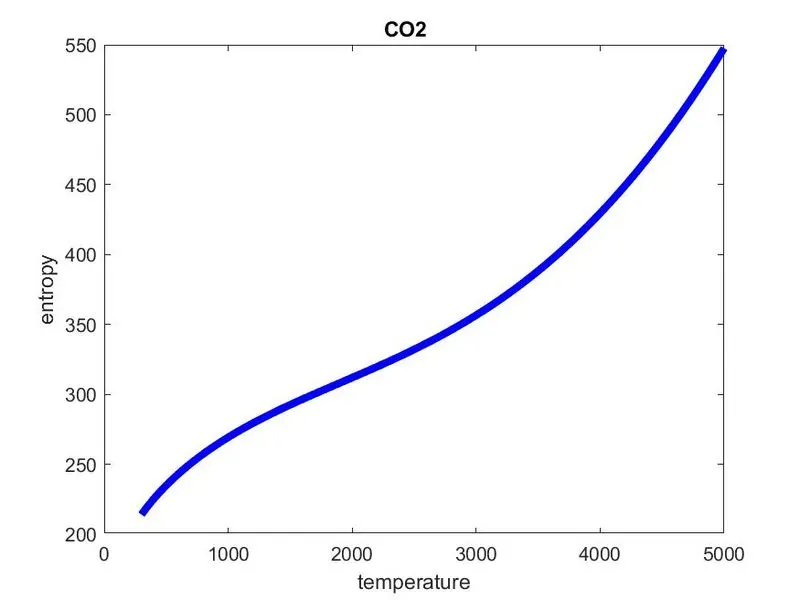
entropy: It is the measure of a system’s thermal energy per unit temperature that is unavailable for doing useful work.
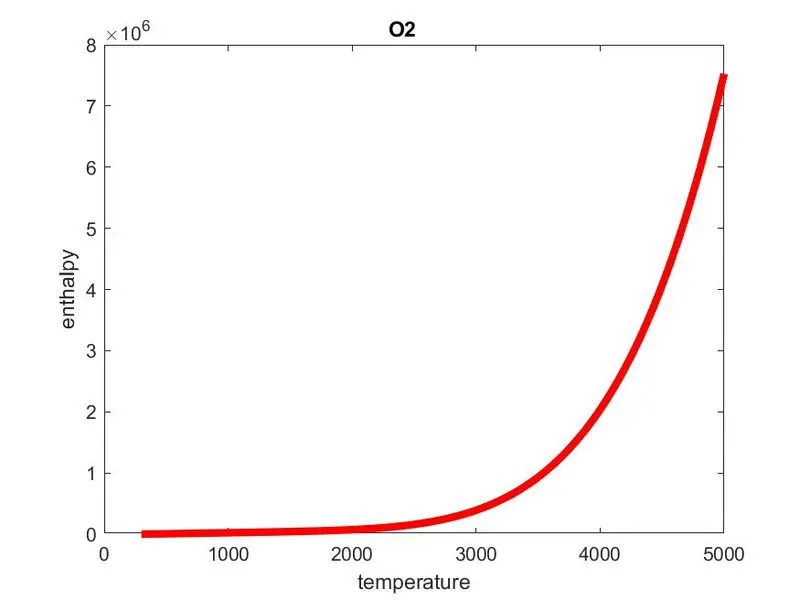
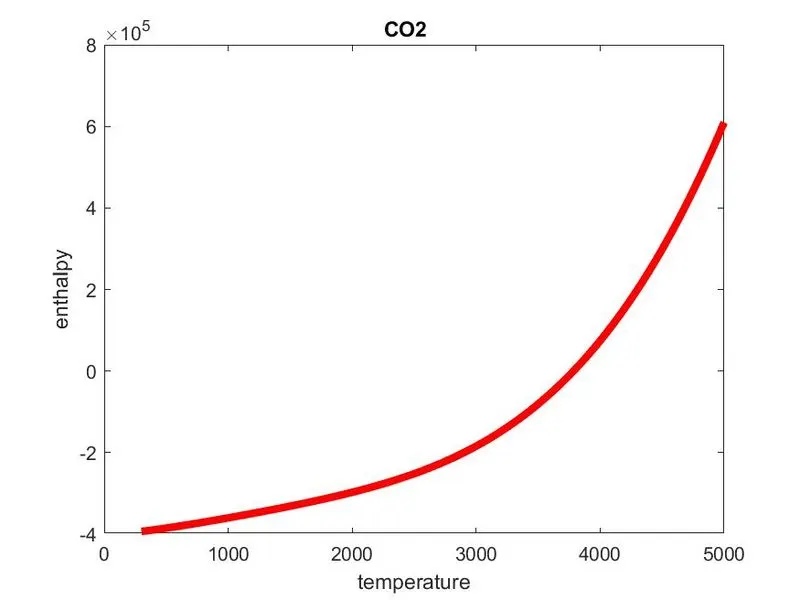
enthalpy: It is the sum of the internal energy and the product of the pressure and volume of a thermodynamic system.
Cp= specific heat
H= enthalpy
S= entropy
R= universal gas constant
T= temperature
code:
clear all
close all
clc

f= fopen('THERMO.dat','r')
line1=fgetl(f);
line2=fgetl(f);
%comments
des_1=fgetl(f);
des_2=fgetl(f);
des_3=fgetl(f);
A= strsplit(line2,' ');

low_temperature=str2double(A{2});
med_temperature=str2double(A{3});
high_temperature=str2double(A{4});

for i=1:53
    species= fgetl(f);
    species_name= species(1:6);

    line_1=fgetl(f);
    l1=strfind(line_1,'E');
    c1=str2num(line_1(1:(l1(1)+3)));
    c2=str2num(line_1((l1(1)+4):(l1(2)+3)));
    c3=str2num(line_1((l1(2)+4):(l1(3)+3)));
    c4=str2num(line_1((l1(3)+4):(l1(4)+3)));
    c5=str2num(line_1((l1(4)+4):(l1(5)+3)));

   line_2=fgetl(f);
    l2=strfind(line_2,'E');
    c6=str2num(line_2(1:(l2(1)+3)));
    c7=str2num(line_2((l2(1)+4):(l2(2)+3)));
    c8=str2num(line_2((l2(2)+4):(l2(3)+3)));
    c9=str2num(line_2((l2(3)+4):(l2(4)+3)));
    c10=str2num(line_2((l2(4)+4):(l2(5)+3)));

line_3=fgetl(f);
    l3=strfind(line_3,'E');
    c11=str2num(line_3(1:(l3(1)+3)));
    c12=str2num(line_3((l3(1)+4):(l3(2)+3)));
    c13=str2num(line_3((l3(2)+4):(l3(3)+3)));
    c14=str2num(line_3((l3(3)+4):(l3(4)+3)));


    temperature= linspace(300,5000,100);
    R=8.314;

    for j=1:length(temperature)
        if temperature(j)<3000
            Cp=(c1+c2.*temperature+c3.*temperature.^2+c4.*temperature.^3+c5.*temperature.^4).*R;
            H=(c1+(c2.*temperature)./2+(c3.*temperature.^2)/3+(c4.*temperature.^3)/4+(c5.*temperature.^4/5)+(c6./temperature)).*temperature.*R;
            S=(c1.*log(temperature)+c2.*temperature+(c3.*temperature.^2)/2+(c4.*temperature.^3)/3+(c5.*temperature.^4)/4+c7).*R;
        else
            Cp=(c8+c9.*temperature+c10.*temperature.^2+c11.*temperature.^3+c12.*temperature.^4).*R;
            H=(c8+(c9.*temperature)./2+(c10.*temperature.^2)/3+(c11.*temperature.^3)/4+(c12.*temperature.^4/5)+(c13./temperature)).*temperature.*R;
            S=(c8.*log(temperature)+c9.*temperature+(c10.*temperature.^2)/2+(c11.*temperature.^3)/3+(c12.*temperature.^4)/4+c14).*R;
        end
    end

    %plotting temp vs entropy
    figure(1)
    plot(temperature,S,'LineWidth',4,'Color','b')
    title(species_name)
    xlabel('temperature')
    ylabel('entropy')

    %plot temp vs enthalpy
    figure(2)
    plot(temperature,H,'LineWidth',4,'Color','r')
    title(species_name)
    xlabel('temperature')
    ylabel('enthalpy')

    %plot temp vs specific heat
    figure(3)
    plot(temperature,Cp,'LineWidth',4,'Color','g')
    title(species_name)
    xlabel('temperature')
    ylabel('specific heat')

 %folder for species
  mkdir(species_name)
  cd(species_name)
   %saving
   saveas(1,'entropy.jpg');
   saveas(2,'enthalpy.jpg');
   saveas(3,'specificheat.jpg');


   % molecular mass calculation

MM = molecular_mass(species_name)
  p=sprintf('molecular weight of %s is %f',species_name,MM)
   disp(p)
end

fclose(f);
function code:
function MM= molecular_mass(species_name)
species= upper(species_name);
constituents=['H','C','N','O','A'];
atomic_weight=[1.00794 12.0107 14.006 15.9994 39.948];
MM = 0;

for i=1:length(species_name)
    for j=1:length(constituents)
        if strcmp(species(i),constituents(j))
            MM = MM +atomic_weight(j);
            u=j;
        end
    end
        n=str2num(species(i));
    if n>1
        MM = MM +atomic_weight(u)*(n-1);
    end

end
        end
explanation of commands used:
fgetl: this command is used to return to the next line of the specified file
strsplit: this command is used to splits str on the elements of the delimiter
strfind: this command is used to find strings in strings
mkdir:This command is used to create a new folder
cd: this command is used to change the current folder
saveas: this command is used to save the file
output:
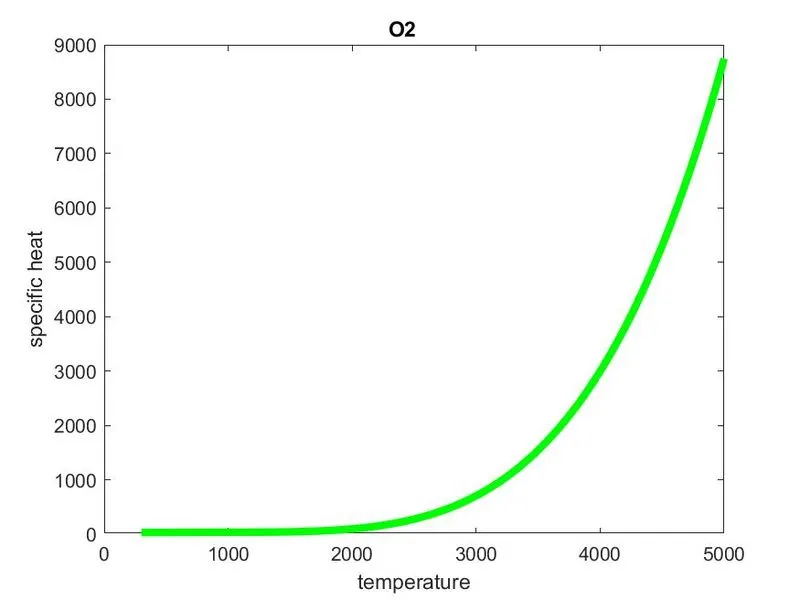
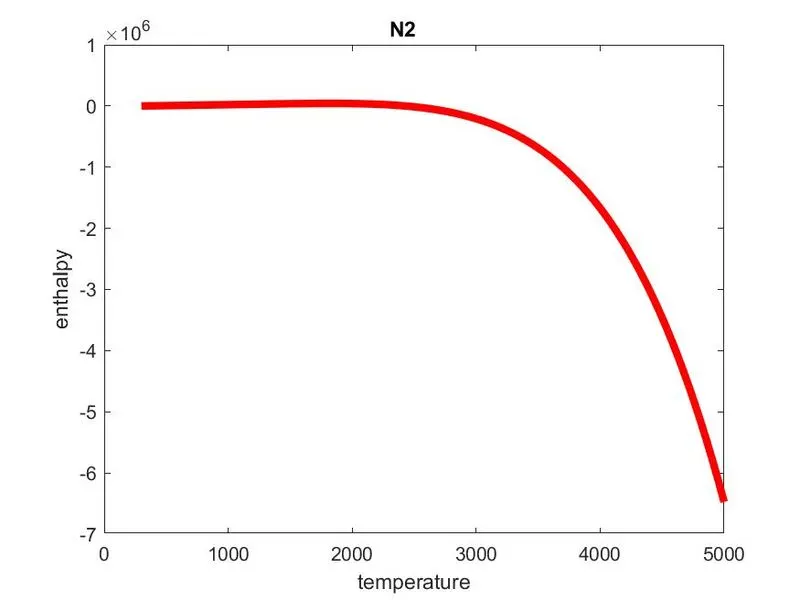
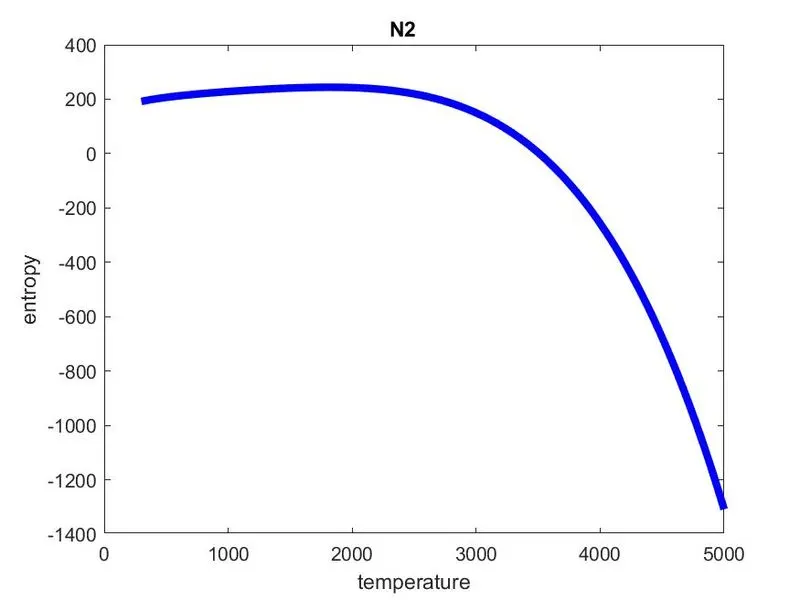
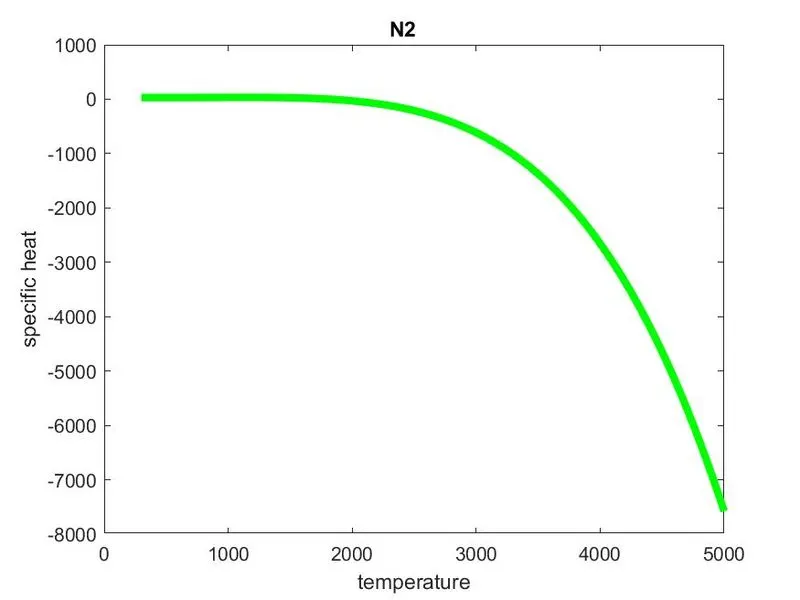
plots for o2, N2 and co2
other plot files: