Project 1 - Parsing NASA thermodynamic data
Main code:
% Parsing NASA Thermodynamic Data
clear all
close all
clc

% Reading THERMO data file

f1 = fopen('THERMO.dat','r'); %opening the file

get = fgetl(f1); %skipping the first line

% GLobal temperatures
global_temp = fgetl(f1);

%splitting
t = strsplit(global_temp,' ');

% Strings to numbers from the cell array
%after knowing the element's number
global_low_temp = str2double(t{2}); % using {} since it is a cell array
global_mid_temp = str2double(t{3});
global_high_temp = str2double(t{4});
T = linspace(global_low_temp,global_high_temp,200);
% Gas constant
R = 8.314;

% Skipping the 3 comment lines
for i= 1:3
    get=fgetl(f1);
end


% Species Block
for j = 1:53
    tline = fgetl(f1);

A = strsplit(tline,' ');
% name of species
species = A{1};
tline1 = fgetl(f1);
% Finding Co efficients
a = strfind(tline1,'E');% taking E as reference for break in coefficients
a1 = str2double(tline1(1:a(1)+3));

a2 = str2double(tline1(a(1)+4:a(2)+3));

a3 = str2double(tline1(a(2)+4:a(3)+3));

a4 = str2double(tline1(a(3)+4:a(4)+3));

a5 = str2double(tline1(a(4)+4:a(5)+3));


tline2 = fgetl(f1);
b = strfind(tline2,'E');
a6 = str2double(tline2(1:b(1)+3));

a7 = str2double(tline2(b(1)+4:b(2)+3));

a8 = str2double(tline2(b(2)+4:b(3)+3));

a9 = str2double(tline2(b(3)+4:b(4)+3));

a10 = str2double(tline2(b(4)+4:b(5)+3));


tline3 = fgetl(f1);
c = strfind(tline3,'E');
a11 = str2double(tline3(1:c(1)+3));

a12 = str2double(tline3(c(1)+4:c(2)+3));

a13 = str2double(tline3(c(2)+4:c(3)+3));

a14 = str2double(tline3(c(3)+4:c(4)+3));


% Calculate specific heat
Cp = sp_heat(a1,a2,a3,a4,a5,a8,a9,a10,a11,a12,T,R,global_mid_temp);

% Calculate Entropy
S = Entropy(a1,a2,a3,a4,a5,a7,a8,a9,a10,a11,a12,a14,T,R,global_mid_temp);

% Calculate Enthalpy
H = Enthalpy(a1,a2,a3,a4,a5,a6,a8,a9,a10,a11,a12,a13,T,R,global_mid_temp);

% Molecular Weight
[W] = Mol_wt(species);

% Writing Molecular weight file
 MW = fopen('Molecular_Weight.txt','w');
 fprintf(MW,'Molecular weight of %s is %d \n',species,W);


% Creating and Saving in Folder for plots
mkdir(['C:\Users\ashis\OneDrive\Desktop\mat lab temp\project\',species]);

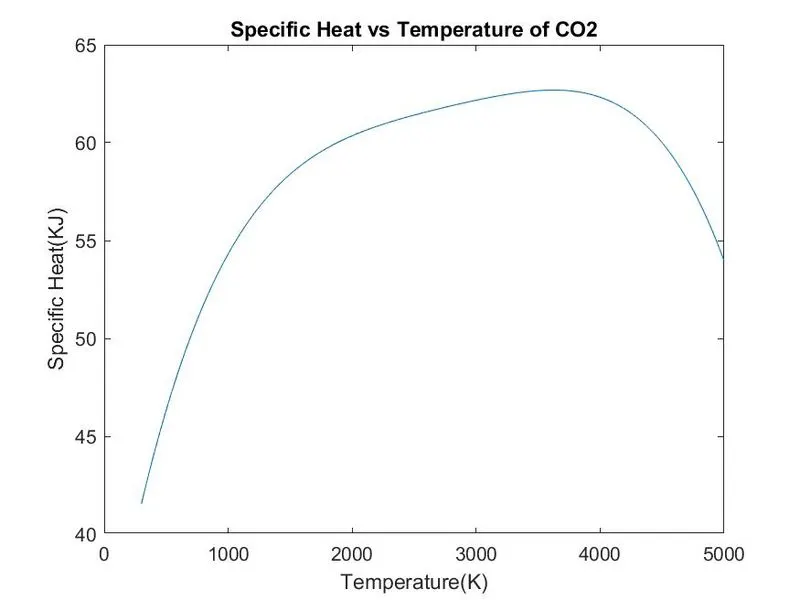
% Plotting Cp vs T
figure(1)
plot(T,Cp)
xlabel('Temperature(K)')
ylabel('Specific Heat(KJ)')
%To print name of species for the title
title(sprintf('Specific Heat vs Temperature of %s',species))


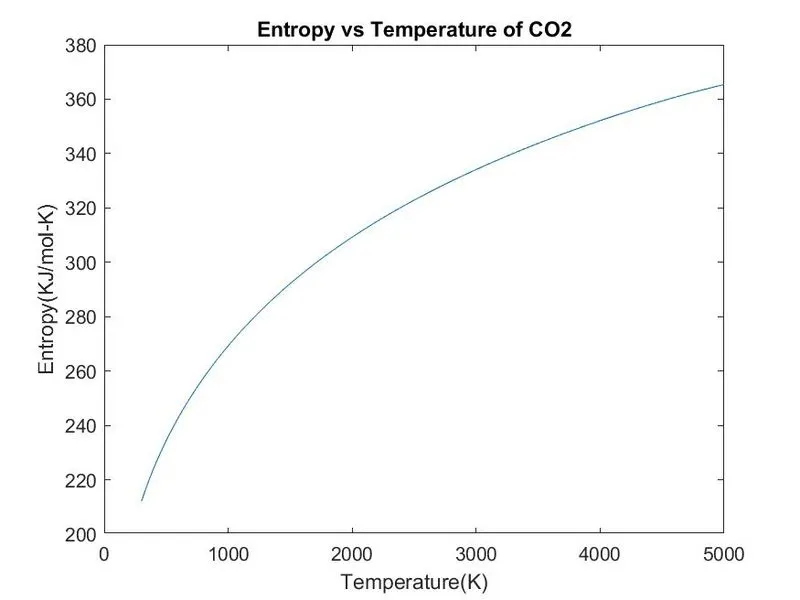
% Plotting S vs T
figure(2)
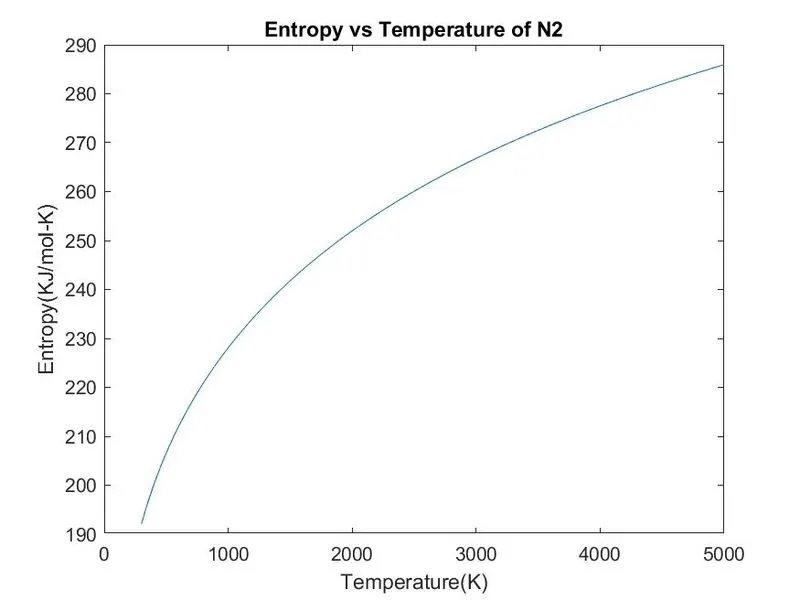
plot(T,S)
xlabel('Temperature(K)')
ylabel('Entropy(KJ/mol-K)')
%To print name of species for the title
title(sprintf('Entropy vs Temperature of %s',species))


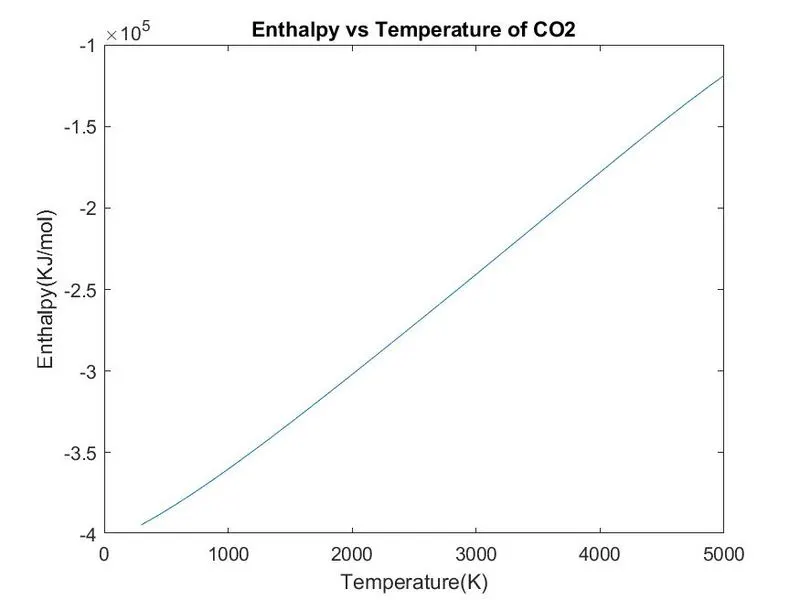
% Plotting H vs T
figure(3)
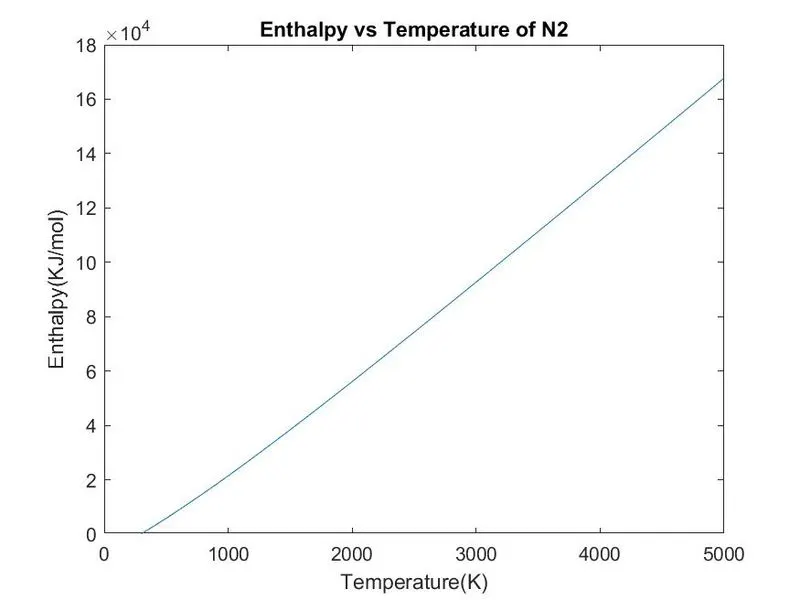
plot(T,H)
xlabel('Temperature(K)')
ylabel('Enthalpy(KJ/mol)')
%To print name of species for the title
title(sprintf('Enthalpy vs Temperature of %s',species))


cd(['C:\Users\ashis\OneDrive\Desktop\mat lab temp\project\',species]);
saveas(figure(1),'Specific heat.jpg')
saveas(figure(2),'Entropy.jpg')
saveas(figure(3),'Enthalpy.jpg')

cd(['C:\Users\ashis\OneDrive\Desktop\mat lab temp\'])

end
fclose(MW);
Specific Heat:
function [cp] = sp_heat(a1,a2,a3,a4,a5,a8,a9,a10,a11,a12,T,R,global_mid_temp)

if(T<= global_mid_temp)
    cp = R*(a8+(a9*T)+(a10*T.^2)+(a11*T.^3)+(a12*T.^4));
else
    cp = R*(a1+(a2*T)+(a3*T.^2)+(a4*T.^3)+(a5*T.^4));
end
end
Entropy:
function [S] = Entropy(a1,a2,a3,a4,a5,a7,a8,a9,a10,a11,a12,a14,T,R,global_mid_temp)

if(T<= global_mid_temp)
    S = R*(a8.*log(T)+(a9*T)+((a10*T.^2)/2)+((a11*T.^3)/3)+((a12*T.^4)/4)+a14);
else
     S = R*(a1.*log(T)+(a2*T)+((a3*T.^2)/2)+((a4*T.^3)/3)+((a5*T.^4)/4)+a7);
end
end
Enthalpy:
function [H] = Enthalpy(a1,a2,a3,a4,a5,a6,a8,a9,a10,a11,a12,a13,T,R,global_mid_temp)

if(T<= global_mid_temp)
    H = R*T.*(a8+((a9*T)/2)+((a10*T.^2)/3)+((a11*T.^3)/4)+((a12*T.^4)/5)+((a13./T)));
else
     H = R*T.*(a1+((a2*T)/2)+((a3*T.^2)/3)+((a4*T.^3)/4)+((a5*T.^4)/5)+((a6./T)));

end
end
Molecular Weight:
function [W] = Mol_wt(species)

% Atomic name
at_name = ['H','C','N','O','Ar'];

% Atomic weight of main species
at_wt = [1 12 14 16 40];

% defining minimum molecular weight
W = 0;
for i= 1:length(species)
    for j = 1:length(at_name)
        if strcmpi(species(i),at_name(j))==1  % comparing 2 strings
            W = W + at_wt(j);
            position = j;
        end
    end


    n= str2double(species(i)); % for more than one element of the species exists, incrementing the atomic weight
    if n>1
        W = W + (at_wt(position)*(n-1));
    end
end

disp(['Molecular weight of ',species,' is'])
disp(W)
Explanation:
- First, open the file THERMO.dat and save it in a variable f1 and set permission to read.
- Use fgetl command to skip the first line as it is not important.
- The second line gives the global tempertaures, so we store the global temperatures in global_temp by using fgetl.
- strsplit command is used to seperate the temperatures which are in form of strings. These temperatures are further converted into numbers by using str2double and give define them as low,mid and high global temperatures.
- Define gas constant R and store the temperature limits in T upto 1000 values by using linspace command.
- To skip the next 3 command lines, a for loop is created and fgetl command is used.
- To read and get the coefficients from thespecies block, another for loop is created.
- In the for loop, the first line is stored in tline variable and a strsplit command is used to define different strings in tline and define the name of species.
- For the next 3 lines in the species block, they are stored in tline1, tline2 and tline3 respectively. The exponential symbol E is used as a reference to seperate the variables.
- The first 7 varaiables are known as higher temperature coefficients and the later are lower temperature coefficients.
- Pre defined functions are used to calculate the specific heat, entropy, enthalpy and molecular weight of individual species as shown.
- A new file is created to store the molecular weights of the species.
- We create a new directory to save the graphs of individual species in individual folder by changing the directory using cd command.
- Plotting of graphs is done by using plot command and saved in the folder created using saveas command.
- Finish the code by closing the for loop.
Results:
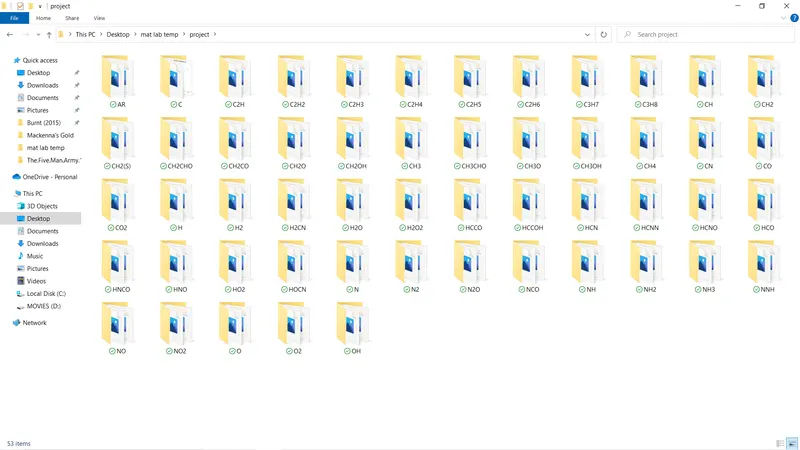
Screenshots of folders
Molecular weights in command window:
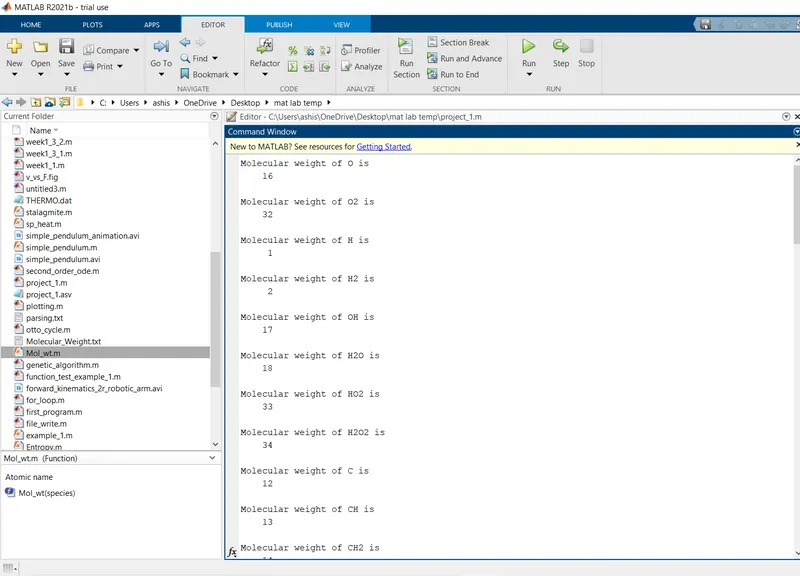
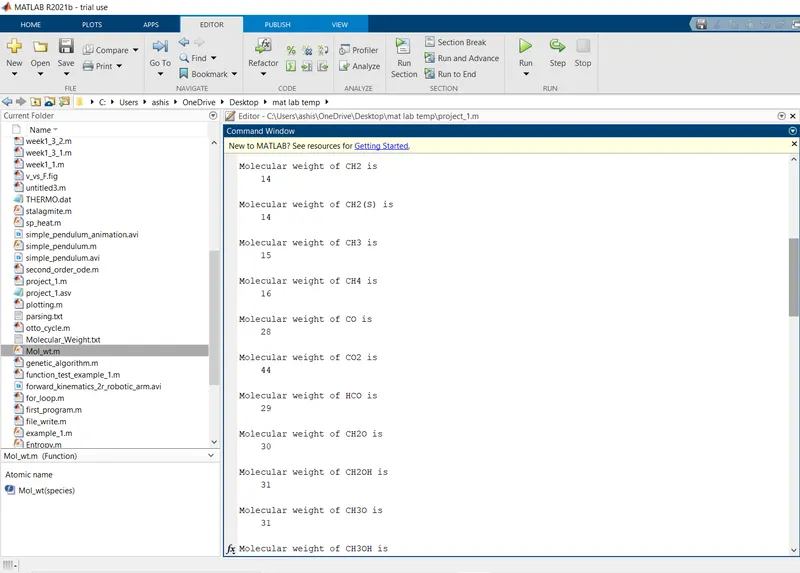
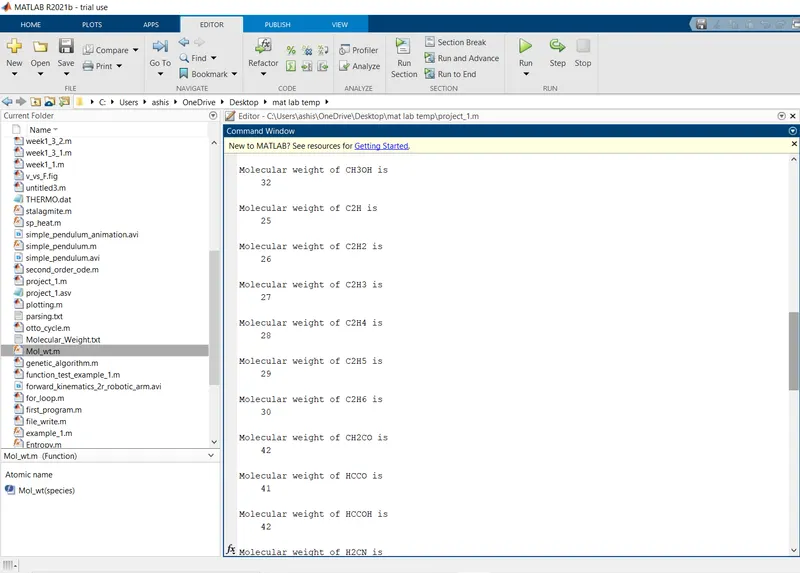
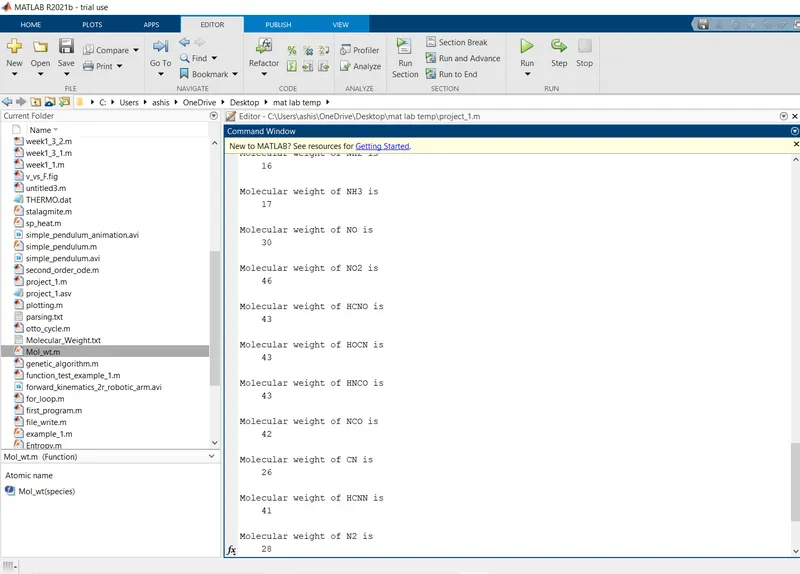
O2:
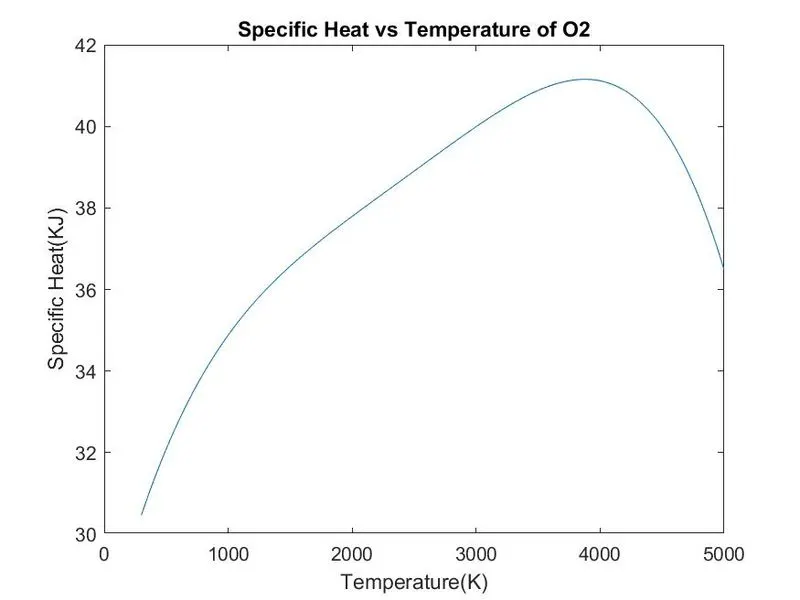
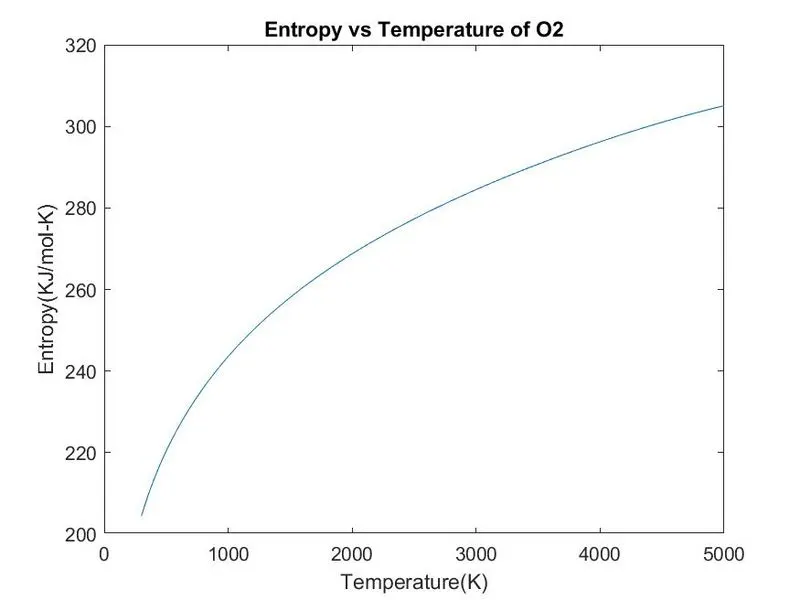
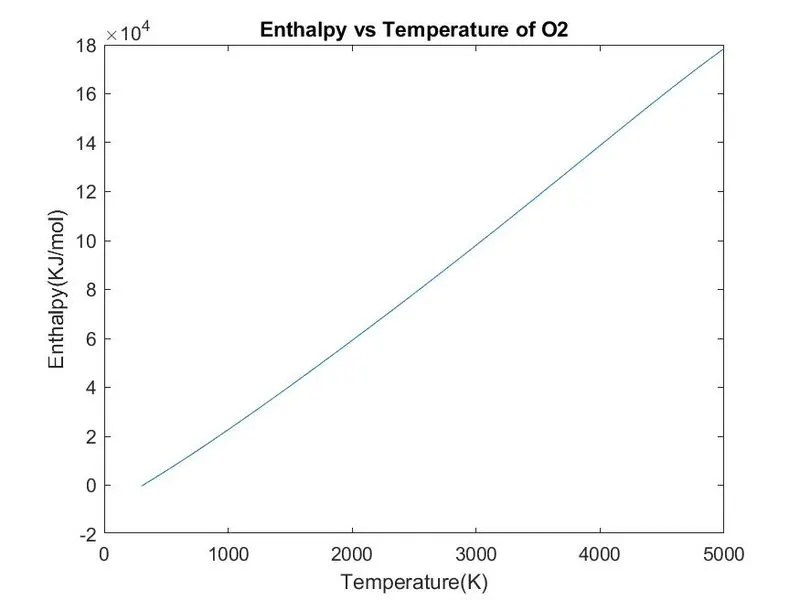
N2:
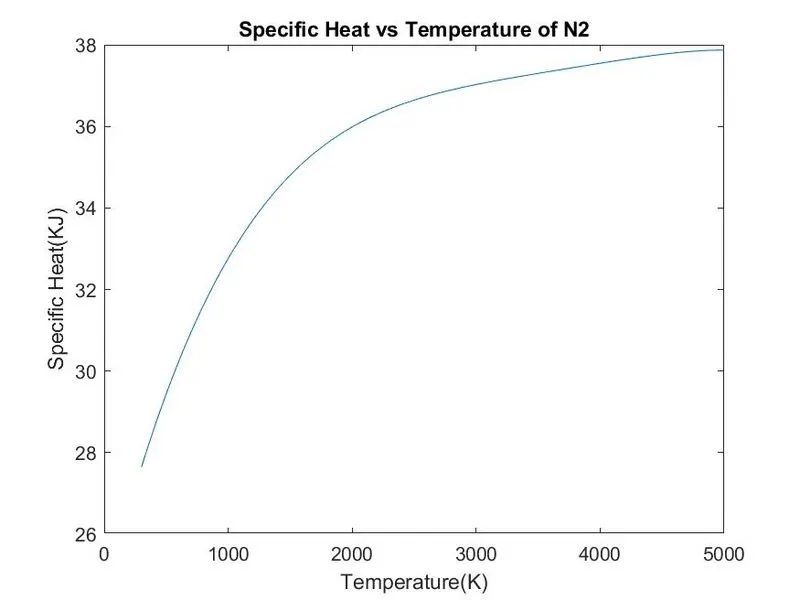
CO2: