Project 1 - Parsing NASA thermodynamic data
Project 1 - Parsing NASA thermodynamic data
Q1. Write a function that extracts the 14 co-efficients and calculates the enthalpy, entropy and specific heats for all the species in the data file.
Ans. MAIN PROGRAM
clear all  % clearing the work space
close all  % close all existing plots
clc        % clearing screen
f1 = fopen('THERMO.dat','r');  %Opens the file NASA containing 'Thermo.dat'

line1 = fgetl(f1);
line2 = fgetl(f1);

comment_1 = fgetl(f1);

comment_2 = fgetl(f1);

comment_3 = fgetl(f1);

A = strsplit(line2,' '); % Splits string on the elements of delimeter
global_low_temperature = str2num(A{2});
global_mid_temperature = str2num(A{3});
global_high_temperature = str2num(A{4});

%species

 for i=1:53
    species = fgetl(f1);
     species = strsplit(species,' ');
    species_name = species{1};
    local_low_temp = str2num(species{end-3});
    local_mid_temp = str2num(species{end-1});
    local_high_temp= str2num(species{end-2});
    tline_1 = fgetl(f1);

    A1 = findstr(tline_1,'E');

    a1 = str2num(tline_1(1:(A1(1)+3)));

    a2 = str2num(tline_1((A1(1)+4):(A1(2)+3)));

    a3 = str2num(tline_1((A1(2)+4):(A1(3)+3)));

    a4 = str2num(tline_1((A1(3)+4):(A1(4)+3)));

    a5 = str2num(tline_1((A1(4)+4):(A1(5)+3)));

    tline_2 = fgetl(f1);

    A2  = strfind(tline_2,'E');

    a6  = str2num(tline_2(1:(A2(1)+3)));

    a7  = str2num(tline_2((A2(1)+4):(A2(2)+3)));

    a8  = str2num(tline_2((A2(2)+4):(A2(3)+3)));

    a9  = str2num(tline_2((A2(3)+4):(A2(4)+3)));

    a10 = str2num(tline_2((A2(4)+4):(A2(5)+3)));


    tline_3 = fgetl(f1);

    A3  = findstr(tline_3,'E');

    a11 = str2num(tline_3(1:(A3(1)+3)));

    a12 = str2num(tline_3((A3(1)+4):(A3(2)+3)));

    a13 = str2num(tline_3((A3(2)+4):(A3(3)+3)));

    a14 = str2num(tline_3((A3(3)+4):(A3(4)+3)));

    %Folder for each species


    T = linspace(local_low_temp,local_high_temp,100);

    R = 8.314;

   %Calculation based on upper amd lower temperature range

   for j = 1:length(T)
       if T(j)<local_mid_temp

   Cp(j) = (a1 + a2.*T(j) + a3.*T(j).^2 + a4.*T(j).^3 + a5.*T(j).^4 ).*R;

   H(j)  = (a1 + a2.*T(j)./2 + a3.*T(j).^2/3 + a4.*T(j).^3/4 + a5.*T(j).^4/5 + a6./T(j)).*R.*T(j);

   S(j)  = (a1.*log(T(j)) + a2.*T (j)+ a3.*T(j).^2/2 + a4.*T(j).^3/3 + a5.*T(j).^4/4 + a7).*R;

       else

   Cp(j) = (a8 + a9.*T(j) + a10.*T(j).^2 + a11.*T(j).^3 + a12.*T(j).^4 ).*R;

   H (j) = (a8 + a9.*T(j)/2 + a10.*T(j).^2/3 + a11.*T(j).^3/4 + a12.*T(j).^4/5 + a13./T(j)).*R.*T(j);

   S (j) = (a8.*log(T(j)) + a9.*T(j) + a10.*T(j).^2/2 + a11.*T(j).^3/3 + a12.*T(j).^4/4 + a14).*R;
       end
   end

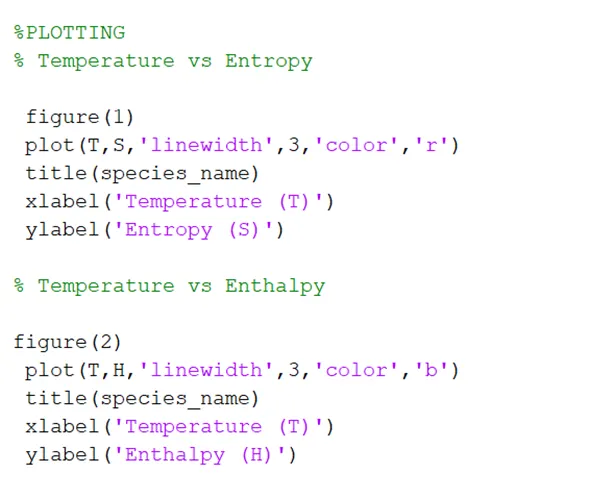
   %PLOTTING
   % Temperature vs Entropy

    figure(1)
    plot(T,S,'linewidth',3,'color','r')
    title(species_name)
    xlabel('Temperature (T)')
    ylabel('Entropy (S)')

   % Temperature vs Enthalpy

   figure(2)
    plot(T,H,'linewidth',3,'color','b')
    title(species_name)
    xlabel('Temperature (T)')
    ylabel('Enthalpy (H)')


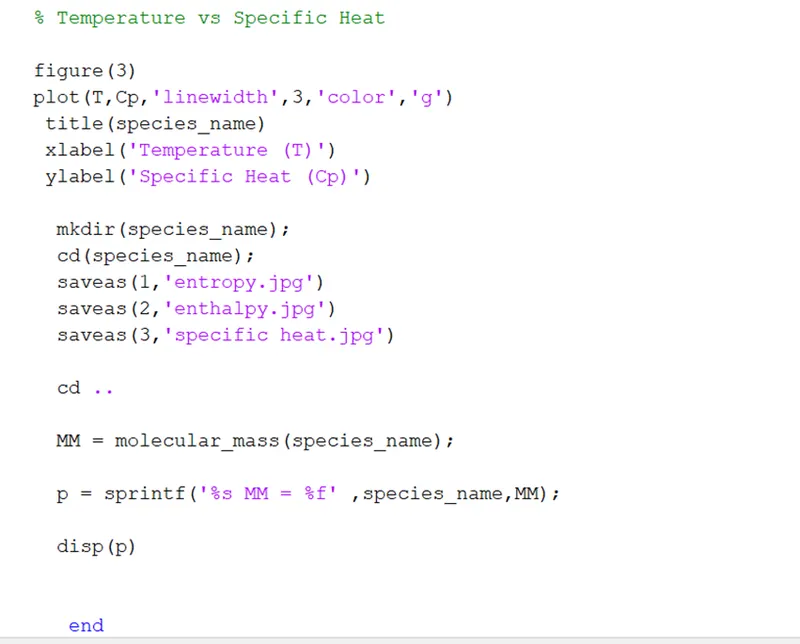
   % Temperature vs Specific Heat

   figure(3)
   plot(T,Cp,'linewidth',3,'color','g')
    title(species_name)
    xlabel('Temperature (T)')
    ylabel('Specific Heat (Cp)')

     mkdir(species_name);
     cd(species_name);
     saveas(1,'entropy.jpg')
     saveas(2,'enthalpy.jpg')
     saveas(3,'specific heat.jpg')

     cd ..

     MM = molecular_mass(species_name);

     p = sprintf('%s MM = %f' ,species_name,MM);

     disp(p)


      end

fclose(f1)
Function - 'molecular_mass'
%Code for molecular mass
function MM = molecular_mass (species_name) %Function take 'species_name' as input and give MM as output

species = upper(species_name); %Species stored in a string


elements = ['H' ,'C' , 'N' , 'O' , 'A' ]; %Element array is used to stored species_name

Atomic_weight = [1 , 12 , 14 , 16 , 40]; %Atomic weight of each element is stored in array called 'Atomic_weight'

MM = 0 ; %Molecular weight  initially set to 0.

for i = 1:length(species_name) %for loop is used to run species_name
    for j = 1:length(elements) %Is used to run entire length of elements
        if strcmp(species(i),elements(j)) %strcmp command is used to compare 2 strings
            MM = MM + Atomic_weight(j);
            u = j;
        end
    end
    n = str2num(species(i)); %str2num command is used to convert string into number
    if n>1
        MM = MM + Atomic_weight(u)*(n-1);
    end
end
end
Q2. Calculate the molecular weight of each species and display it in the command window.
Ans.
O MM = 16.000000
O2 MM = 32.000000
H MM = 1.000000
H2 MM = 2.000000
OH MM = 17.000000
H2O MM = 18.000000
HO2 MM = 33.000000
H2O2 MM = 34.000000
C MM = 12.000000
CH MM = 13.000000
CH2 MM = 14.000000
CH2(S) MM = 14.000000
CH3 MM = 15.000000
CH4 MM = 16.000000
CO MM = 28.000000
CO2 MM = 44.000000
HCO MM = 29.000000
CH2O MM = 30.000000
CH2OH MM = 31.000000
CH3O MM = 31.000000
CH3OH MM = 32.000000
C2H MM = 25.000000
C2H2 MM = 26.000000
C2H3 MM = 27.000000
C2H4 MM = 28.000000
C2H5 MM = 29.000000
C2H6 MM = 30.000000
CH2CO MM = 42.000000
HCCO MM = 41.000000
HCCOH MM = 42.000000
H2CN MM = 28.000000
HCN MM = 27.000000
HNO MM = 31.000000
N MM = 14.000000
NNH MM = 29.000000
N2O MM = 44.000000
NH MM = 15.000000
NH2 MM = 16.000000
NH3 MM = 17.000000
NO MM = 30.000000
NO2 MM = 46.000000
HCNO MM = 43.000000
HOCN MM = 43.000000
HNCO MM = 43.000000
NCO MM = 42.000000
CN MM = 26.000000
HCNN MM = 41.000000
N2 MM = 28.000000
AR MM = 40.000000
C3H8 MM = 44.000000
C3H7 MM = 43.000000
CH3CHO MM = 44.000000
CH2CHO MM = 43.000000
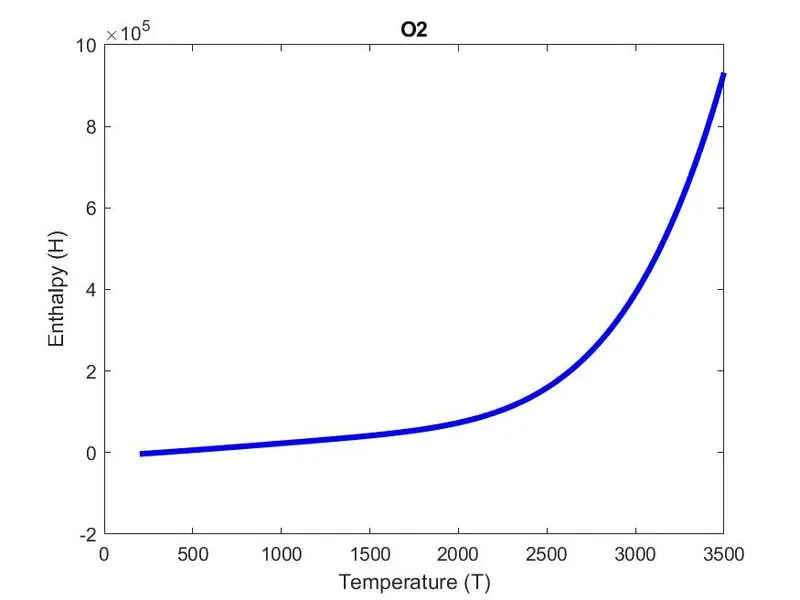
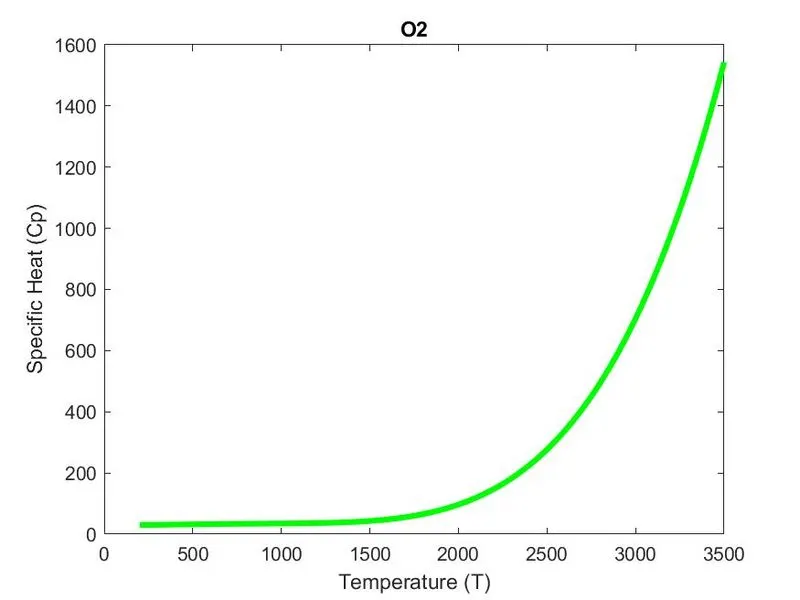
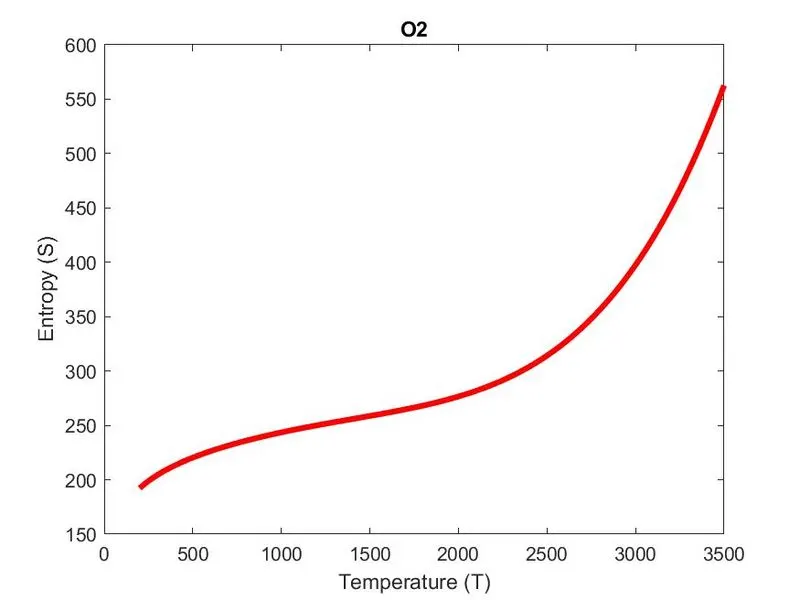
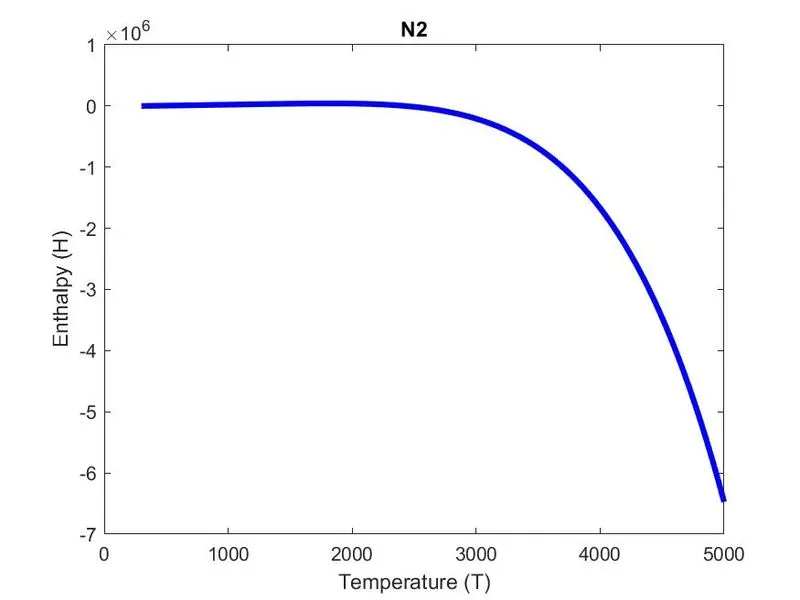
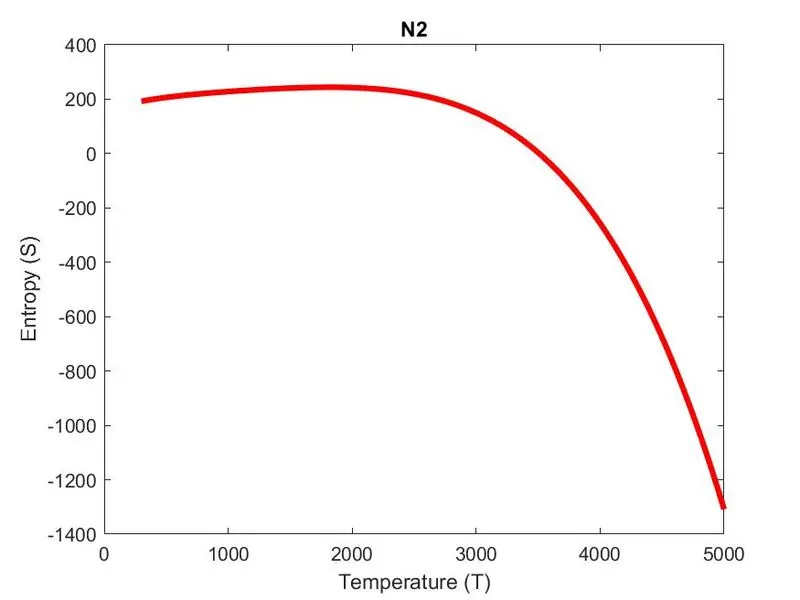
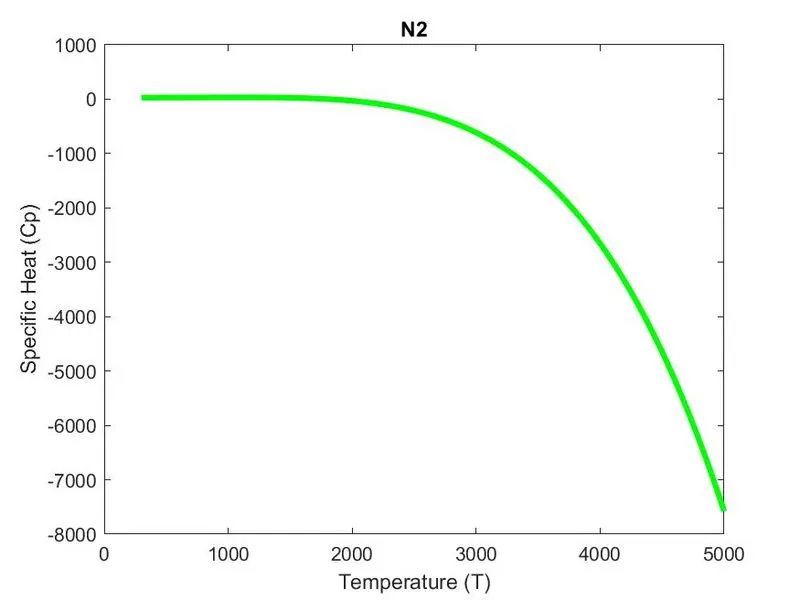
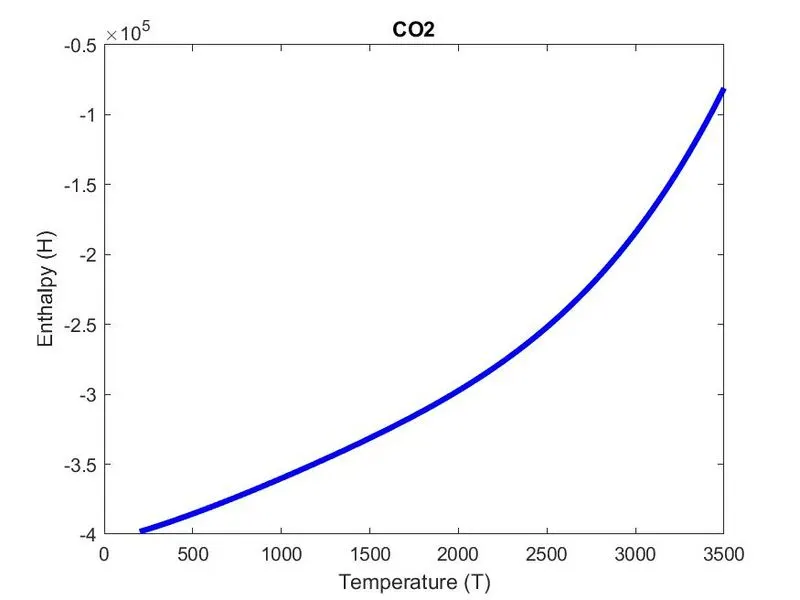
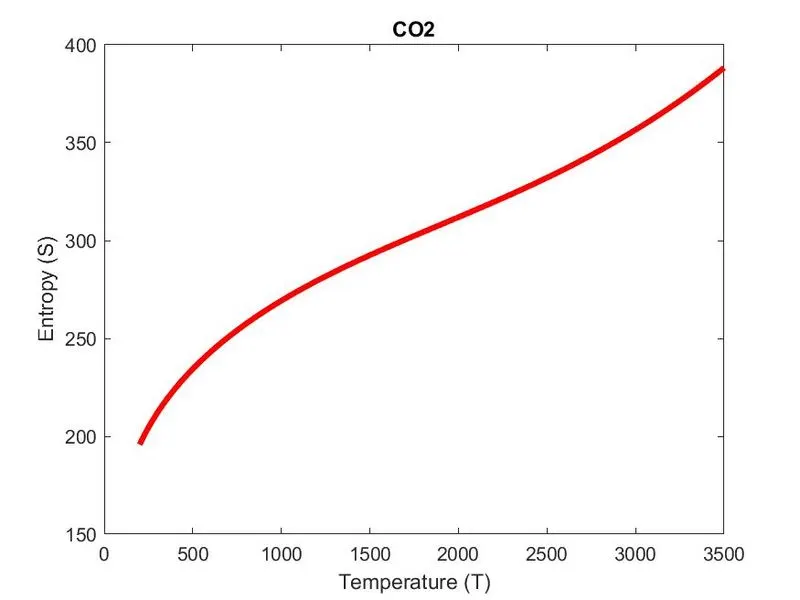
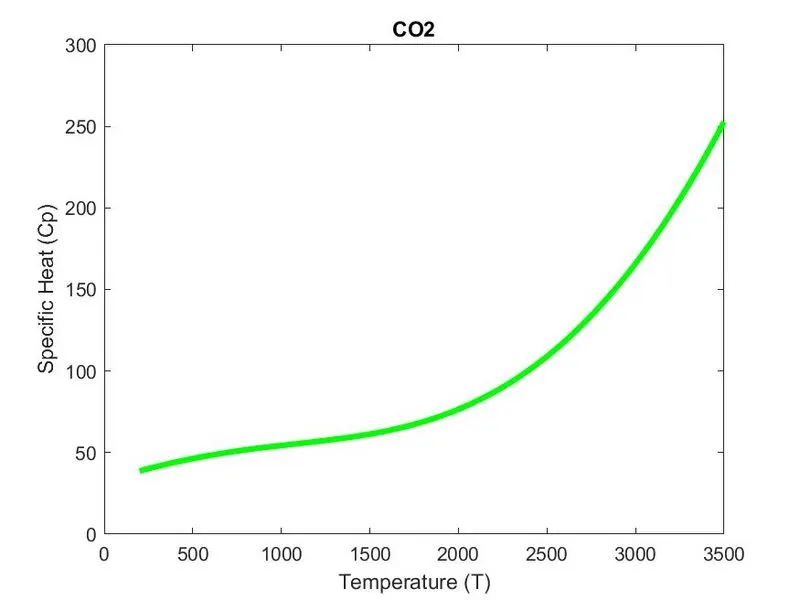
Q3. Plot the Cp, Enthalpy and Entropy for the local temperature range (low temperature : high temperature) specific for each species.
Ans. Plots for O2, N2 & CO2
Q4. Save the plots as images with appropriate names and dump them in separate folders for each species with suitable name. All these should be generated automatically.
Ans.


Q5. The main program that you will submit will just take the "THERMO.dat" file as an input and generate Cp, H and S plots.
Ans.
clear all  % clearing the work space
close all  % close all existing plots
clc        % clearing screen
f1 = fopen('THERMO.dat','r');  %Opens the file NASA containing 'Thermo.dat'

line1 = fgetl(f1);
line2 = fgetl(f1);

comment_1 = fgetl(f1);

comment_2 = fgetl(f1);

comment_3 = fgetl(f1);

A = strsplit(line2,' '); % Splits string on the elements of delimeter
global_low_temperature = str2num(A{2});
global_mid_temperature = str2num(A{3});
global_high_temperature = str2num(A{4});

%species

 for i=1:53
    species = fgetl(f1);
     species = strsplit(species,' ');
    species_name = species{1};
    local_low_temp = str2num(species{end-3});
    local_mid_temp = str2num(species{end-1});
    local_high_temp= str2num(species{end-2});
    tline_1 = fgetl(f1);

    A1 = findstr(tline_1,'E');

    a1 = str2num(tline_1(1:(A1(1)+3)));

    a2 = str2num(tline_1((A1(1)+4):(A1(2)+3)));

    a3 = str2num(tline_1((A1(2)+4):(A1(3)+3)));

    a4 = str2num(tline_1((A1(3)+4):(A1(4)+3)));

    a5 = str2num(tline_1((A1(4)+4):(A1(5)+3)));

    tline_2 = fgetl(f1);

    A2  = strfind(tline_2,'E');

    a6  = str2num(tline_2(1:(A2(1)+3)));

    a7  = str2num(tline_2((A2(1)+4):(A2(2)+3)));

    a8  = str2num(tline_2((A2(2)+4):(A2(3)+3)));

    a9  = str2num(tline_2((A2(3)+4):(A2(4)+3)));

    a10 = str2num(tline_2((A2(4)+4):(A2(5)+3)));


    tline_3 = fgetl(f1);

    A3  = findstr(tline_3,'E');

    a11 = str2num(tline_3(1:(A3(1)+3)));

    a12 = str2num(tline_3((A3(1)+4):(A3(2)+3)));

    a13 = str2num(tline_3((A3(2)+4):(A3(3)+3)));

    a14 = str2num(tline_3((A3(3)+4):(A3(4)+3)));

    %Folder for each species


    T = linspace(local_low_temp,local_high_temp,100);

    R = 8.314;

   %Calculation based on upper amd lower temperature range

   for j = 1:length(T)
       if T(j)<local_mid_temp

   Cp(j) = (a1 + a2.*T(j) + a3.*T(j).^2 + a4.*T(j).^3 + a5.*T(j).^4 ).*R;

   H(j)  = (a1 + a2.*T(j)./2 + a3.*T(j).^2/3 + a4.*T(j).^3/4 + a5.*T(j).^4/5 + a6./T(j)).*R.*T(j);

   S(j)  = (a1.*log(T(j)) + a2.*T (j)+ a3.*T(j).^2/2 + a4.*T(j).^3/3 + a5.*T(j).^4/4 + a7).*R;

       else

   Cp(j) = (a8 + a9.*T(j) + a10.*T(j).^2 + a11.*T(j).^3 + a12.*T(j).^4 ).*R;

   H (j) = (a8 + a9.*T(j)/2 + a10.*T(j).^2/3 + a11.*T(j).^3/4 + a12.*T(j).^4/5 + a13./T(j)).*R.*T(j);

   S (j) = (a8.*log(T(j)) + a9.*T(j) + a10.*T(j).^2/2 + a11.*T(j).^3/3 + a12.*T(j).^4/4 + a14).*R;
       end
   end

   %PLOTTING
   % Temperature vs Entropy

    figure(1)
    plot(T,S,'linewidth',3,'color','r')
    title(species_name)
    xlabel('Temperature (T)')
    ylabel('Entropy (S)')

   % Temperature vs Enthalpy

   figure(2)
    plot(T,H,'linewidth',3,'color','b')
    title(species_name)
    xlabel('Temperature (T)')
    ylabel('Enthalpy (H)')


   % Temperature vs Specific Heat

   figure(3)
   plot(T,Cp,'linewidth',3,'color','g')
    title(species_name)
    xlabel('Temperature (T)')
    ylabel('Specific Heat (Cp)')

     mkdir(species_name);
     cd(species_name);
     saveas(1,'entropy.jpg')
     saveas(2,'enthalpy.jpg')
     saveas(3,'specific heat.jpg')

     cd ..

     MM = molecular_mass(species_name);

     p = sprintf('%s MM = %f' ,species_name,MM);

     disp(p)


      end

fclose(f1)
Q6. Please write a detailed report to describe your logic.
Ans.
Detailed Explanation of the code
Step -1-
The program starts with opening the NASA ‘THERMO.dat’ file using fopen command and reading the file using ‘r’ command.

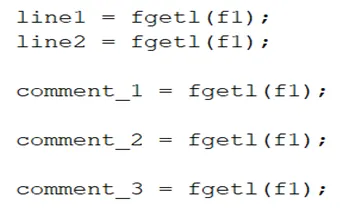
Step -2-
Using ‘fgetl’ command to extract each of the line in the command window. The first extracted line is the header information, and the next 3 lines are comments that is ignored.
Step -3-
Now, use the ‘strsplit’ command to split the string based on the elements of the delimiter. The global temperature values are in the form of a string and to convert it to a number, use the ‘str2num’ command.

Step -4-
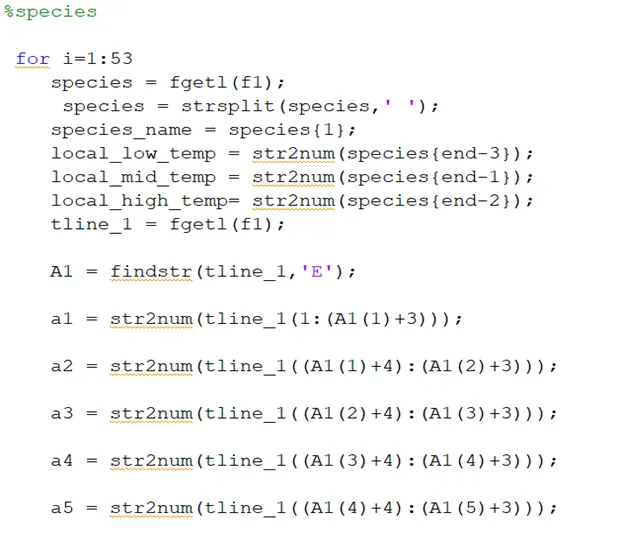
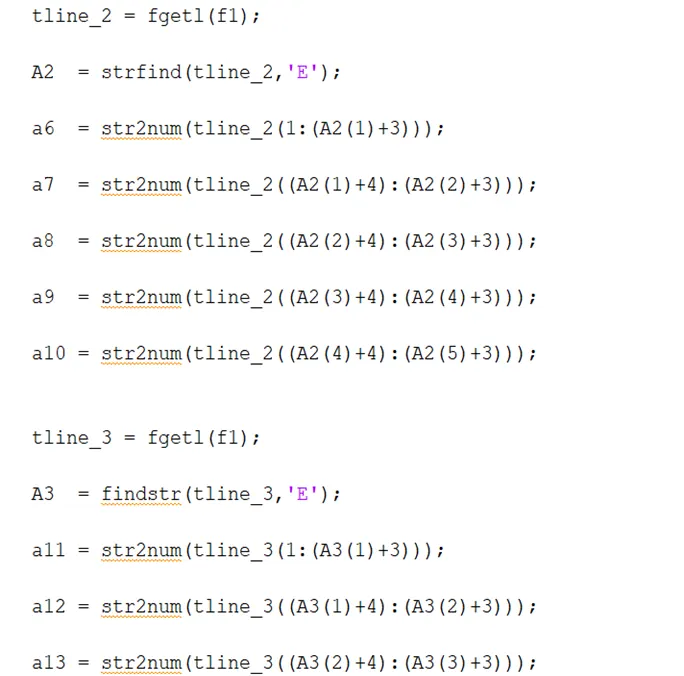
There are 53 species and 14 coefficients in this file and using a ‘for’ loop, names and coefficients of these species will get extracted. The first ‘fgetl’ command extracts the name of the species and the next 3 ‘fgetl’ commands will extract their respective coefficient values. ‘strfind’ command is used to find strings withing other strings.

Step -5-
Creating a folder for each species

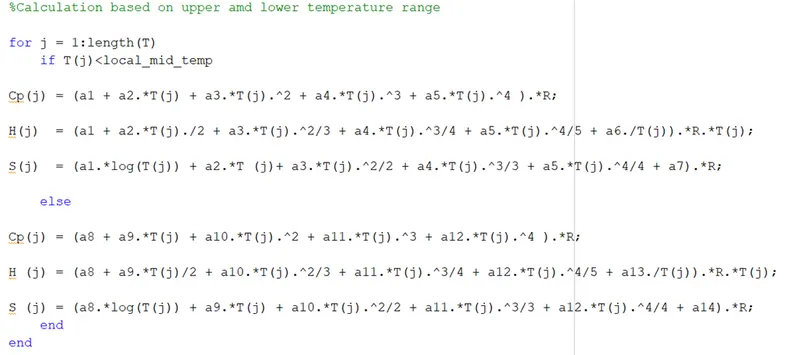
Performing calculations for Specific Heat (Cp), Enthalpy (H) and Entropy (S) for each species
Step -6- END
Plotting the graphs for Specific Heat (Cp) Vs Temp, Enthalpy (H) Vs Temp and Entropy (S) Vs Temp for each individual species and saving it into its respective folder. Here, the temperature is the local temperature range plotted. And, the molecular mass of each of the species is displayed in the command window called via the function named ‘molecular_mass’.
‘mkdir’ command is used to create a new folder.
‘cd’ command is used to change the current folder.
‘saveas’ command is used to save the figure to specific file format.
‘fclose’ closes the file.