Project 1 - Parsing NASA thermodynamic data - MATLAB
OBJECTIVES
- Write a function that extracts the 14 co-efficients and calculates the enthalpy, entropy and specific heats for all the species in the data file.
- Calculate the molecular weight of each species and display it in the command window.
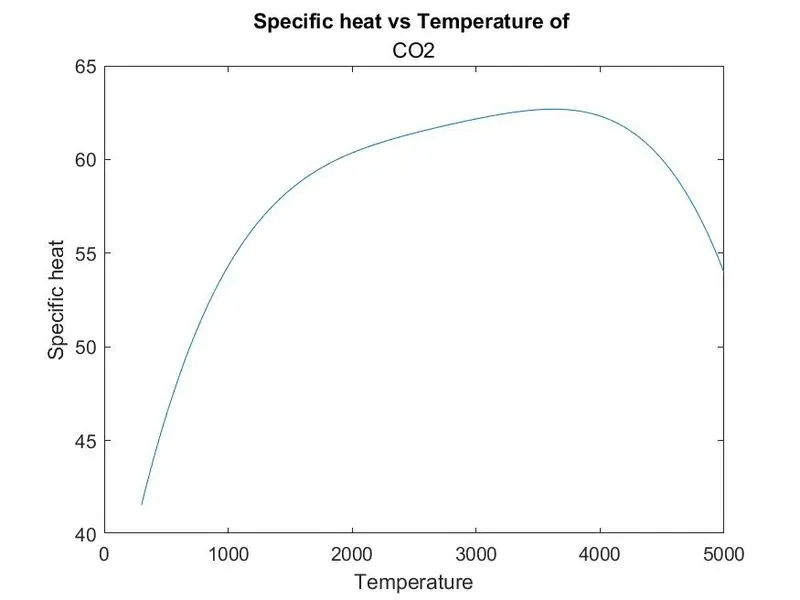
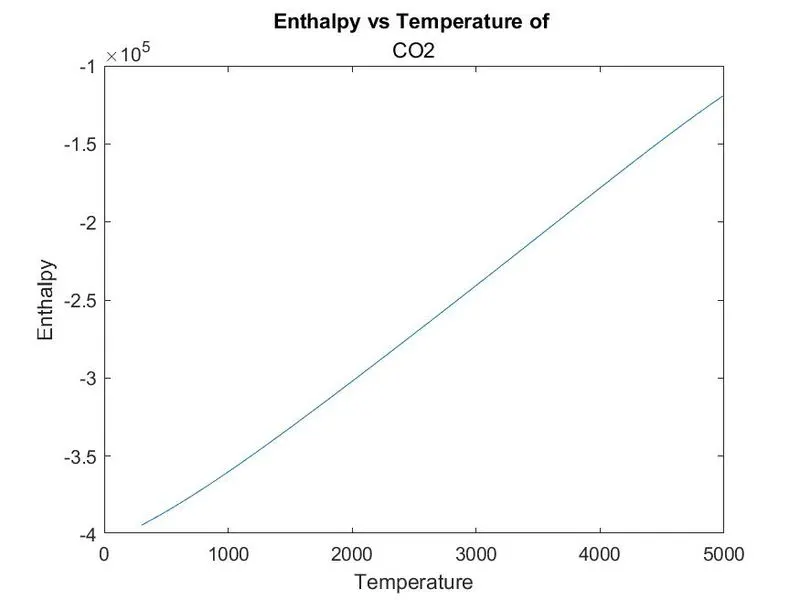
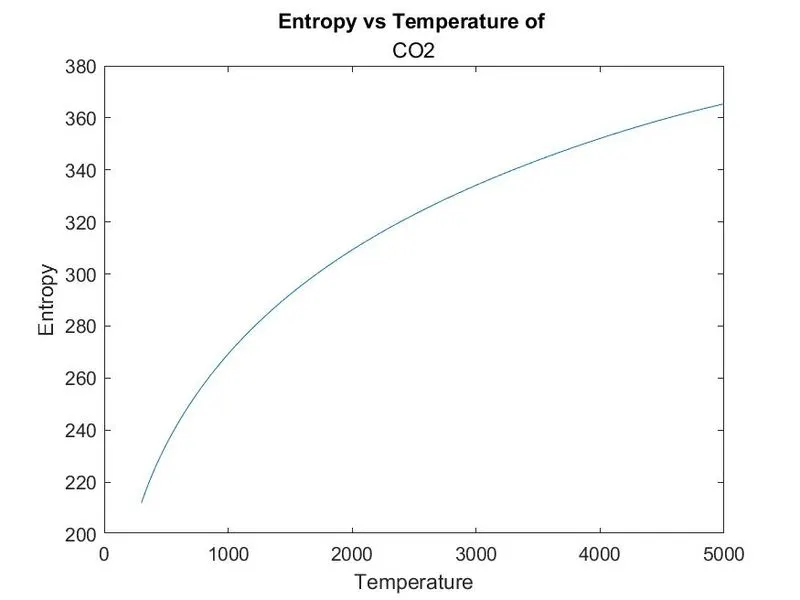
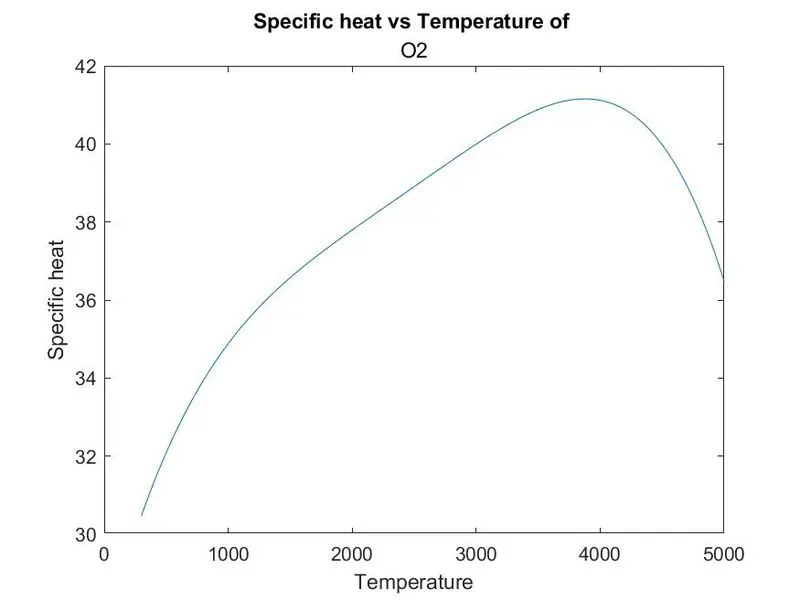
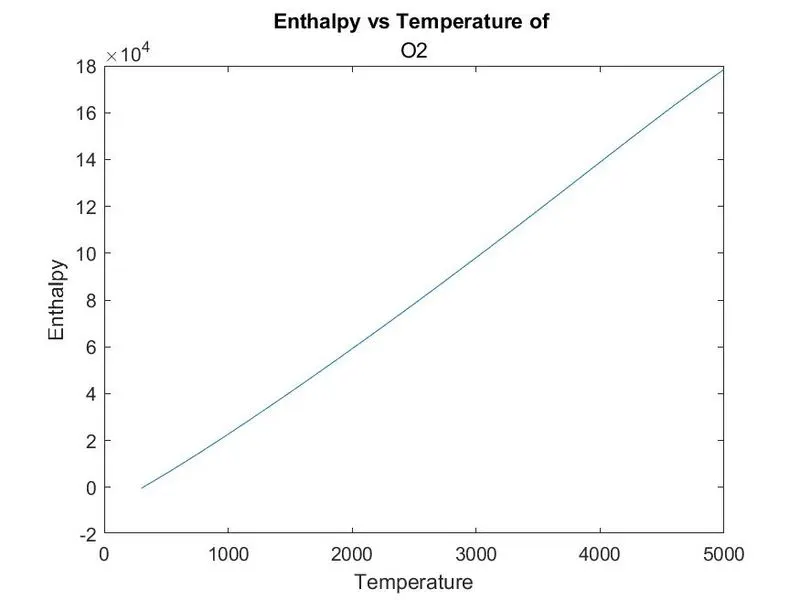
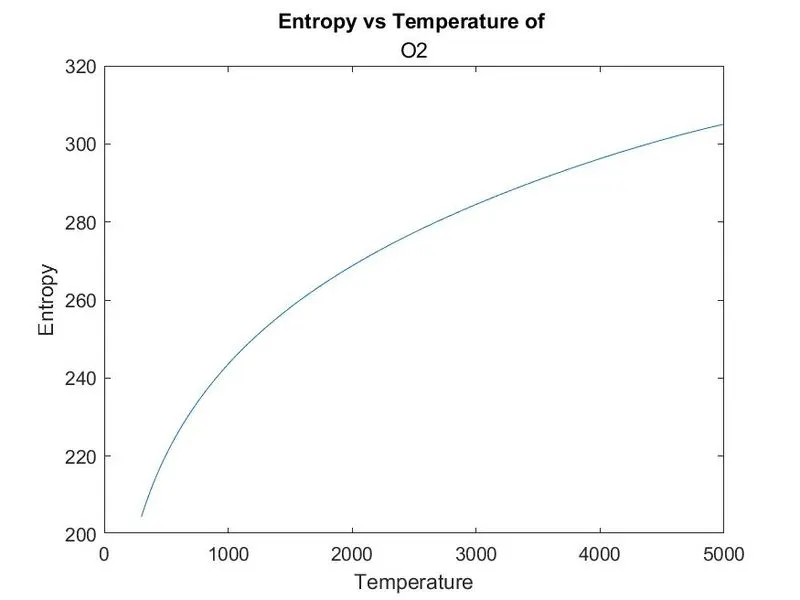
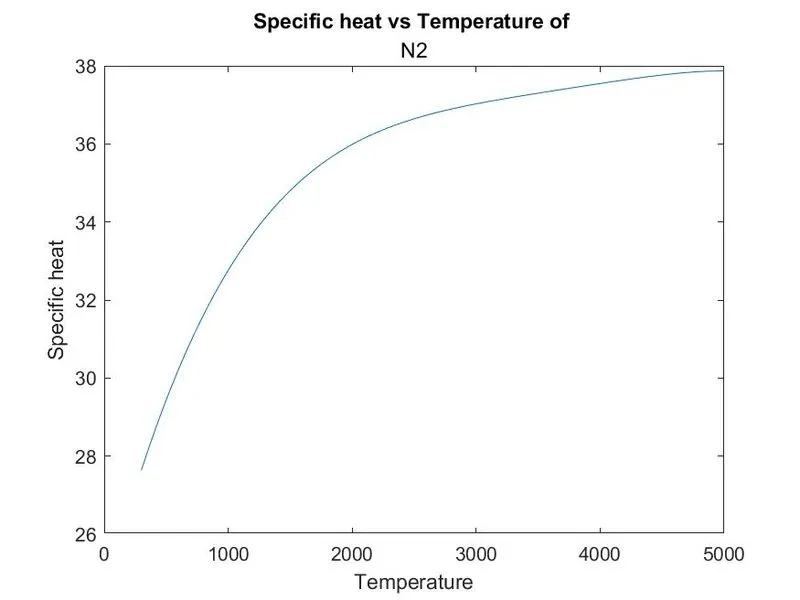
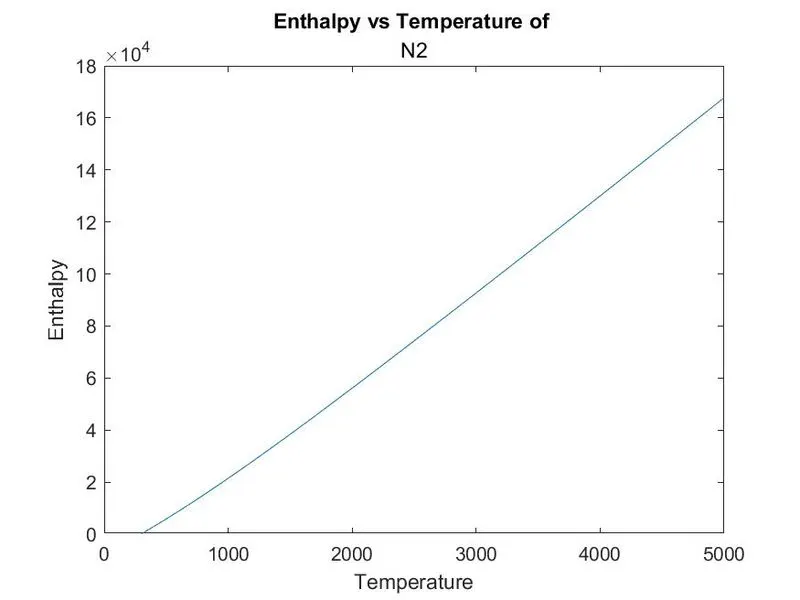
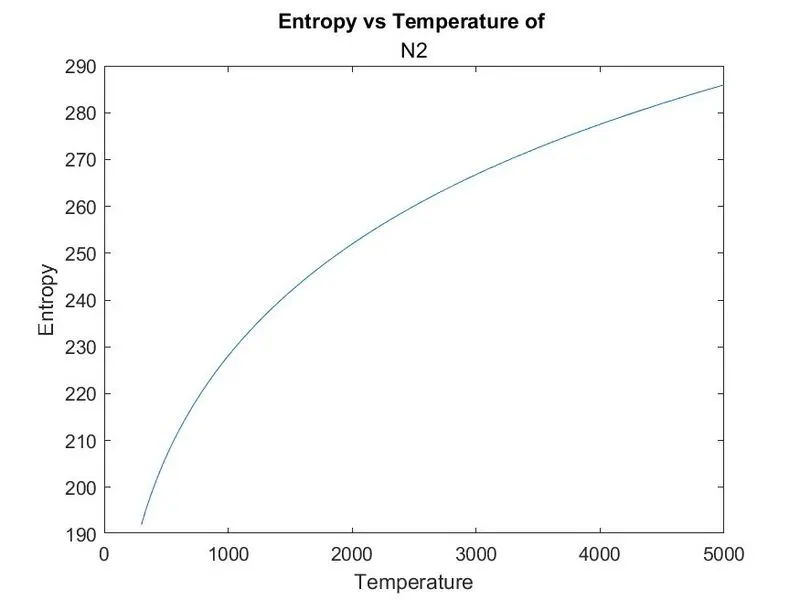
- Plot the Cp, Enthalpy and Entropy for the local temperature range.
- Save the plots as images with appropriate names and dump them in separate folders for each species with suitable name. All these should be generated automatically.
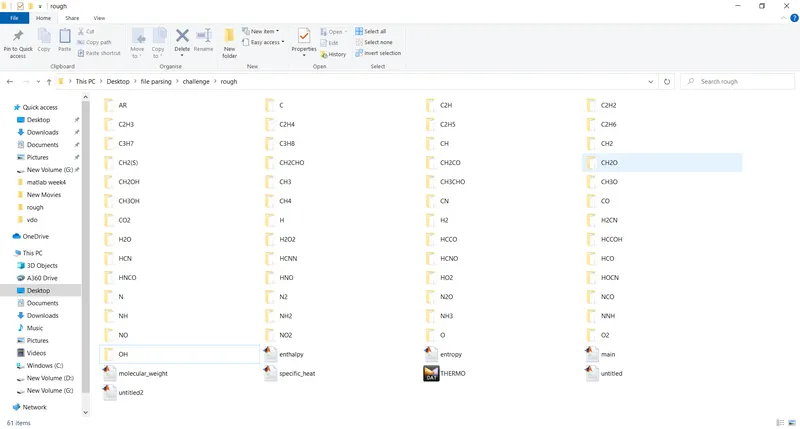
- Screenshot of the window where all the folders are saved.
- Plots for o2, N2 and Co2 species.
THEORY
- File Parsing
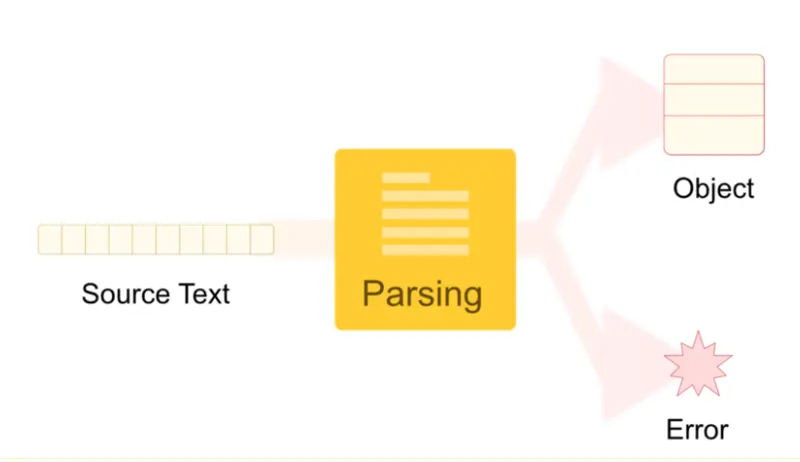
Parsing a file means reading in a data stream of some sort and building an in memory model of the semantic content of that data. This aims at facilitating perfoming some kind of transformation on the data.
Parsing is a process of converting formatted text into a data structure. A data structure type can be any suitable representation of the information engraved in the source text.
MATLAB CODE
- Main Code
% File Parsing - NASA thermodynamic data

clear all
close all
clc

% opening file
f1 = fopen('THERMO.dat','r');

% skipping first line
fgetl(f1);

% global temperatures
temps = fgetl(f1);
temps = str2num(temps);

global_low_temp = temps(1);
global_mid_temp = temps(2);
global_high_temp = temps(3);

% creating array for temperature
T = linspace(global_low_temp,global_high_temp,500);

% universal gas constant
R = 8.314;

% skipping next 3 lines
for i=1:3
    fgetl(f1);
end

% storing starts
for i=1:53

    % creating array for species
    tline = fgetl(f1);
    A = strsplit(tline,' ');
    % species
    species = A{1};

    %local temperatures
    tlow = str2num(A{end-3});
    thigh = str2num(A{end-2});
    tmid = str2num(A{end-1});

    % finding coefficients
    % line 1
    tline1 = fgetl(f1);
    pos1 = findstr(tline1,'E');

    % higher coefficients
    a1 = str2num(tline1(1:pos1(1)+3));
    a2 = str2num(tline1(pos1(1)+4:pos1(2)+3));
    a3 = str2num(tline1(pos1(2)+4:pos1(3)+3));
    a4 = str2num(tline1(pos1(3)+4:pos1(4)+3));
    a5 = str2num(tline1(pos1(4)+4:pos1(5)+3));

    % line 2
    tline2 = fgetl(f1);
    pos2 = findstr(tline2,'E');
    a6 = str2num(tline2(1:pos2(1)+3));
    a7 = str2num(tline2(pos2(1)+4:pos2(2)+3));

    % lower coefficients
    a8 = str2num(tline2(pos2(2)+4:pos2(3)+3));
    a9 = str2num(tline2(pos2(3)+4:pos2(4)+3));
    a10 = str2num(tline2(pos2(4)+4:pos2(5)+3));

    % line 3
    tline3 = fgetl(f1);
    pos3 = findstr(tline3,'E');
    a11 = str2num(tline3(1:pos3(1)+3));
    a12 = str2num(tline3(pos3(1)+4:pos3(2)+3));
    a13 = str2num(tline3(pos3(2)+4:pos3(3)+3));
    a14 = str2num(tline3(pos3(3)+4:pos3(4)+3));

    % specific heat
    cp = specific_heat(a1,a2,a3,a4,a5,a8,a9,a10,a11,a12,tmid,T,R);

    % enthalpy
    H = enthalpy(a1,a2,a3,a4,a5,a6,a8,a9,a10,a11,a12,a13,tmid,R,T);

    % entropy
    S = entropy(a1,a2,a3,a4,a5,a7,a8,a9,a10,a11,a12,a14,tmid,T,R);

    % changing directory
    cd('C:UsersuserDesktopfile parsingchallengerough')

    % creating newfolder for species
    mkdir(species)

    % changing directory
    cd(species)

    % plotting

    figure(1)
    plot(T,cp)
    xlabel('Temperature')
    ylabel('Specific heat')
    title('Specific heat vs Temperature of ',sprintf('%s',species))
    saveas(figure(1),'cp vs T.jpg')

    figure(2)
    plot(T,H)
    xlabel('Temperature')
    ylabel('Enthalpy')
    title('Enthalpy vs Temperature of ',sprintf('%s',species))
    saveas(figure(2),'H vs T.jpg')

    figure(3)
    plot(T,S)
    xlabel('Temperature')
    ylabel('Entropy')
    title('Entropy vs Temperature of ',sprintf('%s',species))
    saveas(figure(3),'S vs T.jpg')

    % coming back to program directory
    cd('C:UsersuserDesktopfile parsingchallengerough')

    % calculating molecular weight of species
    M = molecular_weight(species);

end- Function Code - Specific Heat
function [cp] = specific_heat(a1,a2,a3,a4,a5,a8,a9,a10,a11,a12,tmid,T,R)

    % finding specific heat with low and temperature variables
    if T<=tmid
        cp = (a8+(a9*T)+(a10*T.^2)+(a11*T.^3)+(a12*T.^4))*R;
    else
        cp = (a1+(a2*T)+(a3*T.^2)+(a4*T.^3)+(a5*T.^4))*R;
    end

end- Function Code - Enthalpy
function [H] = enthalpy(a1,a2,a3,a4,a5,a6,a8,a9,a10,a11,a12,a13,tmid,R,T)

    % finding enthalpy with low and temperature variables
    if T<=tmid
        H = (a8+(a9*T/2)+(a10*(T.^2)/3)+(a11*(T.^3)/4)+(a12*(T.^4)/5)+(a13./T))*R.*T;
    else
        H = (a1+(a2*T/2)+(a3*(T.^2)/3)+(a4*(T.^3)/4)+(a5*(T.^4)/5)+(a6./T))*R.*T;
    end

end- Function Code - Entropy
function [S] = entropy(a1,a2,a3,a4,a5,a7,a8,a9,a10,a11,a12,a14,tmid,T,R)

    % finding entropy with low and temperature variables
    if T<=tmid
        S = ((a8*log(T))+(a9*T)+(a10*(T.^2)/2)+(a11*(T.^3)/3)+(a12*(T.^4)/4)+a14)*R;
    else
        S = ((a1*log(T))+(a2*T)+(a3*(T.^2)/2)+(a4*(T.^3)/3)+(a5*(T.^4)/4)+a7)*R;
    end

end- Function Code - Molecular weight of species
function [W] = molecular_weight(species)

    atomic_names = ['H', 'C', 'O', 'N', 'Ar'];
    atomic_weights = [1.00784, 12.0107, 15.999, 14.0067, 39.948];
    W=0;

    for i=1:length(species)
        for j=1:length(atomic_names)
            if species(i)==atomic_names(j)
                W=W+atomic_weights(j);
                position = j;
            end
        end
        n=str2num(species(i));
        if n>=1
            W=W+atomic_weights(position)*(n-1);
        end
    end
    fprintf('Molecular weight of %s = %f',species,W)
    disp(' ')
end
CODE EXPLANATION
- Main Code
- clear all - To clear all variables from the current workspace
- close all - close all closes all figures whose handles are visible.
- clc - clears all the text from the Command Window.
- fopen - It opens the file, filename , for binary read access, and returns an integer file identifier equal to or greater than 3.
- fgetl - fgetl returns an output that displays in one line.
- Line 14 to 19 - Read and store the global temperature values to seperate variables.
- str2num - converts a character array or string scalar to a numeric matrix.
- Line 22 - Creating array for Temperature.
- linspace - The linspace function generates linearly spaced vectors.
- Line 28 to 30 - Skipping next 3 lines using fgetl() command.
- Line 36 to 39 - Creating a variable for storing species names.
- strsplit - It is used to split a string. We should enter the string ID and delimiter.
- A{1} - It is used to indexing in cell arrays. After string splitting A becomes an cell array.
- Line 42 to 44 - Defining local temperatures.
- Line 48 to 75 - Extracting and stores coefficients from the dat file.
- findstr - It is used to find a particular string in a collection of strings. We should define the string array and letter that need to be found inside that function. The command gives the position of the letters in the string.
- Line 78 - Calling specific_heat function for storing the values of specific heats of species into 'cp'.
- Line 81 - Calling enthalpy function for storing the values of enthalpies of species into 'H'.
- Line 84 - Calling entropy function for storing the values of entropies of species into 'S'.
- cd - To change directory.
- mkdir - It is used to create a newfolder. Name of the folder should be mentioned inside the brackets.
- Line 97 to 116 - Plotting graphs of cp vs T, H vs T and S vs T.
- plot - The plot function in Matlab is used to create a graphical representation of some data.
- xlabel - To label x-axis.
- ylabel - To label y-axis.
- title - To add a title to a plot.
- saveas - saveas(fig ,filename) saves the figure specified by fig to file filename.
- Line 122 - Calling molecular_weight function for storing the values of molecular weights into 'M'.
- Function Code - Specific Heat
- Line 4 to 8 - Introducing 'if' and 'else' conditional statement inorder to pass the right coefficients to find Specific heat.
- Function Code - Enthalpy
- Line 4 to 8 - Introducing 'if' and 'else' conditional statement inorder to pass the right coefficients to find Enthalpy.
- Function Code - Entropy
- Line 4 to 8 - Introducing 'if' and 'else' conditional statement inorder to pass the right coefficients to find Entropy.
- Function Code - Molecular weight of species
- Line 3 - Since all the 53 species are made of H,C,O,N,Ar only, we are creating a string array for these.
- Line 4 - Creating array for the atomic weights of these five atoms.
- Line 7 to 18 - Introducing for loops and if conditional statements inorder to calculate molecular weight of species.
- fprintf - The fprintf command displays formatted text centered on the icon and can display format specifier along with the contents of variables.
- disp - disp(X) displays the value of variable X without printing the variable name.
RESULT
- Screenshot of the window
- Plots for O2
- Plots for N2
- Plots for CO2