Project 1 - Parsing NASA thermodynamic data

Report:
1. Open the given file with all the data.
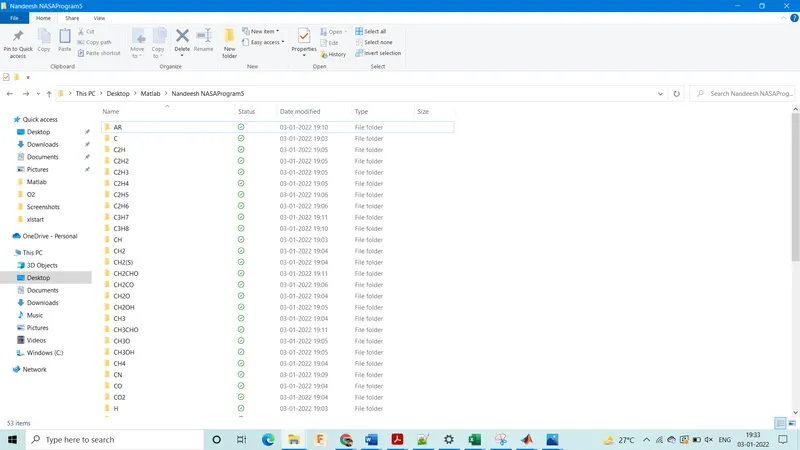
2. Extracted all species data & names from the file.
3. Extracted local gas temperatures of the species.
4. Extracted the coefficients for the gas species.
5. Created range of temperatures & assign the universal gas constant.
6. Calculate the specific heat, enthalpy & entropy using formulae given based on low & high temperature coefficients.
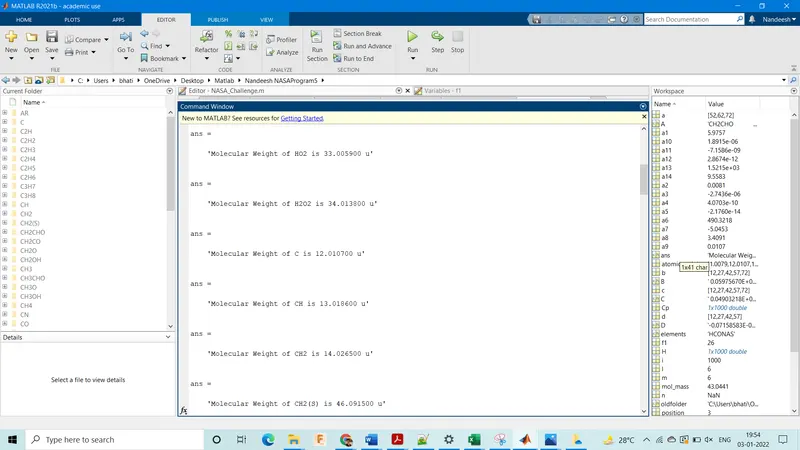
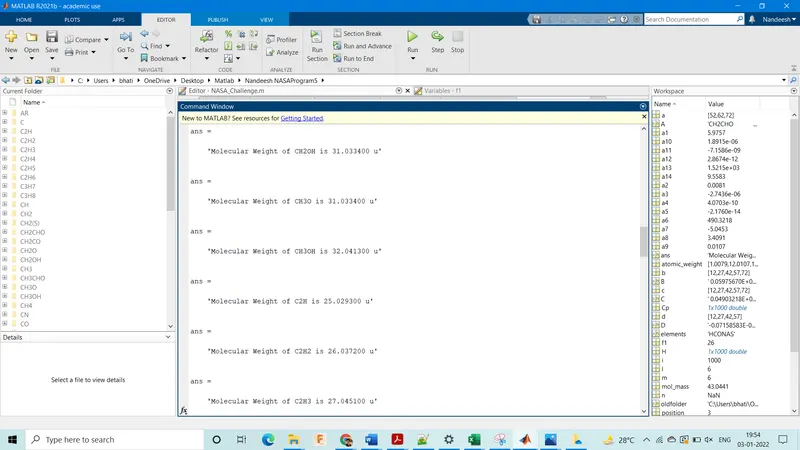
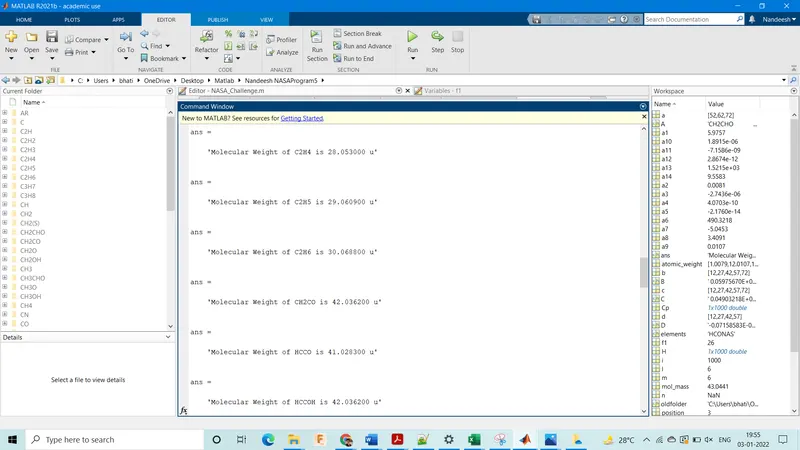
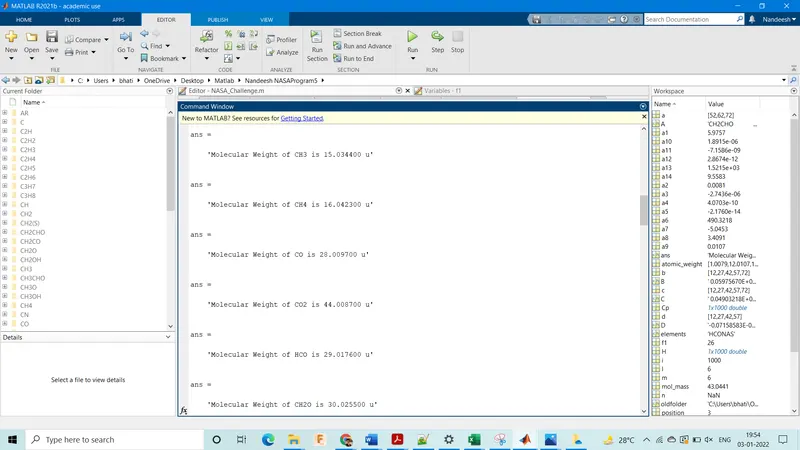
7. Declare species & molecular weight of each element.
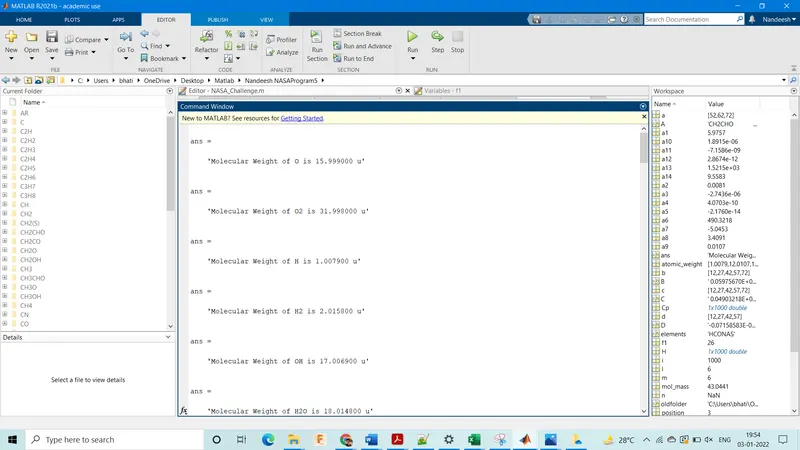
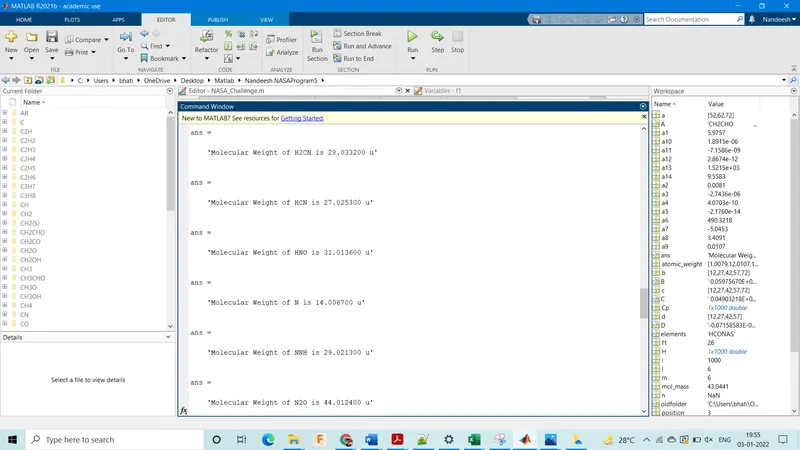
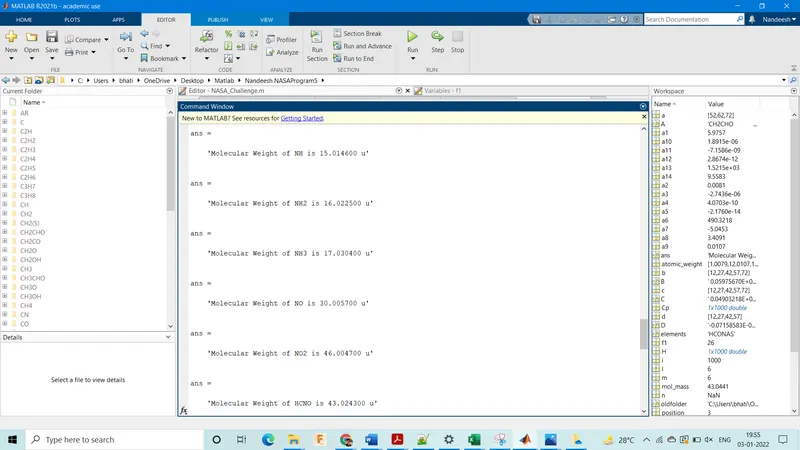
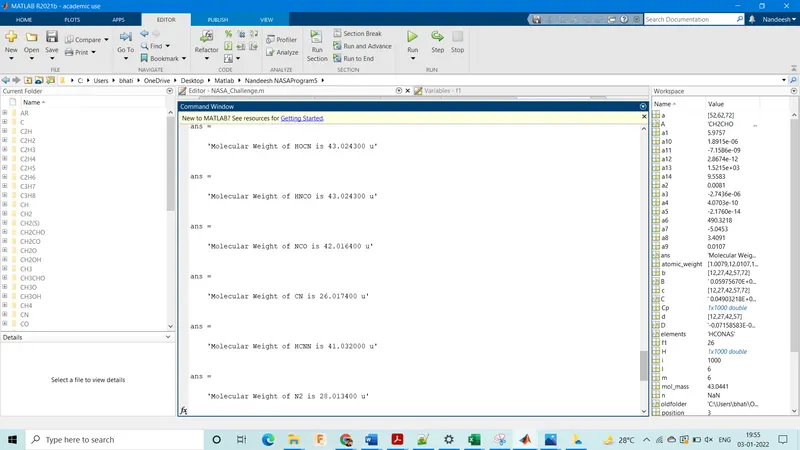
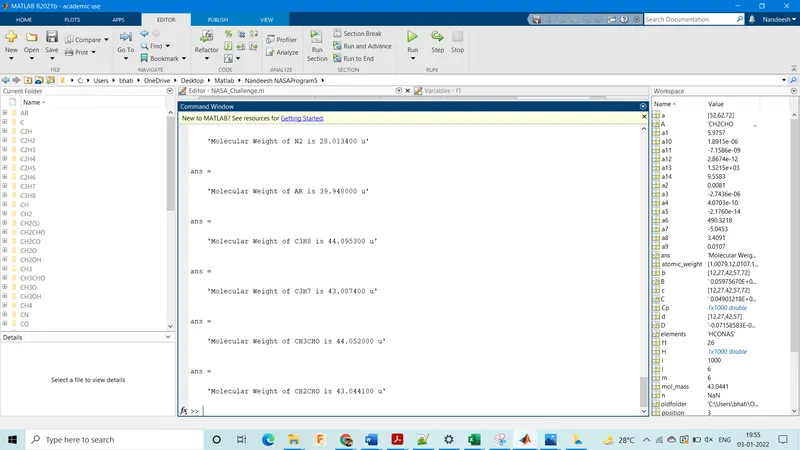
8. Calculate & print the molecular weight of each element.
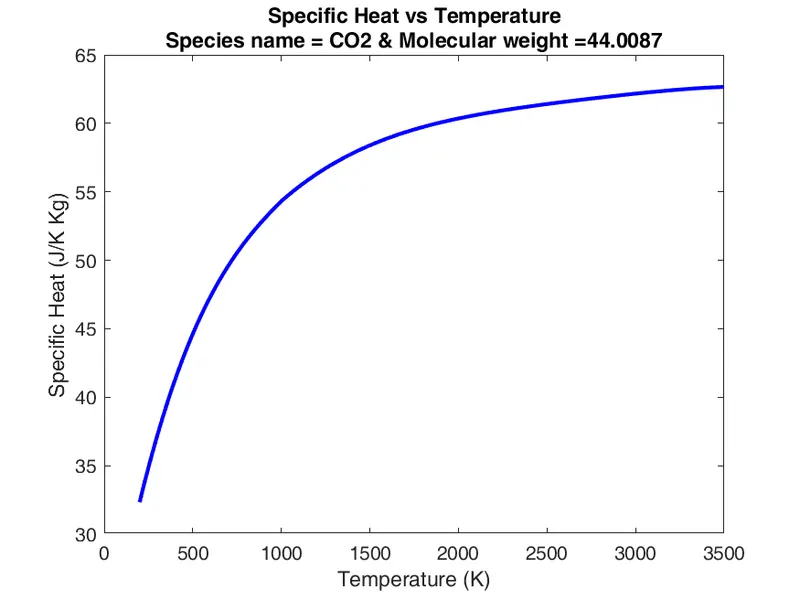
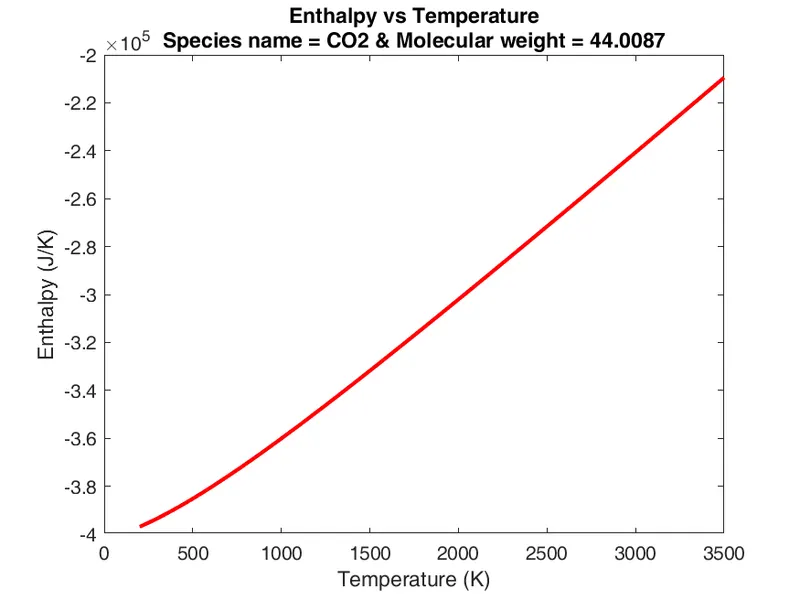
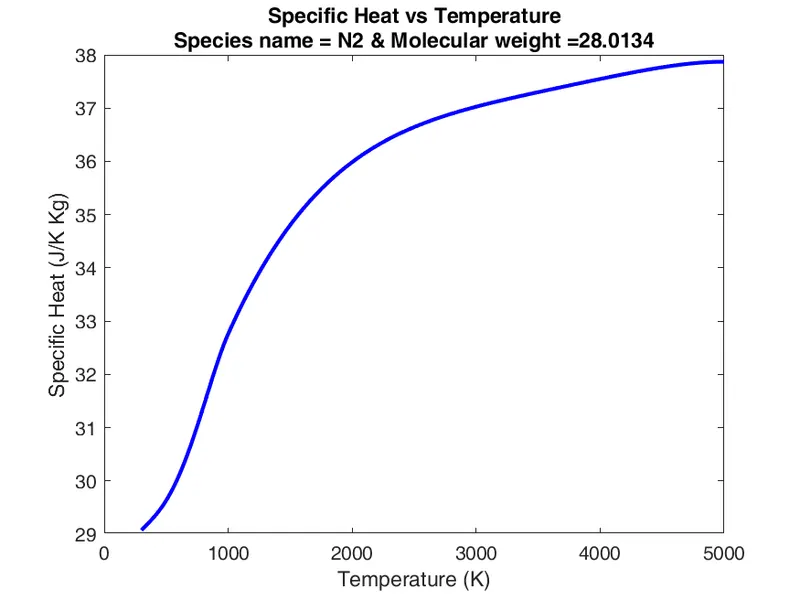
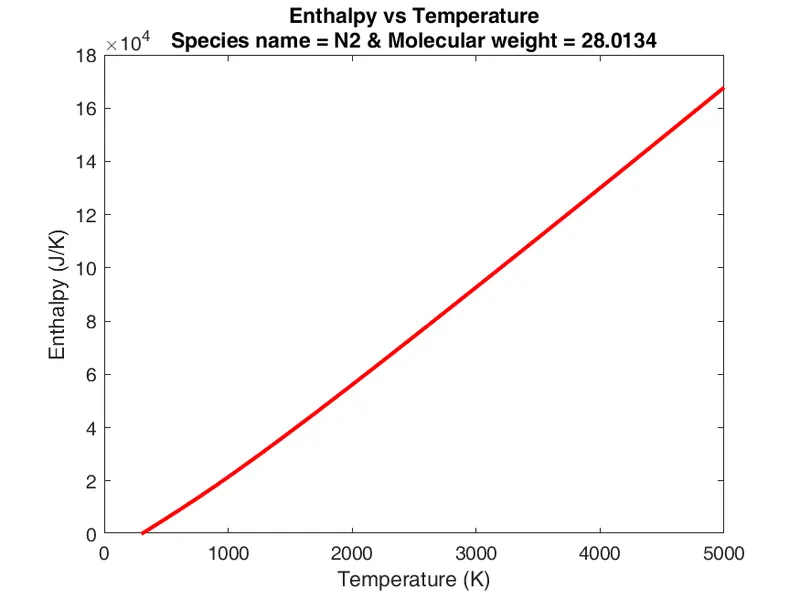
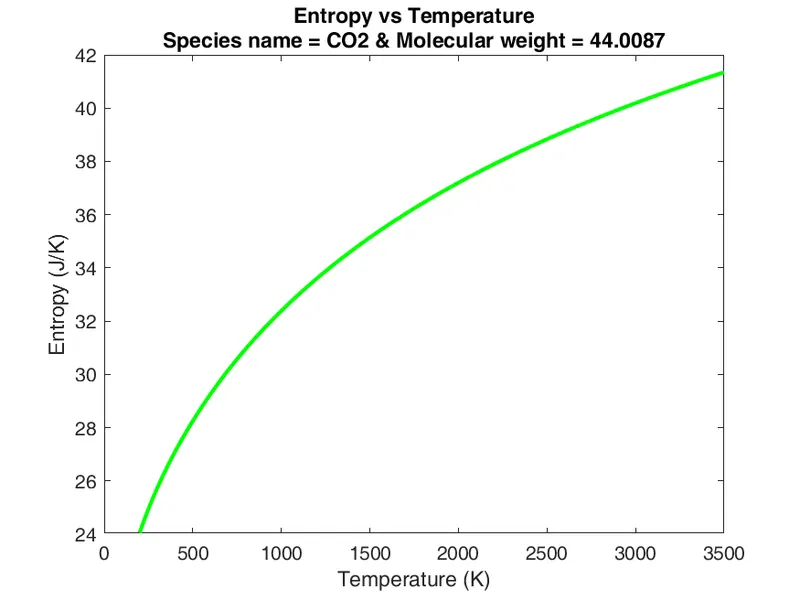
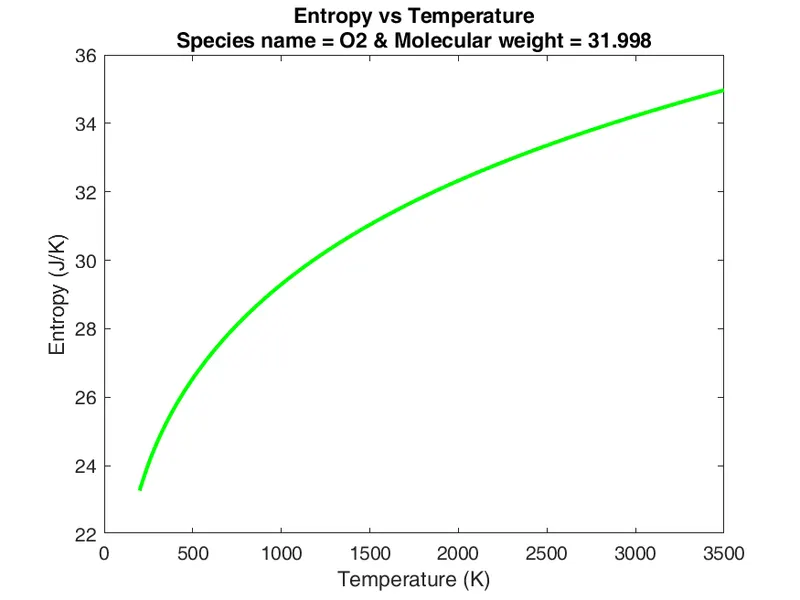
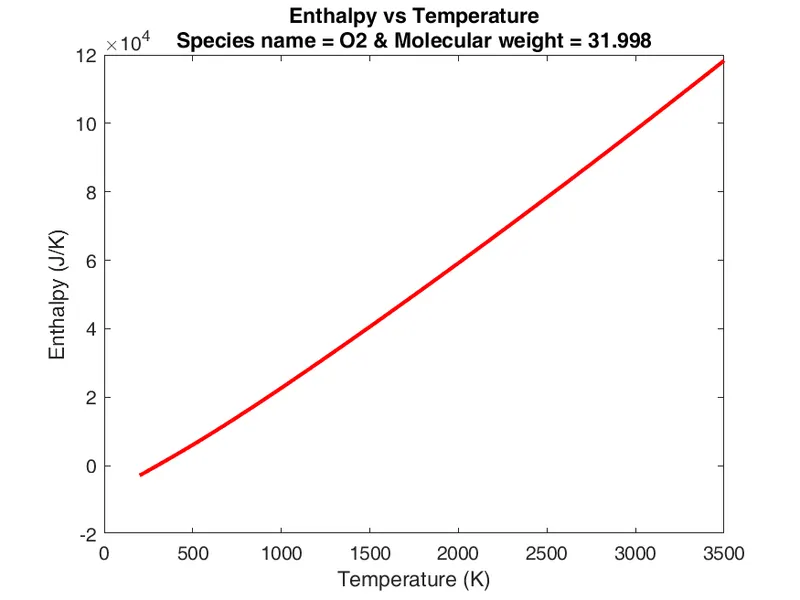
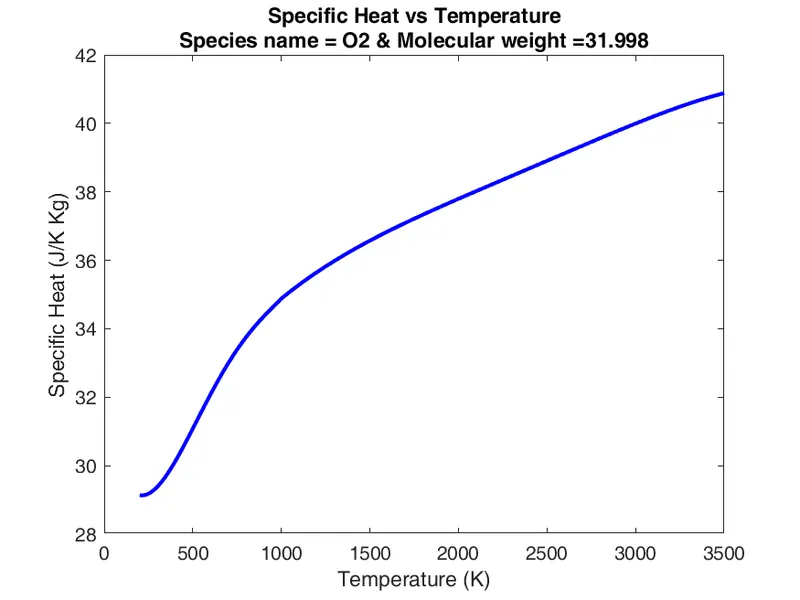
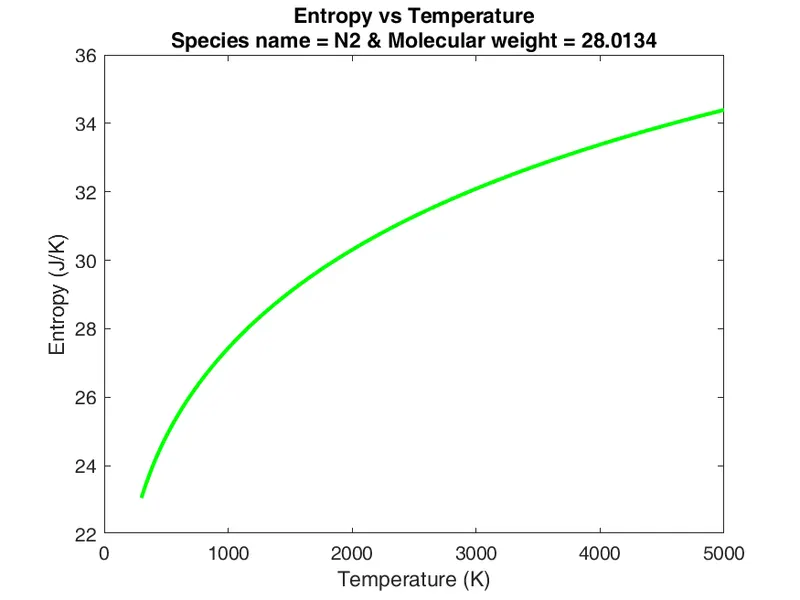
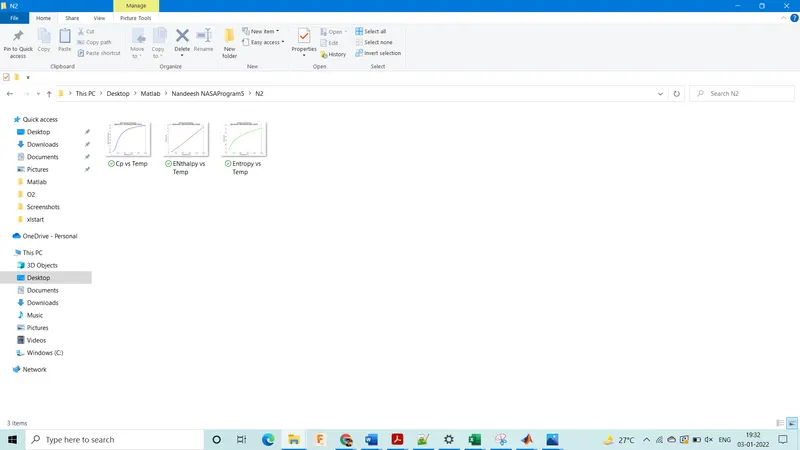
9. Plot Cp vs T, h vs T & s vs T graphs for each species.
Errors:
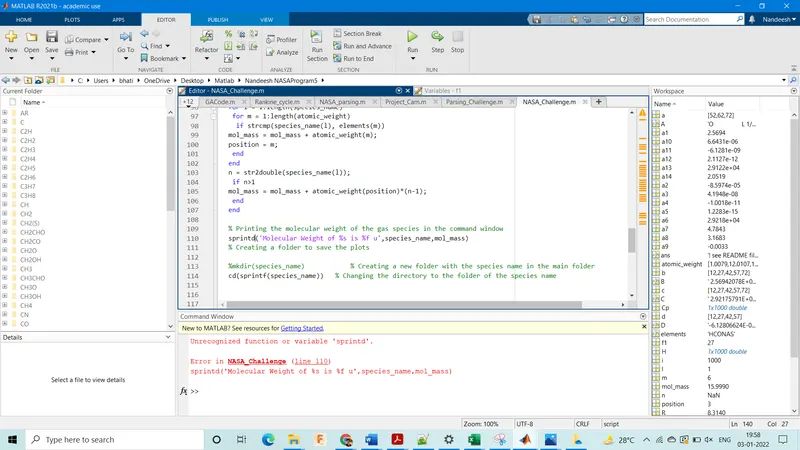
1. Mispelled fprintf as fprintd
ans: corrected it to fprintf
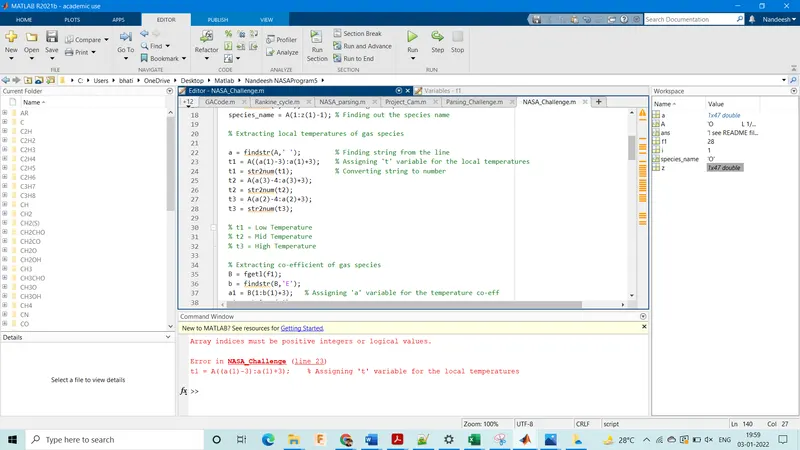
2. Forgot . between single inverted commas while defining a.
ans: corrected it to '.'
clear all
close all
clc

f1 = fopen('thermo.dat','r');	% Opening the file for reading
fgetl(f1);	                    % Reading the comment lines
fgetl(f1);
fgetl(f1);
fgetl(f1);
fgetl(f1);

% Extracting all species data
for i = 1:53
% Extracting name of gas species

A = fgetl(f1);	            % Reading the sixth line
z = findstr(A,' ');	        % Reading the species name
species_name = A(1:z(1)-1);	% Finding out the species name

% Extracting local temperatures of gas species

a = findstr(A,'.');	        % Finding string from the line
t1 = A((a(1)-3):a(1)+3);	% Assigning 't' variable for the local temperatures
t1 = str2num(t1);	        % Converting string to number
t2 = A(a(3)-4:a(3)+3);
t2 = str2num(t2);
t3 = A(a(2)-4:a(2)+3);
t3 = str2num(t3);

% t1 = Low Temperature
% t2 = Mid Temperature
% t3 = High Temperature

% Extracting co-efficient of gas species
B = fgetl(f1);
b = findstr(B,'E');
a1 = B(1:b(1)+3);	% Assigning 'a' variable for the temperature co-eff
a1 = str2num(a1);
a2 = B(b(1)+4:b(2)+3);
a2 = str2num(a2);
a3 = B(b(2)+4:b(3)+3);
a3 = str2num(a3);
a4 = B(b(3)+4:b(4)+3);
a4 = str2num(a4);
a5 = B(b(4)+4:b(5)+3);
a5 = str2num(a5);
C = fgetl(f1);
c = findstr(C,'E');
a6 = C(1:c(1)+3);
a6 = str2num(a6);
a7= C(c(1)+4:c(2)+3);
a7 = str2num(a7);
a8 = C(c(2)+4:c(3)+3);
a8 = str2num(a8);
a9 = C(c(3)+4:c(4)+3);
a9 = str2num(a9);
a10 = C(c(4)+4:c(5)+3);
a10 = str2num(a10);
D = fgetl(f1);
d = findstr(D,'E');
a11 = D(1:d(1)+3);
a11 = str2num(a11);
a12 = D(d(1)+4:d(2)+3);
a12 = str2num(a12);
a13 = D(d(2)+4:d(3)+3);
a13 = str2num(a13);
a14 = D(d(3)+4:d(4)+3);
a14 = str2num(a14);

% First 7 are high temperature co-efficients from a1 to a7
% Second 7 are low temperature co-efficients from a8 to a14

% Creating the range of low and high values of local temperatures
T = linspace(t1,t3,1000);
R = 8.314;	% Universal gas constant in j/mol.k

% Calculation for Specific heat, Enthalpy and Entropy
for i = 1:length(T)
 if T(i)>t2
Cp(i) = (a1 + a2.*T(i) + a3.*T(i).^2 + a4.*T(i).^3 + a5.*T(i).^4)*R;
H(i) = (a1 + (a2.*T(i))/2 + (a3.*T(i)^2)/3 + (a4.*T(i).^3)/4 + (a5.*T(i).^4)/5 + (a6./T(i)))*R.*T(i);
S(i) = a1.*log(T(i)) + a2.*T(i) + (a3.*T(i)^2)/2 + (a4.*T(i)^3)/3 + (a5.*T(i).^4)/4 + a7;
 else
Cp(i) = (a8 + a9.*T(i) + a10.*T(i).^2 + a11.*T(i).^3 + a12*T(i).^4)*R;
H(i) = (a8 + (a9.*T(i))/2 + (a10.*T(i).^2)/3 + (a11.*T(i).^3)/4 + (a12.*T(i).^4)/5 +(a13./T(i)))*R.*T(i);
S(i) = a8.*log(T(i)) + a9.*T(i) + (a10.*T(i)^2)/2 + (a11.*T(i)^3)/3 + (a12.*T(i).^4)/4 + a14;
 end
end

% Molecular weight calculation

elements = ['H','C','O','N','A','S'];	% Declaring species elements
atomic_weight = [1.0079 12.0107 15.999 14.0067 39.948 32.065]; % Declaring the atomic weight value
mol_mass = 0;	% Declaring molecular weight to be '0' in initial stage

for l = 1:length(species_name)
 for m = 1:length(atomic_weight)
  if strcmp(species_name(l), elements(m))
mol_mass = mol_mass + atomic_weight(m);
position = m;
  end
 end
n = str2double(species_name(l));
  if n>1
mol_mass = mol_mass + atomic_weight(position)*(n-1);
  end
end

% Printing the molecular weight of the gas species in the command window
sprintf('Molecular Weight of %s is %f u',species_name,mol_mass)
% Creating a folder to save the plots

mkdir(species_name)	        % Creating a new folder with the species name in the main folder
cd(sprintf(species_name))	% Changing the directory to the folder of the species name


% Plotting specific heat vs temperature


figure(1)
plot (T,Cp, 'color','b','linewidth',2)
xlabel('Temperature (K)')
ylabel('Specific Heat (J/K Kg)')
title({'Specific Heat vs Temperature',['Species name = ',species_name,' & Molecular weight =',num2str(mol_mass)]});
saveas(figure(1),'Cp vs Temp.png')

% Plotting enthalpy vs temperature

figure(2)
plot (T,H, 'color', 'r','linewidth',2)
xlabel('Temperature (K)')
ylabel('Enthalpy (J/K)')
title({'Enthalpy vs Temperature',['Species name = ',species_name,' & Molecular weight = ',num2str(mol_mass)]});
saveas(figure(2),'Enthalpy vs Temp.png')

% Plotting entropy vs temperature

figure(3)
plot (T,S, 'color', 'g','linewidth',2)
xlabel('Temperature (K)')
ylabel('Entropy (J/K)')
title({'Entropy vs Temperature',['Species name = ',species_name,' & Molecular weight = ',num2str(mol_mass)]});
saveas(figure(3),'Entropy vs Temp.png')

% To change the current directory to the main folder

oldfolder=cd('C:\Users\bhati\OneDrive\Desktop\Matlab\Nandeesh NASAProgram5');
end