Otto Cycle
https://drive.google.com/file/d/1b33ICR707RxN-bb-HZRjMFHKdckzLyrO/view?usp=sharing
clear all
close all
clc

%inputs
gamma=1.4;
T3=2300;
%state variables
p1=101325;            %Pressure in N/m^2
T1=500;               %Temperature in Kelvin

%Engine Geometric parameters
bore= 0.1;
stroke=0.1;
con_rod=0.15;
cr=12;

%Calculating swept volume
v_swept=(pi/4)*bore^2*stroke;
v_clearance=v_swept/(cr-1);
v1=v_swept+v_clearance
v2=v_clearance

%state variables at point 2
%p2v2^gamma=p1v1^gamma
%p2=p1*(v1/v2)^gamma=p1*cr^gamma
p2=p1*cr^gamma
T2=T1*(p2/p1)^((gamma-1)/gamma)

constant_c=p1*v1^gamma;
V_compression=engine_kinematics(bore,stroke,con_rod,cr,180,0);
P_compression= constant_c./V_compression.^gamma;

%state variables at point 3
%asssume T3=2000K
p3=p2*T3/T2
v3=v2;

%state variables at state 4
v4=v1;
p4=p3*(v3/v4)^(gamma)
T4=T3*(p4/p3)^((gamma-1)/gamma)
constant_c=p3*v3^gamma;
V_expansion=engine_kinematics(bore,stroke,con_rod,cr,0,180);
P_expansion=constant_c./V_expansion.^gamma;

%thermal Efficiency
thermal_efficiency=1-1/(cr)^(gamma-1)

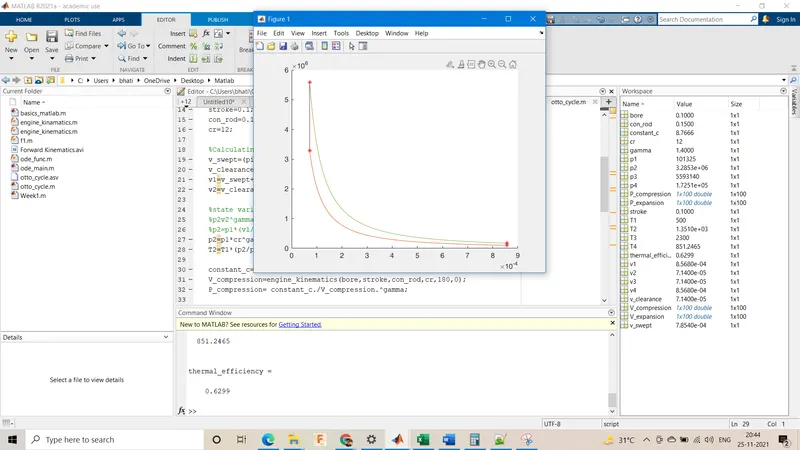
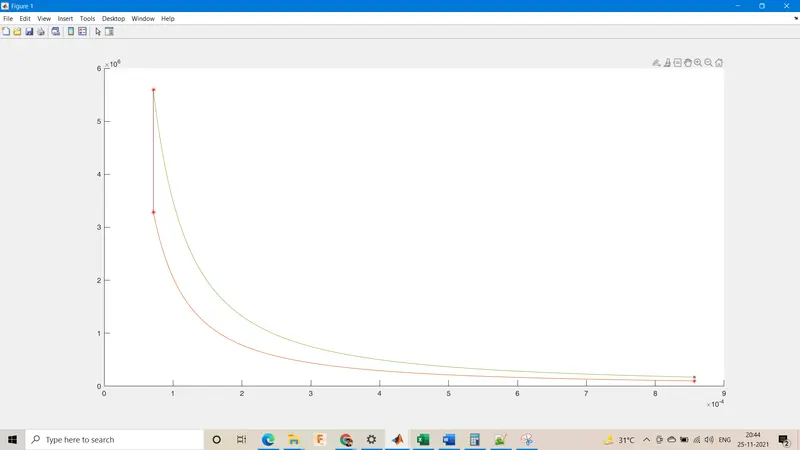
figure(1)
hold on
plot(v1,p1,'*','color','r')
plot(V_compression,P_compression)
plot(v2,p2,'*','color','r')
plot(v3,p3,'*','color','r')
plot(V_expansion,P_expansion)
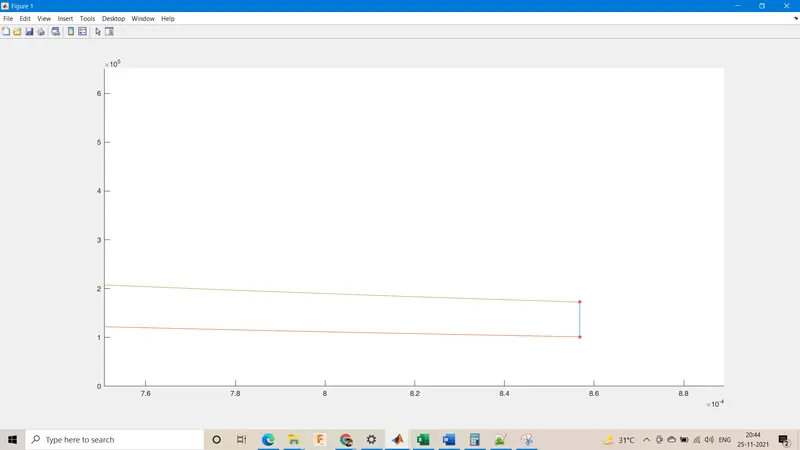
plot(v4,p4,'*','color','r')
plot([v2 v3],[p2 p3])
plot([v4 v1],[p4 p1])


%code for function

function [V]=engine_kinematics(bore,stroke,con_rod,cr,start_crank,end_crank)

a=stroke/2;
R=con_rod/a;

v_s=pi/4*bore^2*stroke;
v_c=v_s/(cr-1);

theta=linspace(start_crank,end_crank,100);

term1=0.5*(cr-1);
term2=R+1-cosd(theta);
term3=(R^2-sind(theta).^2).^0.5;

V=(1+term1*(term2-term3)).*v_c;

end
Report:
1. Created input & engine parameters as constants.
2.Calculated v_sweep, v clearance,v1 & v2 using standard foemulae.
3. Calculated the pressure, volume & temperature at each state using inputs, relations for isentropic & isochoric processes & considering T3=2300.
4. Wrote formula for thermal efficiency of otto cycle in terms of compression ratio(cr).
5. Wrote a function engine_kinematics, by creating an array theta using linspace command & using this array to calculate the volume array along with a formula derived from geometric relations.
6. Used the function in the main program to calculate V_compression & V_expansion in the main program.
7. Used the realtion PV^gamma=Constant of isentropic process for creating an array of P_compression & P_expansion respectively.
8. Used the plot & hold on command to plot the graph for Pressure & Volume arrays.
Errors
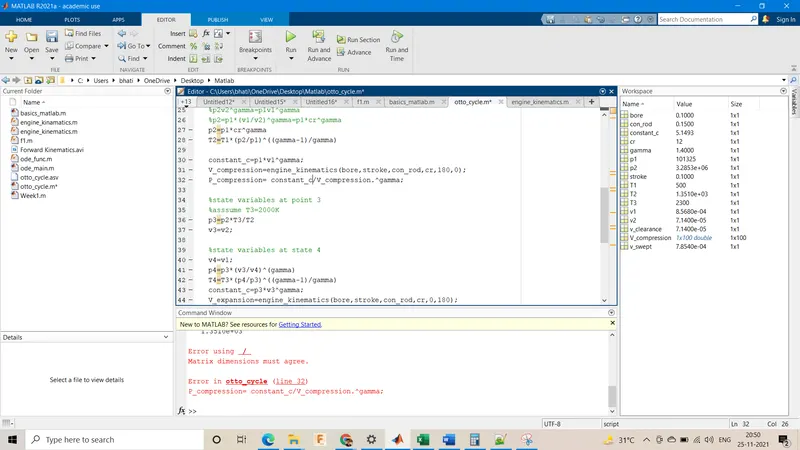
1. Forgot to use the element wise './' operator in the program.
1ans: Rectified it after looking at the error message.
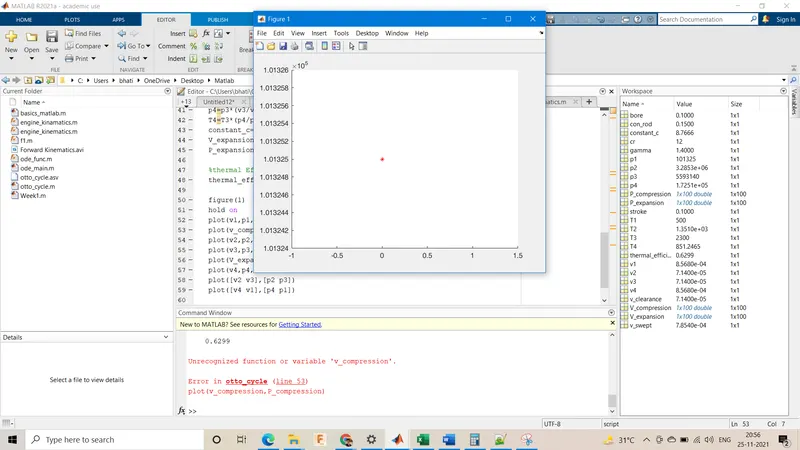
2. Used v_compression instead of V_compression in one of the plot commands.
2ans: Rectified after looking up the error line & realizing the typo.