Project 1 - Parsing NASA thermodynamic data
FILE PARSING OF NASA THERMODYNAMIC DATA & DETERMINATION OF PROPERTIES
OBJECTIVE:
To write a MATLAB code to determine the properties like specific heat, enthalpy, entropy at various temperatures for various gases along with molecular weight of various gases by reading the file provided as input.
Input file explanation:
NASA has determined the polynomials to express the properties of the gases of various species to understand them better. The input file given for this project is one part of such file which contains the 14 coefficients values, temp limits of observation (min, limit, max) for various gases. In the 14 coefficients first 7 coefficients are used for high temperature properties calculation & remaining 7 coefficients are used for low temperature properties calculation. High temperature is the temperature range from limit temperature to maximum temperature & similarly lower temperature is the temperature range from minimum temperature to limit temperature.
Properties Calculation:
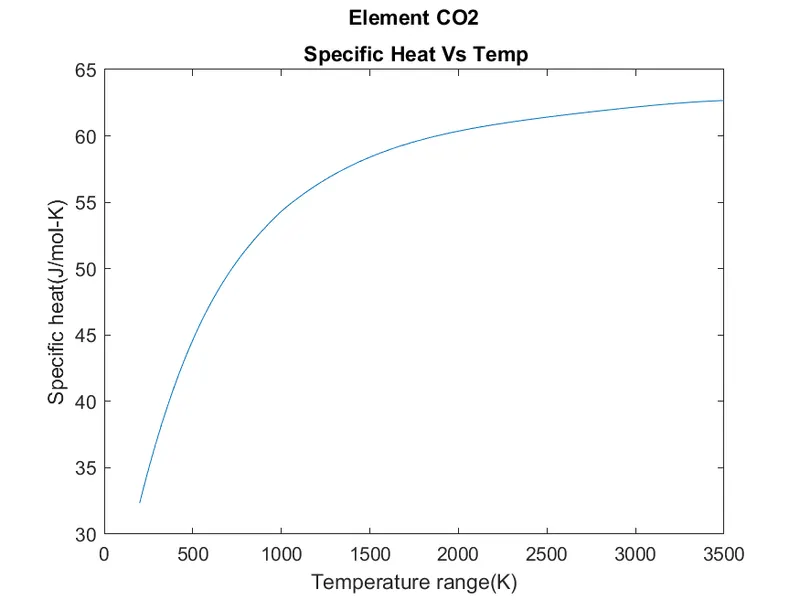
Specific heat : Quantity of heat required to raise the temperature of one gram of the substance by one celsius degree or one kelvin. Denoted by Cp.
Enthalpy : Sum of the internal energy & the product of its pressure and volume.Denoted by H
Entropy: measure of a system's thermal energy per unit temperature that is unavailable for doing useful work.Denoted by S.
The properties of Specific heat, Enthalpy, Entropy for various gases are calculated based on the below formulas for whole temperature range for each gas
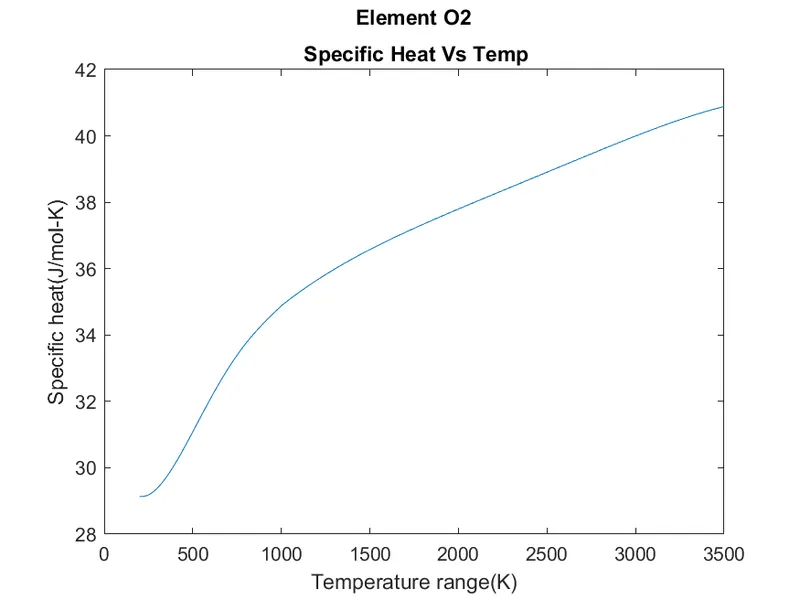
Specific heat =R*(a1+a2*T+a3*(T^2)+a4*(T^3)+a5*(T^4))
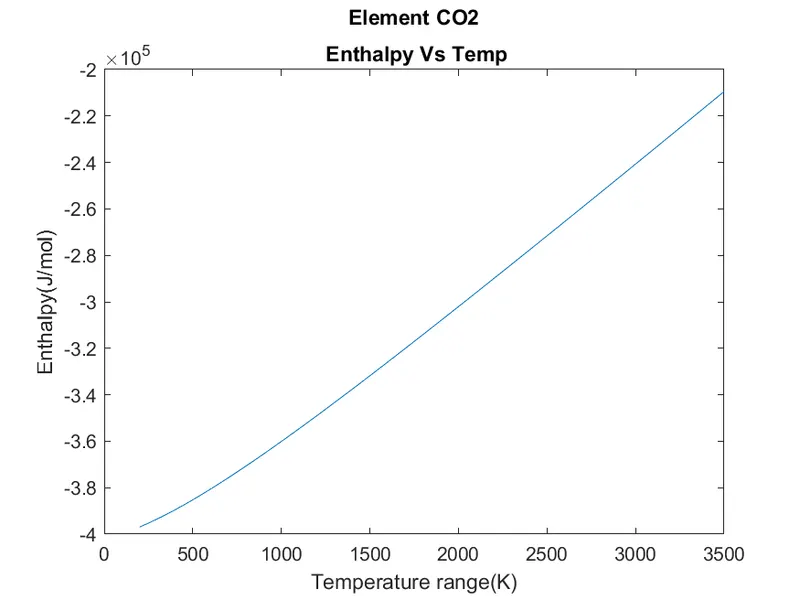
Enthalpy =R*T*(a1+a2*(T/2)+a3*(T^2/3)+a4*(T^3/4)+a5*(T^4/5)+a6/T)
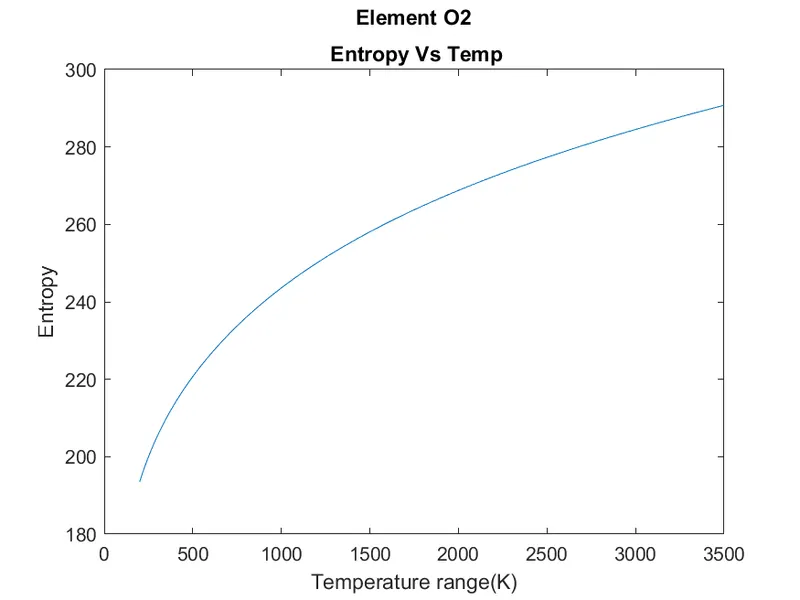
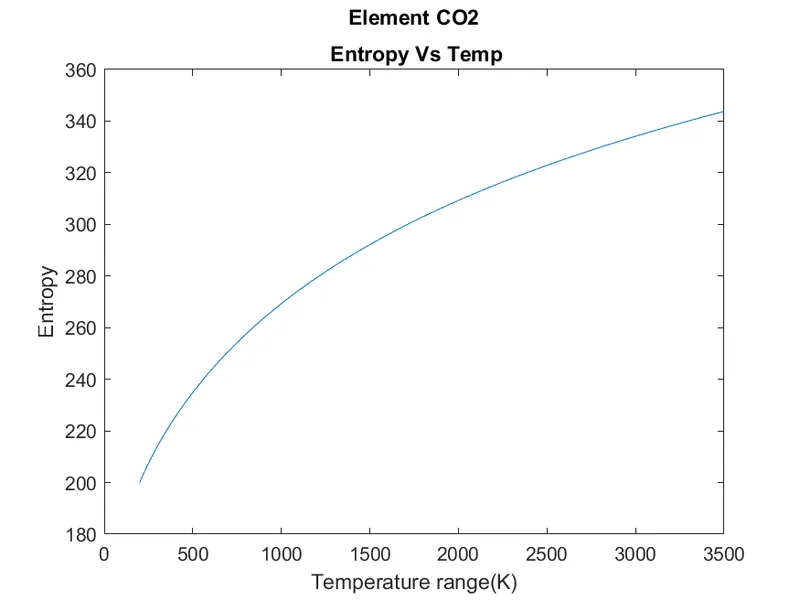
Entropy =R*(a1*log(T)+a2*T+a3*(T^2/2)+a4*(T^3/3)+a5*(T^4/4)+a7)
Where,
R: Universal gas constant (8.314 J/K-mol)
a1 to a7: coefficients of the polynomial (Values from the input file)
T: Temperature (Values from the input file)
Molecular weight for each of the gas is calculated based on the chemical composition of each gas
Eg: CH2O -> C:1 / H:2 / O:1
Molecular weight= (1* 12.0116 + 2* 1.00811 +1* 15.99977) =30.0276 g/mol
SOLUTION PROCEDURE
- User is requested to enter the filename along with the extension as input
- File is read line by line with the help of the fgetl function until the END
- Each new gas starts with the ‘1’ at the end of the line. From that line we take the name of the gas, minimum temperature, maximum temperature, limit temperature for that respective gas
- Similarly High temperature coefficients of a1,a2,a3,a4,a5 is read the line which is ending with ‘2’ & High temperature coefficients of a6,a7 & low temperature coefficients a1,a2,a3 is read the line which is ending with ‘3’ & low temperature coefficients of a4,a5,a6,a7 is read the line which is ending with ‘4’.
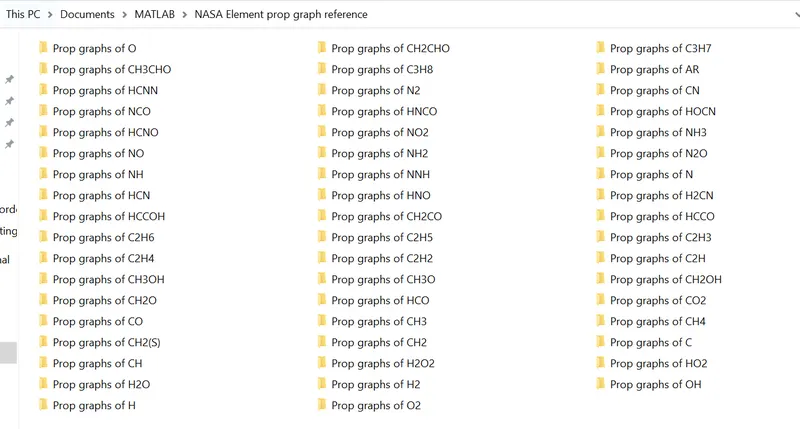
- New folder is created in the name of “NASA Element prop graph reference” with the help of mkdir function & cd function is used to change the current working directory to this folder to store the property graphs of gases.
- Specific heat function is called where the specific heat, enthalpy, entropy for all the gases with the help of the for loop.
- Specific heat function:
- Calculation for the specific heat, enthalpy & entropy for the temperature range is done based on the above-mentioned formulas
- New folder is created for storing the graphs explaining the properties of the gas with respect to the temperature.
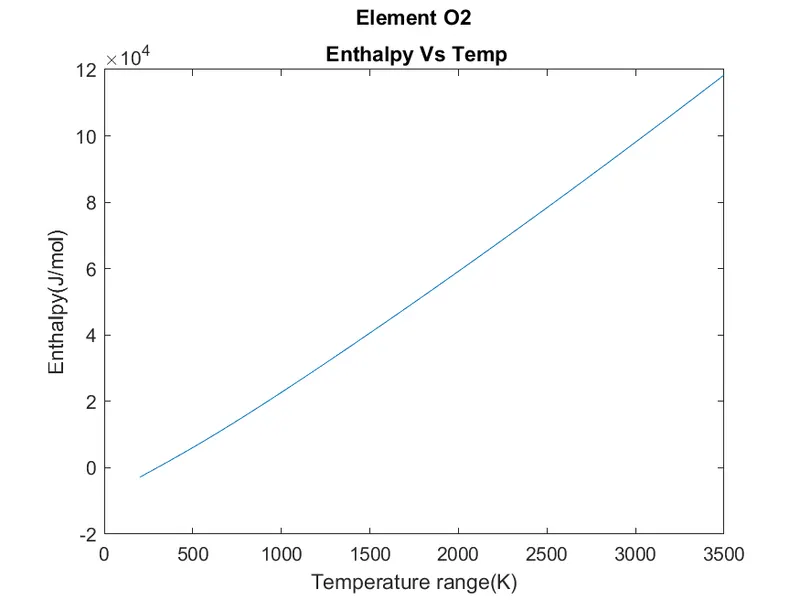
- Plots are created for Specific heat, enthalpy & entropy separately & saved in this folder for every gas
- Specific heat function:
- Molecular weight of the gases are calculated with the help of the molecular weight function
- Molecular weight function:
- Element name & weight are entered are provided.
- Each character of the gas chemical composition is send to the loop which is compared to the element name array.
- Once the match is found, the corresponding weight is added to the molecular weight variable
- If there is a number n detected in the gas chemical composition, then the molecular weight is added with (previous element weight*n-1)
- Function returns the molecular weight for all the gases in the input file
- Molecular weight function:
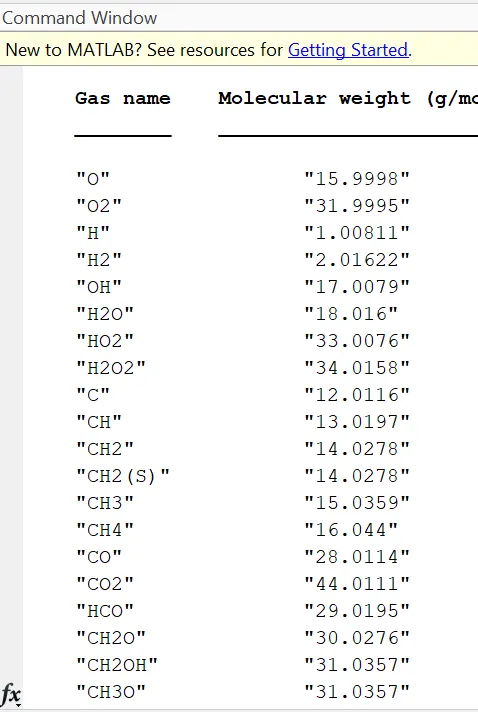
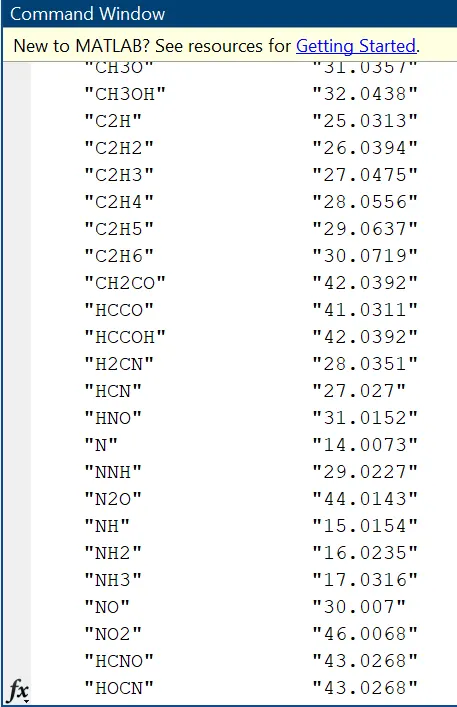
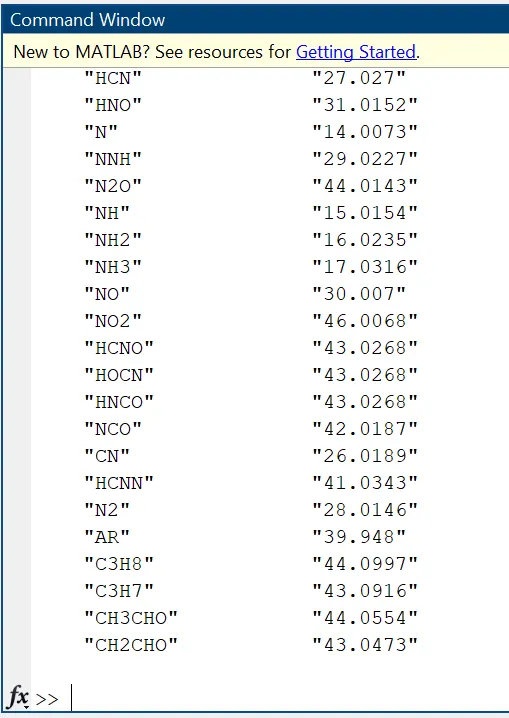
- Molecular weight is tabulated along with the name of the each element with the help of the array2table function.
CODE REFERENCE:
MAIN PROGRAM :
clear all
close all
clc

%Getting filename input from the user
promp="Enter the file name with the extension:"
x=input(promp,"s")
f1=fopen(x,'r')
%Reading the contents of the file
tline=fgetl(f1);
i=0;
while(~contains(tline,'END'))
    tline=fgetl(f1);
    C=strsplit(tline);
    check=str2double(C(end));
    if check==1
        i=i+1;
        %Reading the name of the gas, min ,limit,max temperature
        name(i)=string(C(1));
        min_temp(i)=str2double(C(end-3));
        max_temp(i)=str2double(C(end-2));
        limit_temp(i)=str2double(C(end-1));
    %Reading the coefficients of the high & low temperature changes
    elseif check==2
        a_h(i,1)=str2double(tline(1:15));
        a_h(i,2)=str2double(tline(16:30));
        a_h(i,3)=str2double(tline(31:45));
        a_h(i,4)=str2double(tline(46:60));
        a_h(i,5)=str2double(tline(61:75));
    elseif check==3
        a_h(i,6)=str2double(tline(1:15));
        a_h(i,7)=str2double(tline(16:30));
        a_l(i,1)=str2double(tline(31:45));
        a_l(i,2)=str2double(tline(46:60));
        a_l(i,3)=str2double(tline(61:75));
    elseif check==4
        a_l(i,4)=str2double(tline(1:15));
        a_l(i,5)=str2double(tline(16:30));
        a_l(i,6)=str2double(tline(31:45));
        a_l(i,7)=str2double(tline(46:60));
    end
end
fclose(f1)
%Unoversal gas constant
R=8.3144626;
%Creation of a new folder to store the properties graph of each gas
old=pwd
mkdir("NASA Element prop graph reference")
cd("NASA Element prop graph reference")
current_dir=pwd
for i = 1:length(name)
    Temp_range=linspace(min_temp(i),max_temp(i),250);
    li_temp=limit_temp(i);
    [Cp_temp,H_temp,S_temp]=specific_heat(a_l,a_h,R,Temp_range,li_temp,i,name(i),current_dir);
    for j=1:length(Temp_range)
        Cp(i,j)=Cp_temp(j);
        H(i,j)=H_temp(j);
        S(i,j)=S_temp(j);
    end
end
cd(old)
%Molecular weight calculation & showing that in the table
[molecular_wts]=molecular_weight(name);
molecular_wts=molecular_wts';
name=name';
T=array2table([name,molecular_wts],'VariableNames',{'Gas name','Molecular weight (g/mol)'})
Filename is inputted by the user as shown in below image

SPECIFC HEAT FUNCTION:
function [Cp,H,S]=specific_heat(a_l,a_h,R,Temp,lim_temp,pos,ele,cur_dir)
    for i =1:length(Temp)
        T=Temp(i);
        if (T<=lim_temp)
            a1=a_l(pos,1);
            a2=a_l(pos,2);
            a3=a_l(pos,3);
            a4=a_l(pos,4);
            a5=a_l(pos,5);
            a6=a_l(pos,6);
            a7=a_l(pos,7);
            Cp(i)=R*(a1+a2*T+a3*(T^2)+a4*(T^3)+a5*(T^4));
            H(i)=R*T*(a1+a2*(T/2)+a3*(T^2/3)+a4*(T^3/4)+a5*(T^4/5)+a6/T);
            S(i)=R*(a1*log(T)+a2*T+a3*(T^2/2)+a4*(T^3/3)+a5*(T^4/4)+a7);
        else
            a1=a_h(pos,1);
            a2=a_h(pos,2);
            a3=a_h(pos,3);
            a4=a_h(pos,4);
            a5=a_h(pos,5);
            a6=a_h(pos,6);
            a7=a_h(pos,7);
            Cp(i)=R*(a1+a2*T+a3*(T^2)+a4*(T^3)+a5*(T^4));
            H(i)=R*T*(a1+a2*(T/2)+a3*(T^2/3)+a4*(T^3/4)+a5*(T^4/5)+a6/T);
            S(i)=R*(a1*log(T)+a2*T+a3*(T^2/2)+a4*(T^3/3)+a5*(T^4/4)+a7);
        end
    end
    %New folder creation specific to each gas for storing the plots
    fol_name=sprintf("Prop graphs of %s",ele);
    mkdir(fol_name);
    cd(fol_name);
    pwd;
    %Plotting Specific heat with temperature
    plot(Temp,Cp);
    ylabel('Specific heat(J/mol-K)');
    xlabel('Temperature range(K)');
    tit_text=sprintf('Element_ %s\n Specific Heat Vs Temp',ele);
    title(tit_text);
    img_name=sprintf('%s_Specific Heat Vs Temp',ele);
    file_name=strcat(img_name,'.png');
    saveas(gcf,file_name);
    %Plotting Enthalpy with temperature
    plot(Temp,H);
    ylabel('Enthalpy(J/mol)')
    xlabel('Temperature range(K)')
    tit_text=sprintf('Element_ %s\n Enthalpy Vs Temp',ele);
    title(tit_text)
    img_name=sprintf('%s_Enthalpy Vs Temp',ele);
    file_name=strcat(img_name,'.png');
    saveas(gcf,file_name);
    %Plotting Entropy with temperature
    plot(Temp,S);
    ylabel('Entropy');
    xlabel('Temperature range(K)');
    tit_text=sprintf('Element_ %s\n Entropy Vs Temp',ele);
    title(tit_text);
    img_name=sprintf('%s_Entropy Vs Temp',ele);
    file_name=strcat(img_name,'.png');
    saveas(gcf,file_name);
    cd(cur_dir);
MOLECULAR WEIGHT FUNCTION:
function [molecular_weight]=molecular_weight(name)
    ele_name={'O','C','H','N','A'};
    ele_wt=[15.99977,12.0116,1.00811,14.00728,39.948];
    for K=1:length(name)
        mol_wt=0;
        len=strlength(name(K));
        for i =1:len
            for x=1:length(ele_name)
                char=extract(name(K),i);
                temp=str2double(regexpi(char,'[\d.]+','match'));
                check=~isempty(temp);
                if strcmp(char,ele_name(x))
                    wt=ele_wt(x);
                    mol_wt=mol_wt+wt;
                    break
                elseif check
                    add=((str2double(char))*wt)-(wt);
                    mol_wt=mol_wt+add;
                    break
                end
            end
        end
        molecular_weight(K)=mol_wt;
    end
RESULTS:
- Molecular weight displayed in the command window
- Plots of O2:
- Plots of CO2:
- Plots of N2:
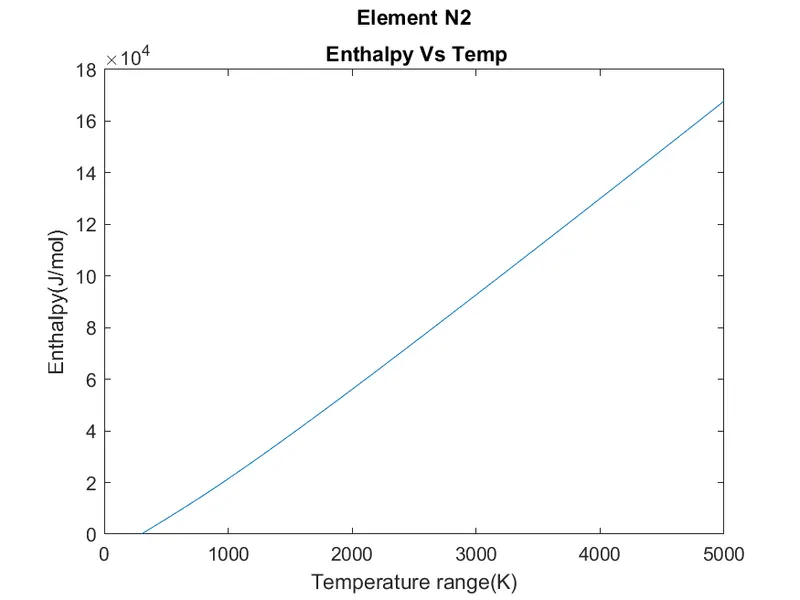
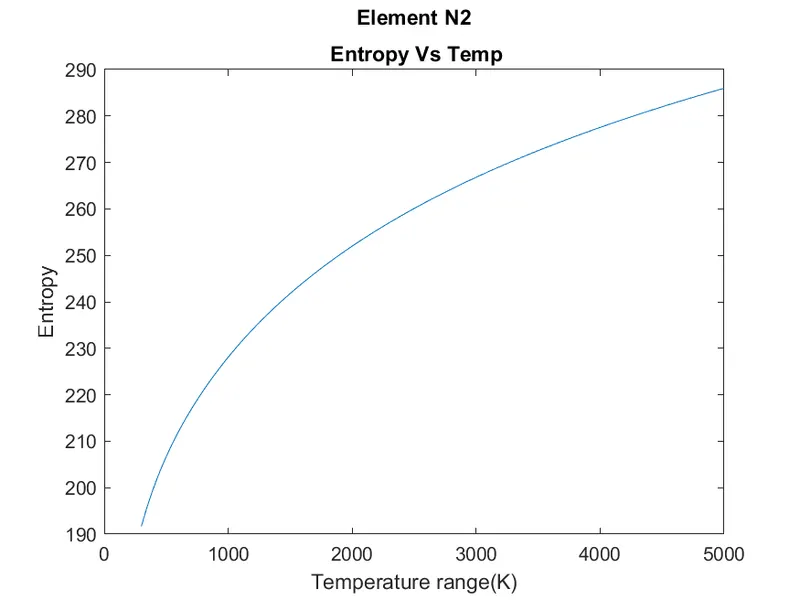
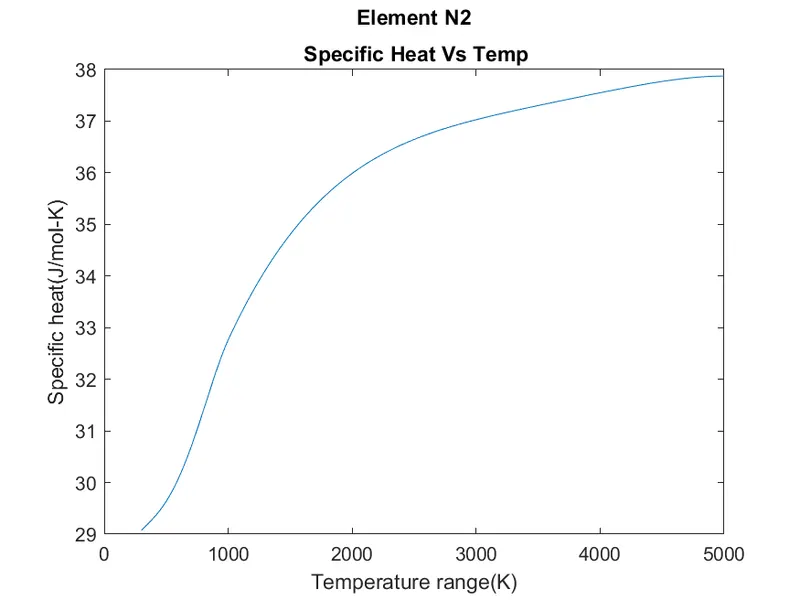
- Screenshot of the folders created
REFERENCES
https://ch.mathworks.com/help/matlab/file-operations.html?s_tid=CRUX_lftnav