Project 1 - Parsing NASA thermodynamic data
Project : Nasa's File Parsing
File parsing :
In general , the file parsing means the exreacting the usefull or important value from file. MATLAB , is one of the tool used for parsing the files data .
In MATLAB , this reads the data file and using various commands we can easily extract the data we required .
Objectives : To write the code in MATLAB for parsing the NASA's data file for extracting 14 coefficient and compairing the them with thermodynamics properties like Specific Heat , Enthalpy and Entropy with the Tempereture .
To calculate the Molecular Weight of each species and ploting the graph for each species for Specific Heat , Enthalpy , Entropy .
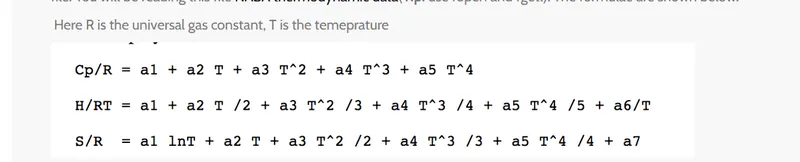
Formule used are as follows :
1. Program code for Extracting 14 coefficient from data file :
% Data file getting

f1 =fopen('THERMO.dat','r')
fgetl(f1);

% Reading the header information
tline=fgetl(f1);                 % getting the 1st line of file f1
A = strsplit(tline,' ');      % spliting array of string into in single value of string
Global_low_temp = str2num(A{2}); %  converting string value into number
global_mid_temp = str2num(A{3});  % and getting the Global temperature range
Global_high_temp= str2num(A{4});

for i=1:3            % Skipping  the next three lines using for loop
    fgetl(f1);

end

% Reading the species
 for  i = 1:53                    % for loop for reading the values for species
     header = fgetl(f1);          % 1st line of file got as header
    x = strsplit(header,' ');     % spliting the hear line in string single value
    species_name = (x{1});        % reading the species name
    z = length(x);

   local_low_temperature = str2num(x{z-3});
   local_mid_tempearature = str2num(x{z-2}); %acquiring the local low temperature range
   local_high_temperature = str2num(x{z-1});

% Getting the 1st line coefficient
line_1 =fgetl(f1);              % getting next line of file f1 and extracting the
a = strfind(line_1,'E');        % coefficient
a1 = str2num(line_1(1:a(1)+3));
a2 = str2num(line_1(a(1)+4:a(2)+3));
a3 = str2num(line_1(a(2)+4:a(3)+3));
a4 = str2num(line_1(a(3)+4:a(4)+3));
a5 = str2num(line_1(a(4)+4:a(5)+3));

% Getting the 2nd line coefficient
line_2 =fgetl(f1);

b = strfind(line_2,'E');
a6 =str2num(line_2(1:b(1)+3));
a7 = str2num(line_2(b(1)+4:b(2)+3));
a8 = str2num(line_2(b(2)+4:b(3)+3));
a9 = str2num(line_2(b(3)+4:b(4)+3));
a10 = str2num(line_2(b(4)+4:b(5)+3));

% Getting the 3rd line coefficient
line_3 =fgetl(f1);

c=strfind(line_3,'E');
a11 = str2num(line_3(1:c(1)+3));
a12 = str2num(line_3(c(1)+4:c(2)+3));
a13 = str2num(line_3(c(2)+4:c(3)+3));
a14 = str2num(line_3(c(3)+4:c(4)+3));


T = linspace(local_low_temperature,local_high_temperature,1000);

% Givan R is the universal  gas constant
  R = 8.314;

% for obtaining the array of Specific heat, enthalpy and entropy ,for

for  k =1:length(T)  % compairing the species temperature and assighning the coefficient

 % a1 - a7 = Coefficient of high temperature,  % a8 - a14 =low tempereaturecoefficient


 if T(k)> local_mid_tempearature

% high temperature coefficient
 cp = (a1+a2.*T+a3.*T.^2+a4.*T.^3+a5.*T.^4)*R;
 H = (a1+a2.*T/2+(a3.*T.^2)/3+(a4.*T.^3)/4+(a5.*T.^4)/5+a6./T)*R*T;
 S = (a1.*log(T)+a2.*T+(a3.*T.^2)/2+(a4.*T^3)/3+a5.*T.^4/4+a7)*R;

 else
% Low temperature coefficient
cp = (a8+a2.*T+a9.*T.^2+a10.*T.^3+a11.*T.^4)*R;
 H = ((a8+a9.*T)/2+(a10.*T.^2)/3+(a11.*T.^3)/4+(a12.*T.^4)/5+a13./T)*R.*T;
 S = (a8.*log(T)+a9.*T+(a10.*T.^2)/2+(a11.*T.^3)/3+(a12.*T.^4)/4+a14)*R;
 end
end
% Making the directories for files to dumb there

mkdir('C:\Users\ganesh\Desktop\matlab assighnment\nasa_file_parsing\species',species_name)

% Ploting the plots for every species
figure(1)
plot(T,cp,'linewidth',3,'Color','r')
title('specific heat Vs. temperature',species_name);
xlabel('temperature');
ylabel('Specific Heat cp');

figure(2)
plot(T,H,'linewidth',3,'Color','b')
title('Enthalpy Vs. temperature',species_name);
xlabel('temperature');
ylabel('Ethalpy');

figure(3)
plot(T,S,'linewidth',3,'Color','y')
title('Enthalpy Vs. temperature',species_name);
xlabel('temperature');
ylabel('Entropy');

% Changing the directories

program=(['C:\Users\ganesh\Desktop\matlab assighnment\nasa_file_parsing\species\',species_name]);
cd(program)

saveas(1,'specific heat.jpg')
saveas(2,'Enthalpy.jpg')
saveas(3,'Entropy.jpg')
cd('C:\Users\ganesh\Desktop\matlab assighnment\nasa_file_parsing')
Molecular_Weight_Calculation = Molecular_weight(species_name)
 end
fclose(f1);    % closing the f1 file
Steps for main program:
1. Firstly the data is imported with using the command : f1=fopen('THERMO.dat','r'); and assighned as f1 . fgetl command isused to get name .
2. Again fgetl command is used to get next line and using the strsplit(tline,' ') splited the first line , then command str2num is used to convert string to number and w egot our global temperature range .
3.Then for loop used to eliminate next three line which are not required .
4. Then for loop created for getting the all 14 coefficient and the local temperature range , strfine command is used to specify them accuratly. and then used str2num command again to convert strings to number .
5. Using the for loop we got the Temperature array , to campaire the value of specific heat, enthalpy and the entropy, then values of Specific heat , Enthalpy and the Entropy calculated using given formula .
6. While Calculating the values of cp,H and s , there was an error can be seen below attached image name 2 nasa, Just using the elmentwise ' .* error got currected .
7. Another error can be seen in below attached image name 2 nasa , in which value of R was not provided , this error corrected by providing the value of R.
6. Then Directory is made to store the data and the plots created using the command : mkdir .
7. Plot command used to make plots of eacch species .
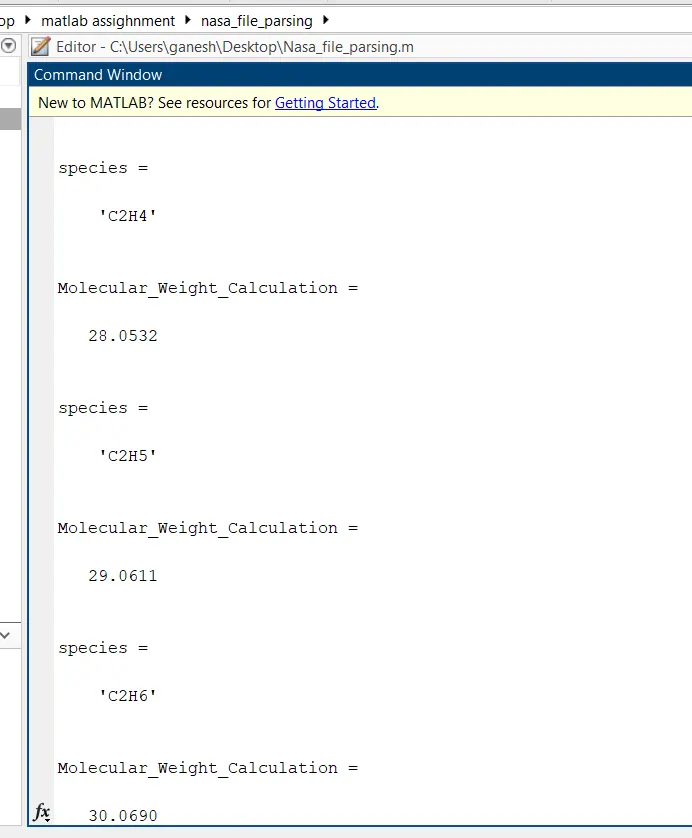
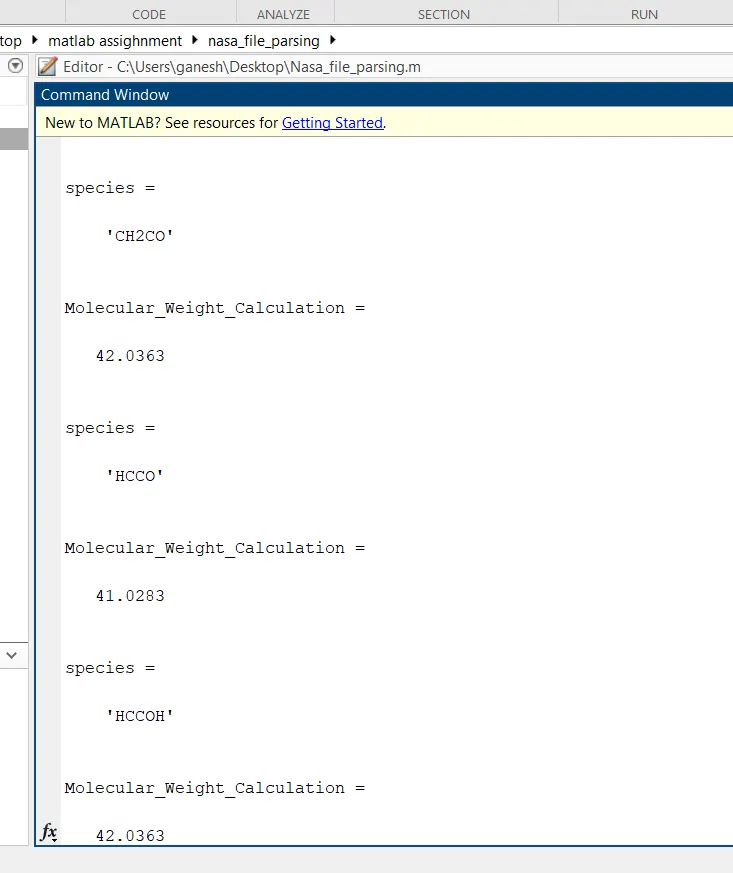
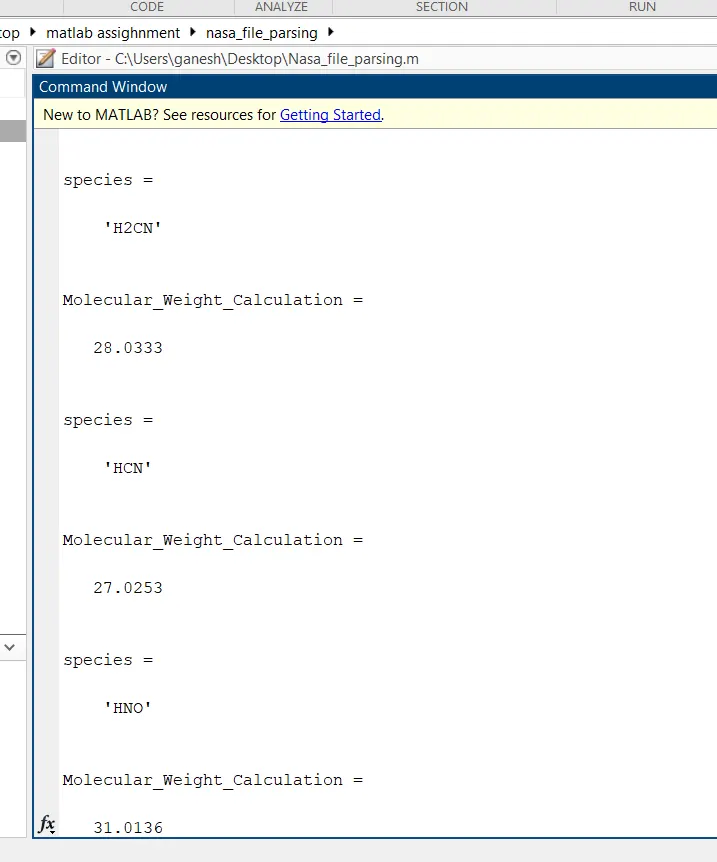
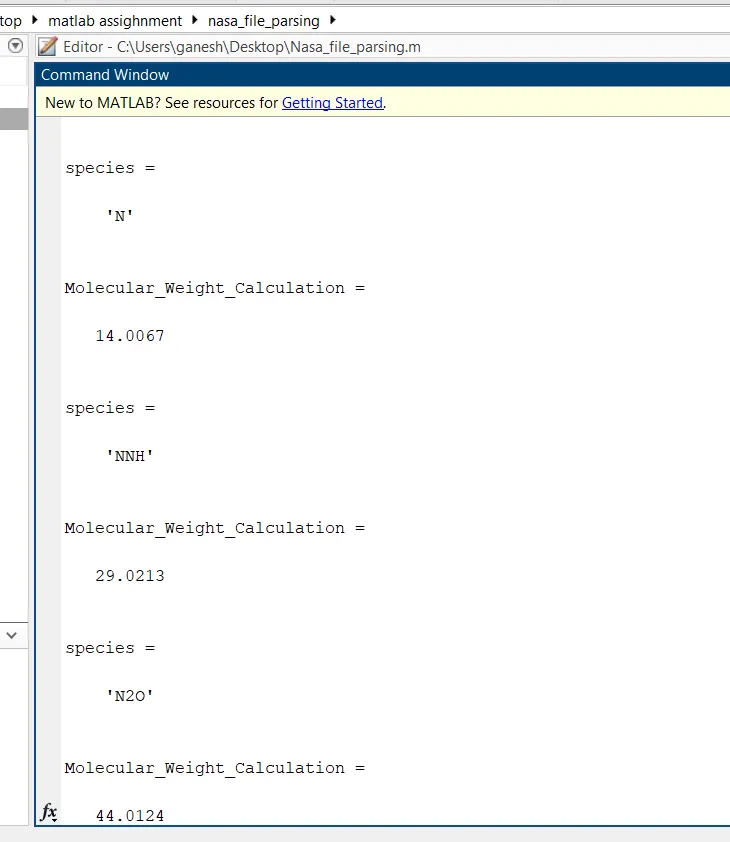
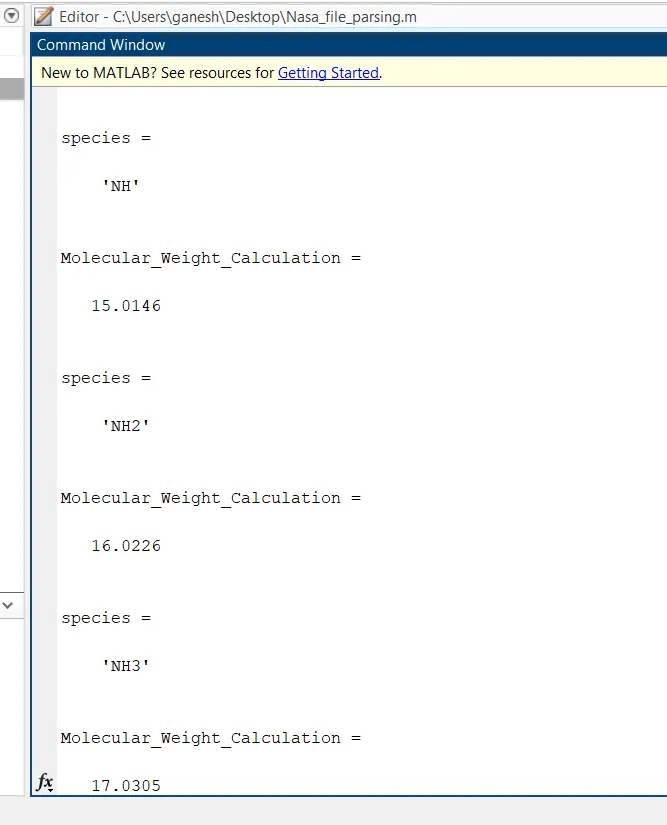
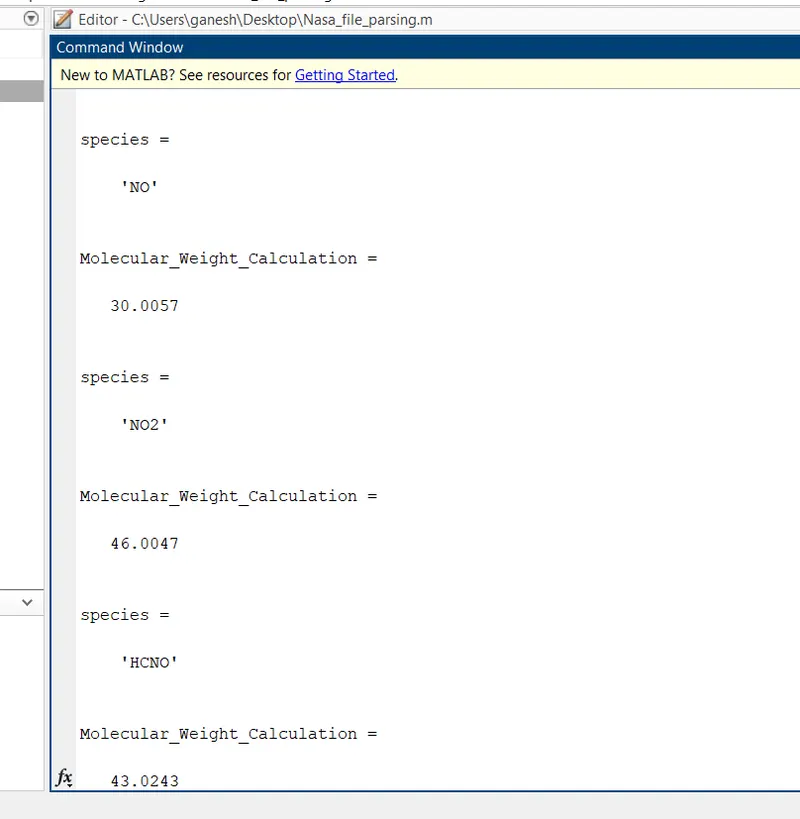
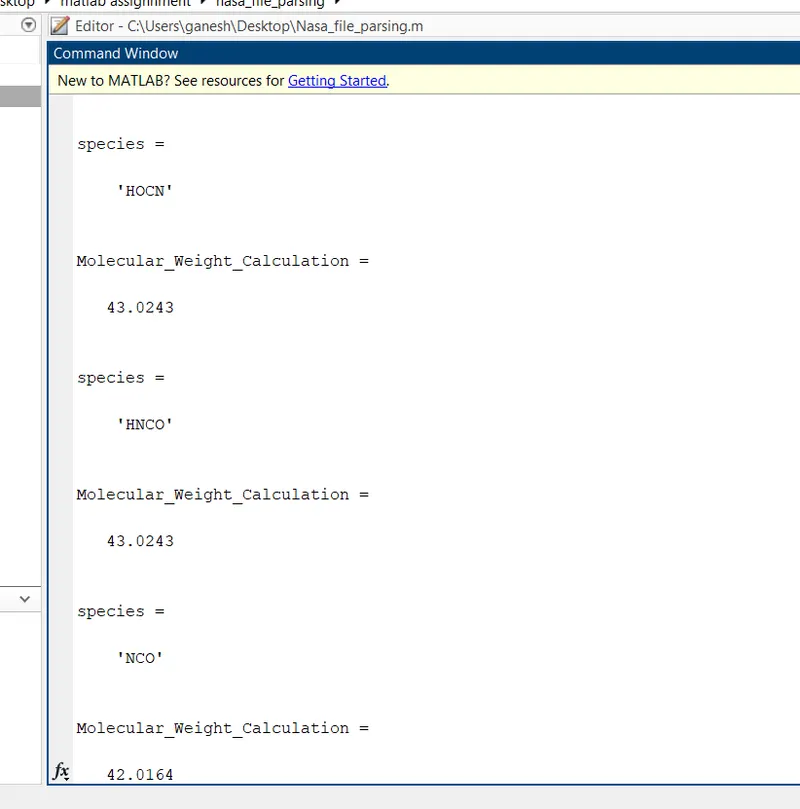
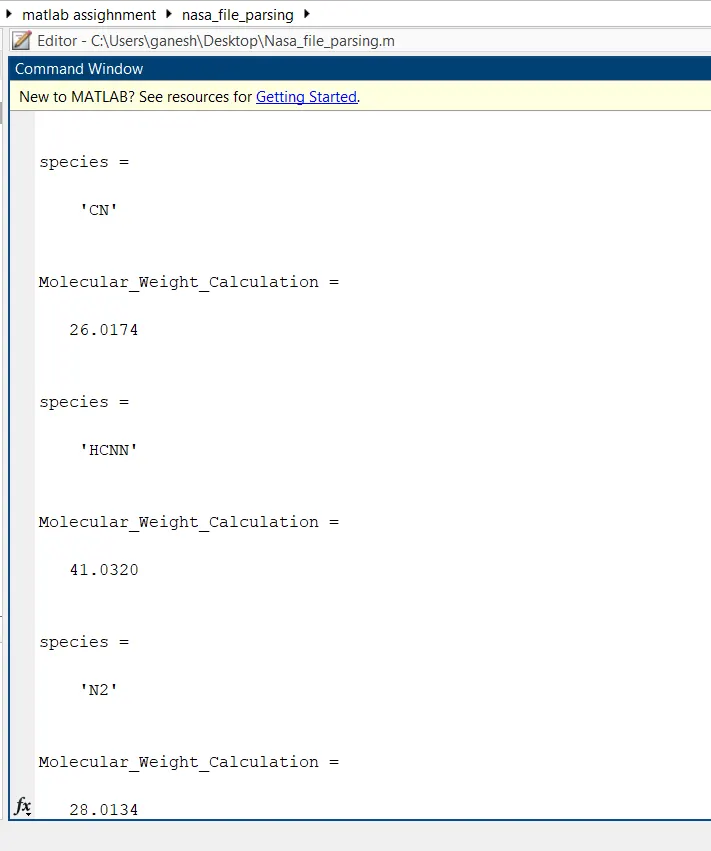
8. Program for calculating the molecular weight is shown below and For calculating the molecular weight of species function command is created , in which species name , and the atomic weight is given as input .
9. For loop is created for calculating the molecular weight of species individually , strcmp is used to compaire species name with the element and str2num command is used to convert string to number .
10. At time of executing the code there was an error which can be seen below attached image name 4 nasa , which was corrected by creting the another directory path
2. Program code for molecular weight calculation :
% Calculating the Molecular Weight
function Molecular_Weight_Calculation = Molecular_weight(species_name)
species = (species_name)
Element = [ 'O','H','C','N','A','S' ];
Atomic_Weight = [15.999 1.00794 12.0107 14.0067 39.948 32.065];
Molecular_Weight_Calculation=0;
for i =1:length(species)
    for j=1:length(Element)
        if strcmp(species(i),Element(j))
            Molecular_Weight_Calculation=Molecular_Weight_Calculation+Atomic_Weight(j);
            a=j;
        end
    end
    n=str2num(species(i));
    if n>1
      Molecular_Weight_Calculation=Molecular_Weight_Calculation+Atomic_Weight(a)*(n-1);
    end
end
# OUTPUTS :
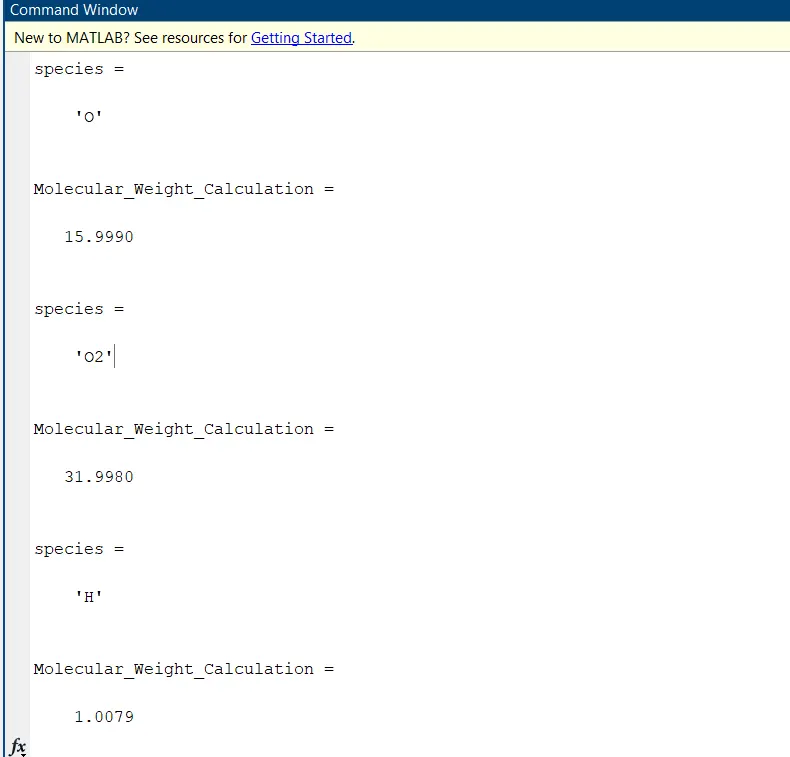
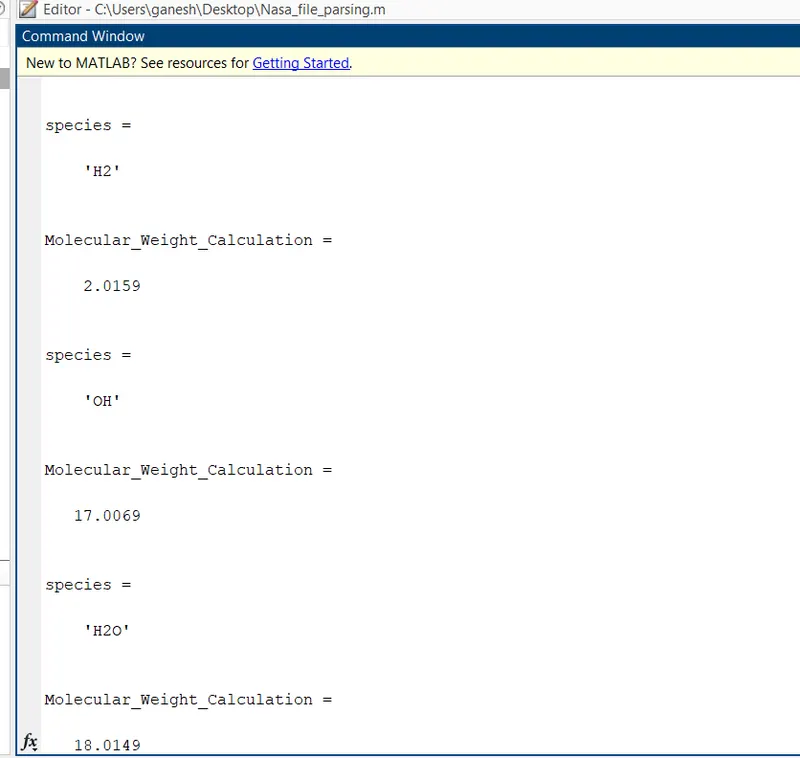
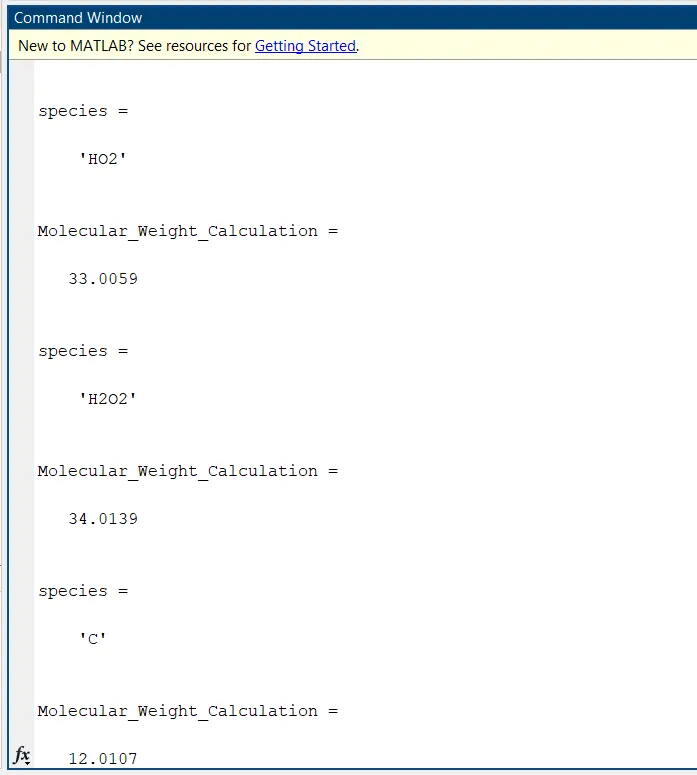
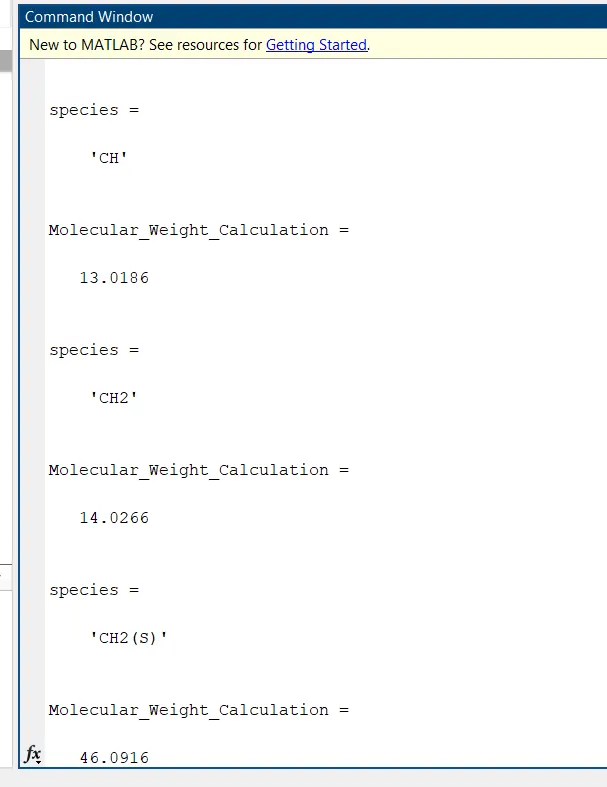
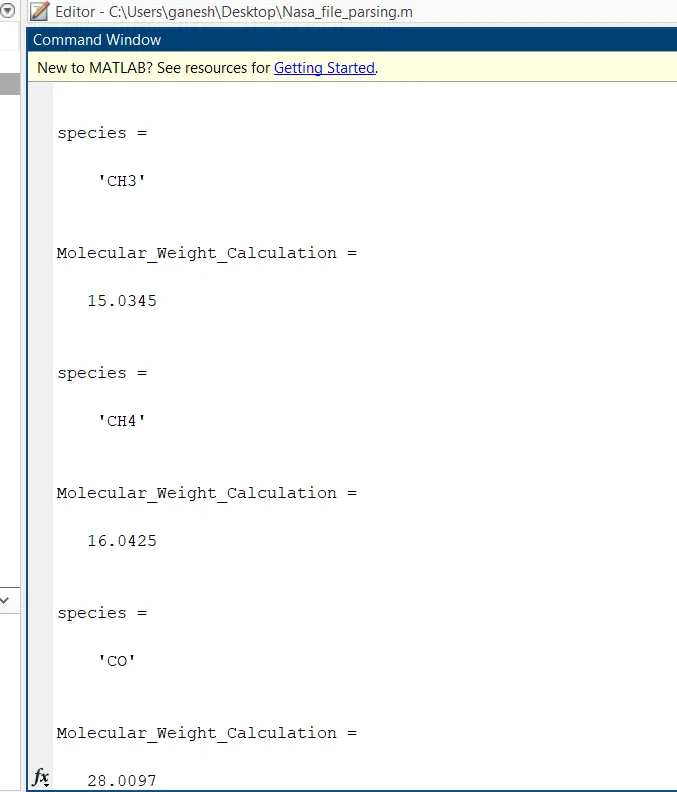
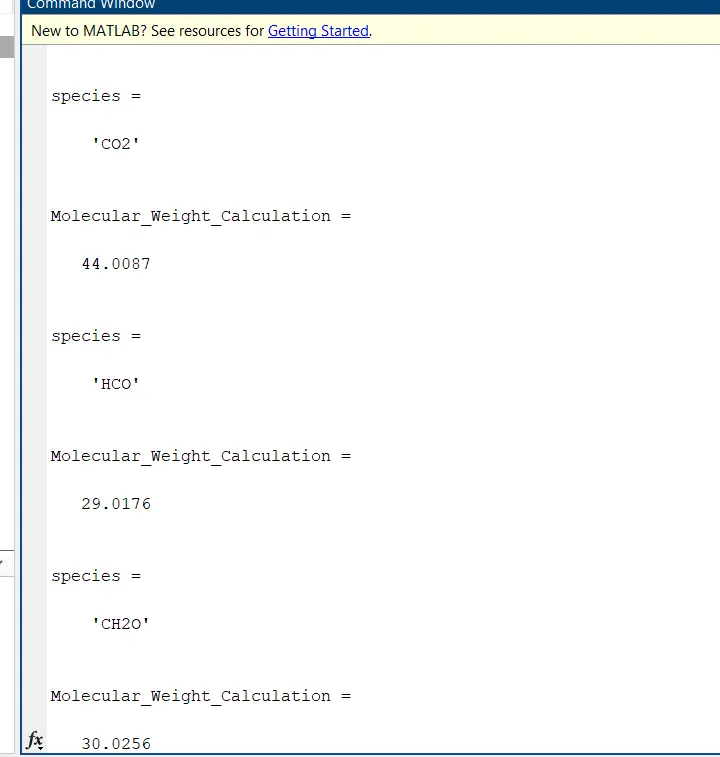
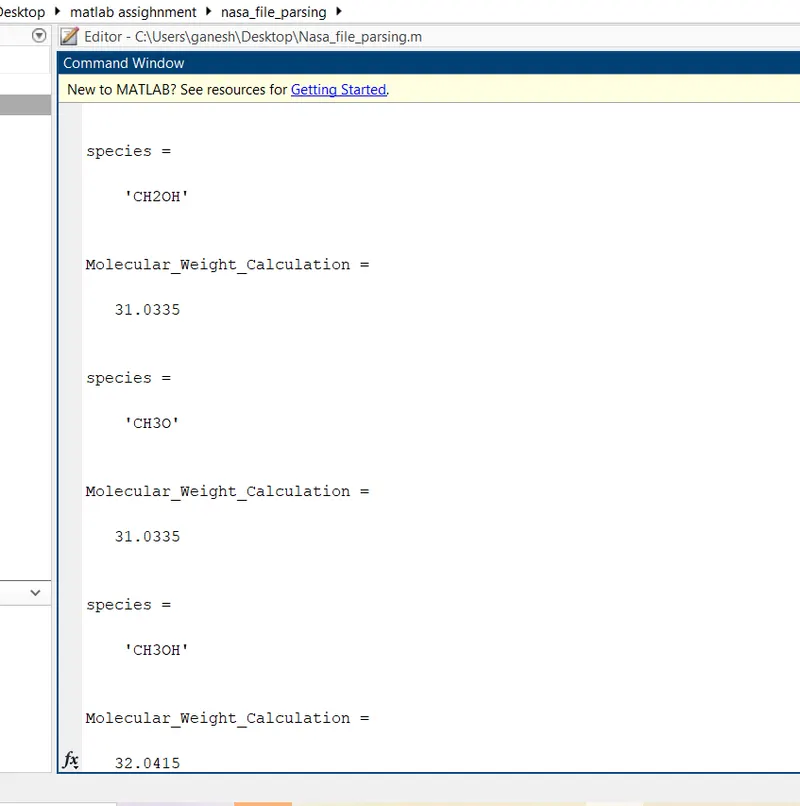
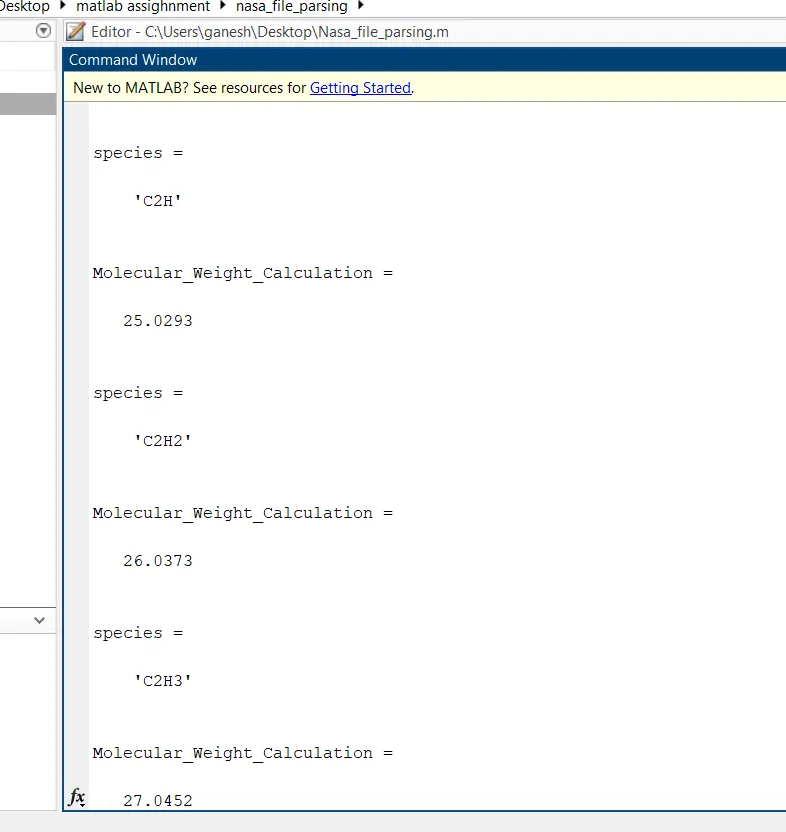
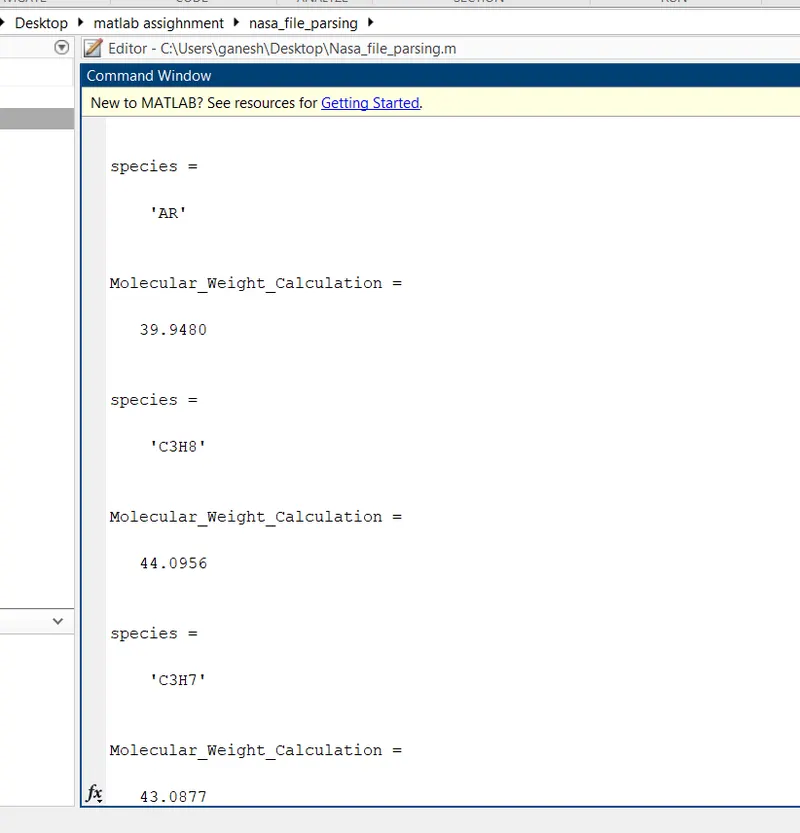
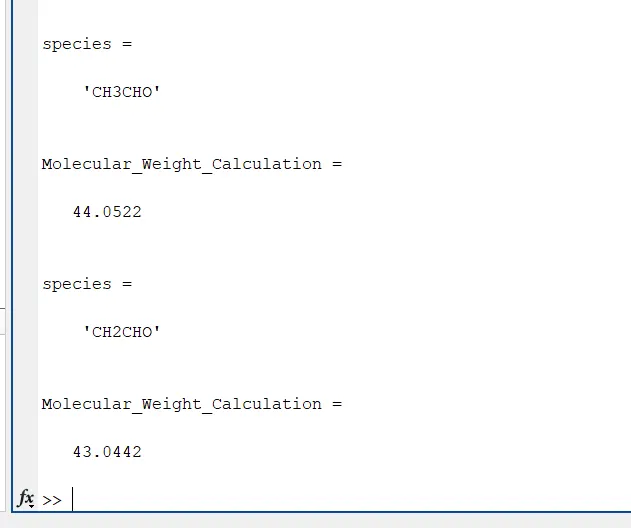
3.Molucular Weight of Every species :
4. Folder image where all plots of every spaciess are dumped :
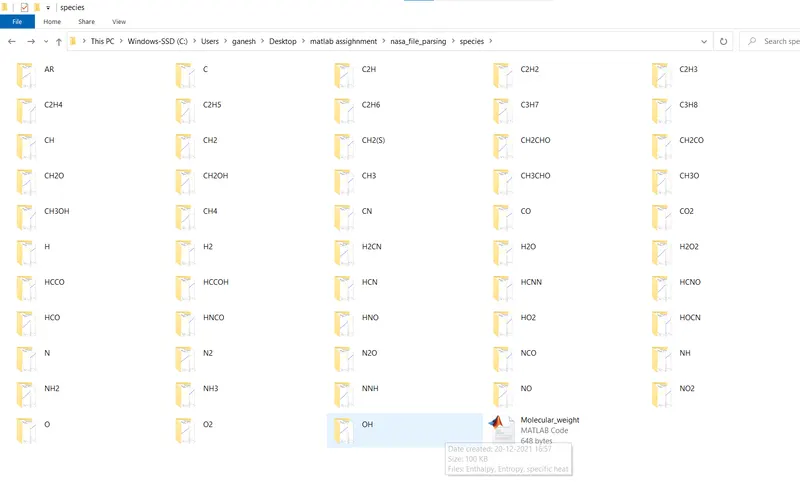
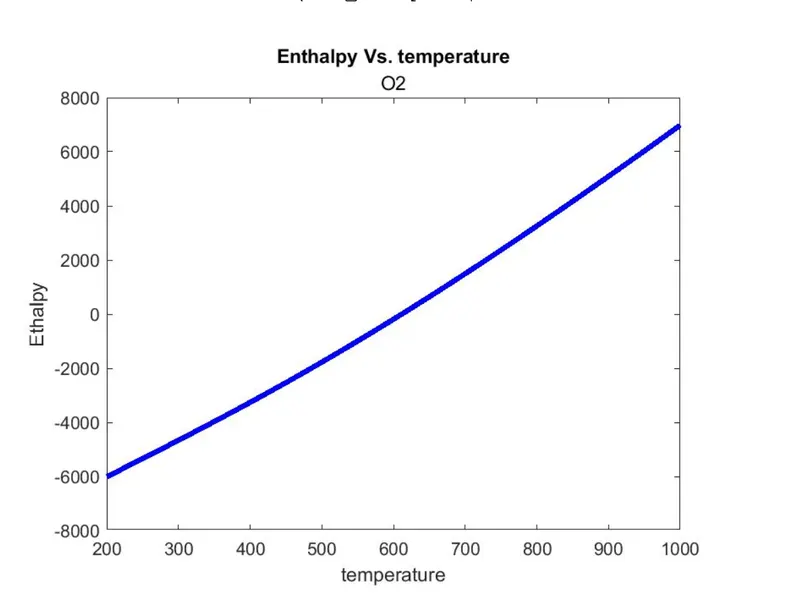
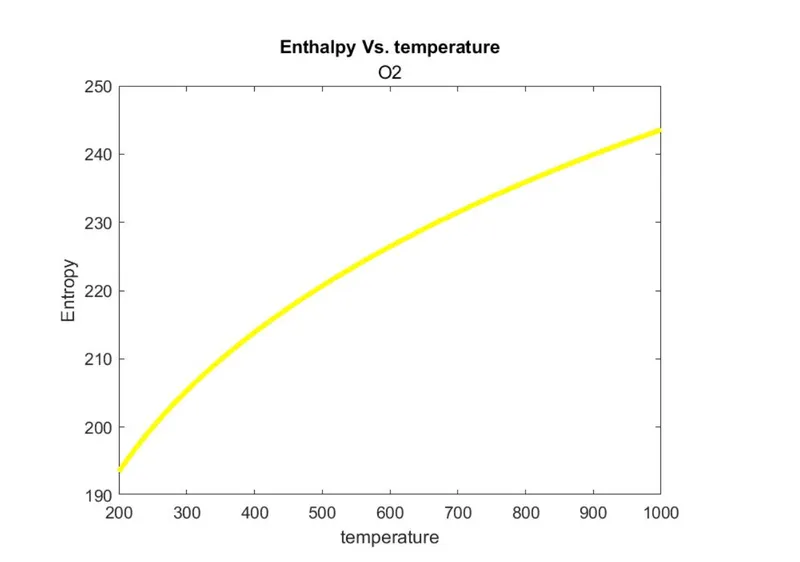
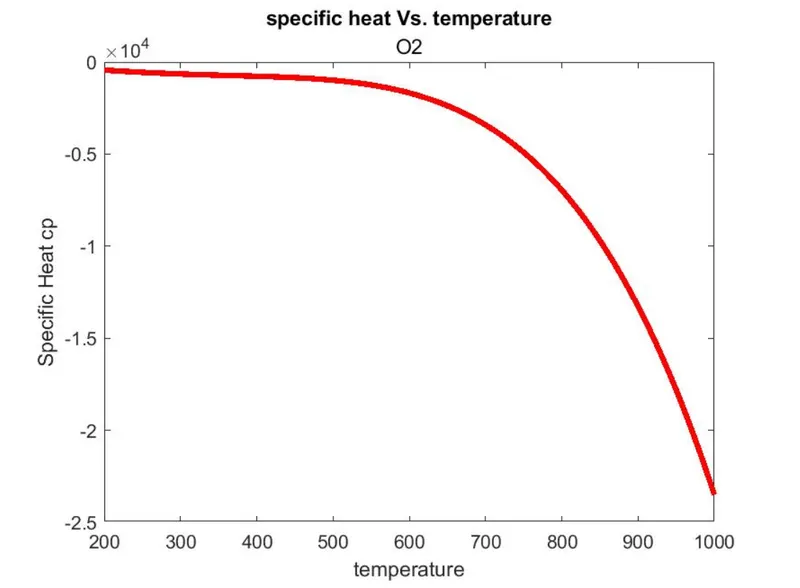
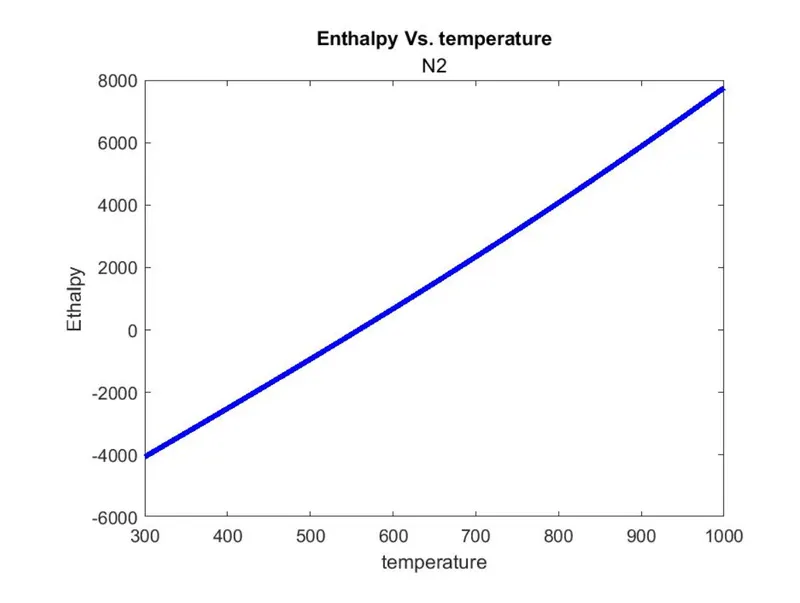
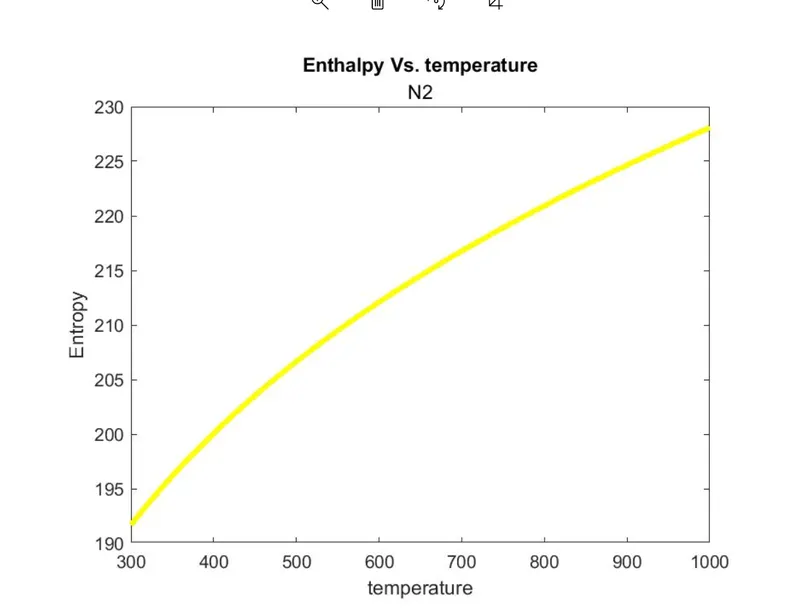
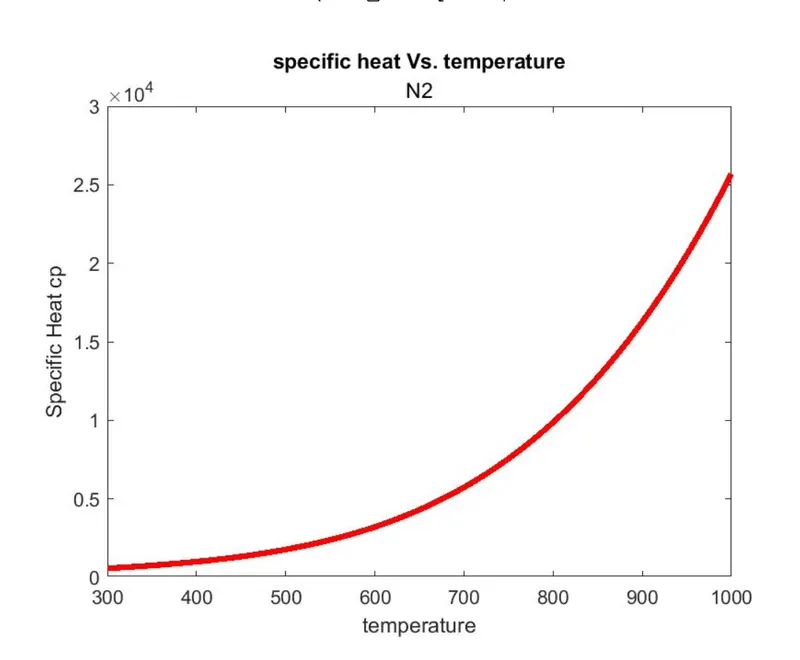
5. Plots of O2 , N2 and CO2 :
PLOTS of O2:
PLOTS of N2:
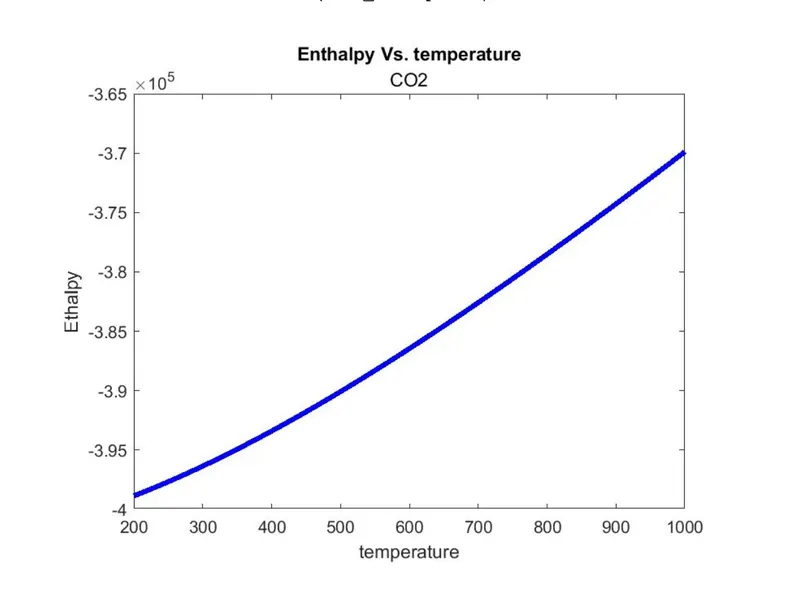
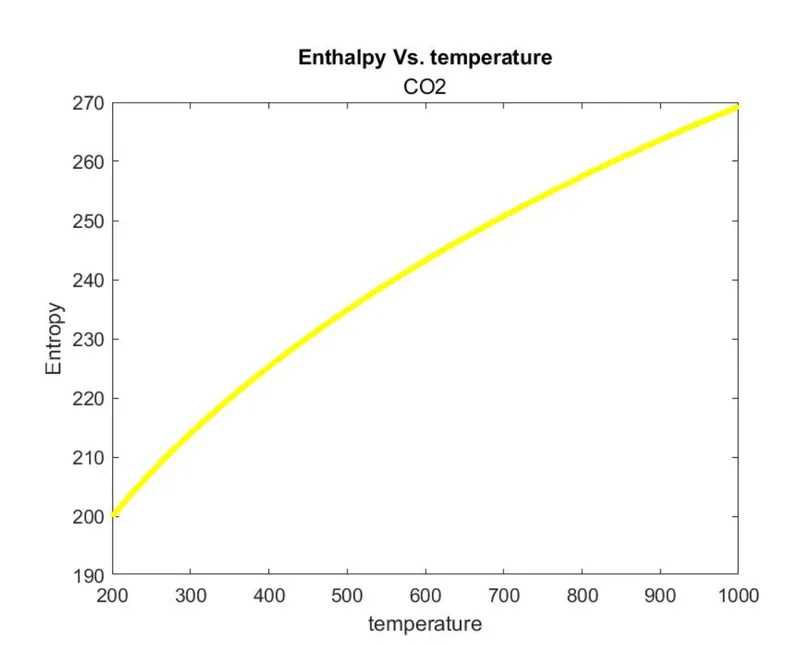
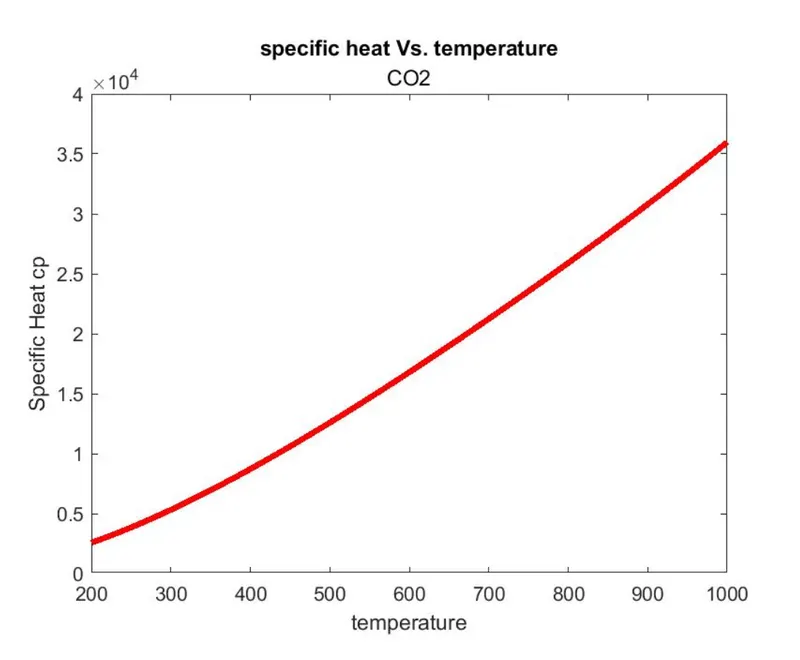
PLOTS of CO2: