Project 1 - Parsing NASA thermodynamic data
AIM: To parse the NASA Thermodynamic data using MATLAB
What is data parsing: Broadly speaking, data parsing means analyzing a string of data and then structuring it according to certain criteria. For example, you can take a sentence and then parse it by types of speech: nouns, verbs, adjectives, and so on.
To parse data or information means to break it down into component parts so that its syntax can be analyzed, categorized, and understood. If an error occurs while parsing information a parse error is generated
(or)
Data parsing is a method where one string of data gets converted into a different type of data. So let’s say you receive your data in raw HTML, a parser will take the said HTML and transform it into a more readable data format that can be easily read and understood.
The governing equations to calculate the Thermodynamic properties are :-

where, R = Universal gas constant = 8.314 (kJ/kg-K)
T = Temperature (K)
Cp = specific heat (J/KG-K)
H = Enthalpy (J)
S = Entropy (J/K) and
ai (where i = 1,2,3,4,5,6,7) = are coefficients.
1.Explanation of the code.
Starting the main code by opening the given NASA Thermodynamic data file i.e "THERMO.dat" using the function 'fopen' and we are going to read this file.
After opening the given file we are going to read the data given in the file line by line using the function 'fgetl'.
The fgetl function is used to read the 1st 5 lines which contains the heading, the global temperatures and the comments.
Later on The individual global temperatures are converted from string type to double using the function 'str2double' and in different variables.
The next step is to read species information i.e the local temperatures and coefficients associated to each individual species. First reading the line with the species name (ex : o2 N2 CO2 ...etc) and assigning this line to the variable called 'species' and then splitting this line where are there is a space so that we can extract the species name (ex: CHO, CO..etc).
The next and important step is to extract the coefficients which can done using the function 'strfind' where we find the location of the exponent 'E' of all the coefficients of that particular line and using the appropriate logic (here we are finding the location of 'E' and then adding the remaining values to obtain the exact value of the coefficients as shown in the code.
coeff_1 = str2double(line_1(1:(l1(1)+3))); here we are extracting the value of the 1st coefficient form the line and using 'str2double' converting the datat type from string to double and storing it in the variable 'coeff_1'. The number '1' in the above code indicates the location of the 1st value of the coefficient and l1(1) indicates the location of the 'E' and '+3' to add the 3 left out values of the coefficient.
Using the same logic to calculate all the 14 coefficients.
Later we are going to divide the global temperature ranges into 500 values using the function 'linspace'
The next step is to call the function 'coeff' which we have alreay written separately to calculate the Thermodynamic properties (i.e specific heat, Enthalpy and Entropy) using the coefficients that we have extracted for the given species as per the equation provided to calculate the same.
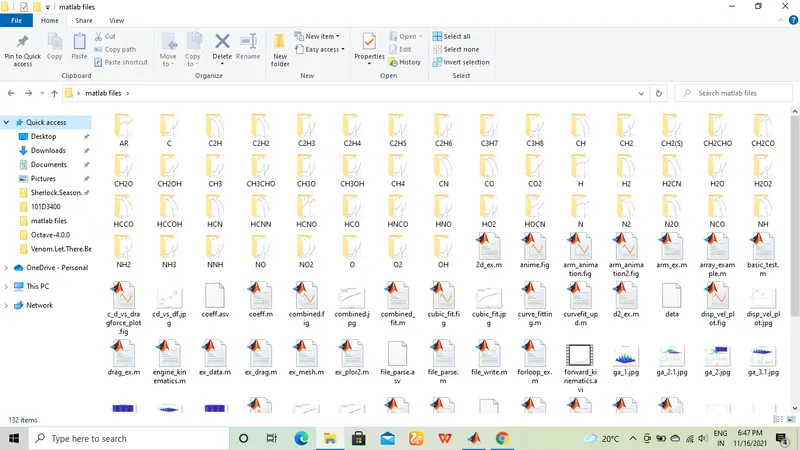
And then writing the code to create a new folder with the species name using the fucntion 'mkdir' and using the function 'cd' opening the folder that has been created and saving the plots inside this folder and repeating the same for the 53 species.
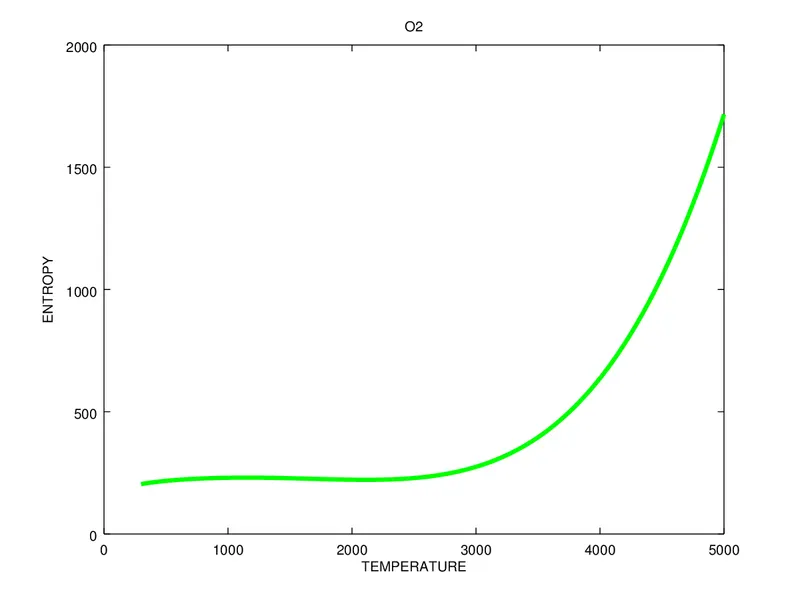
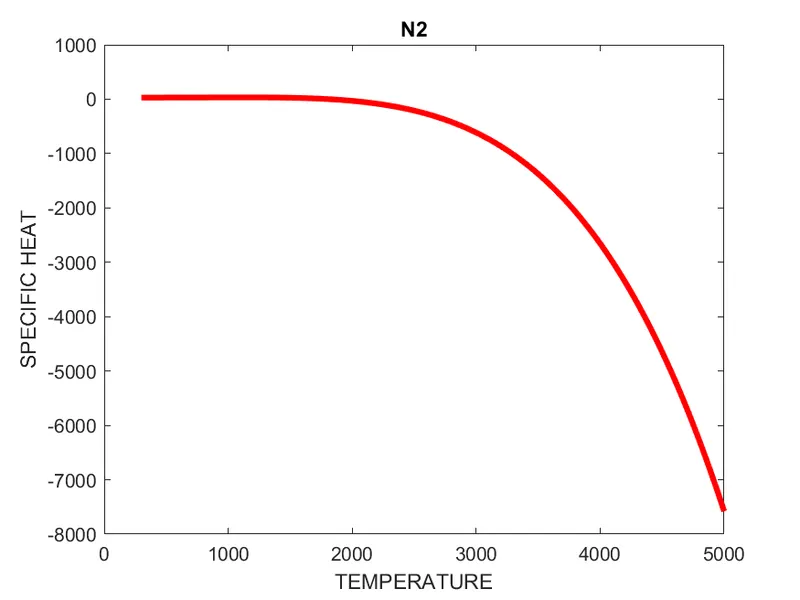
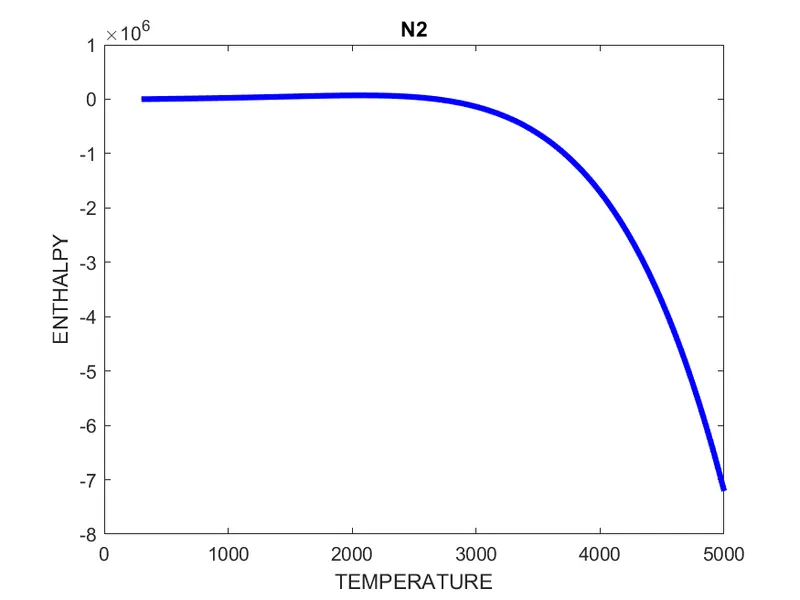
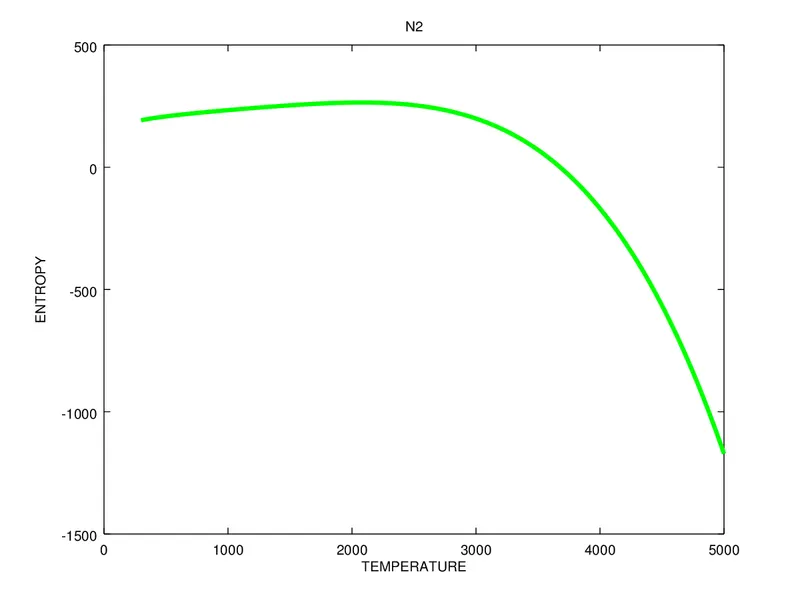
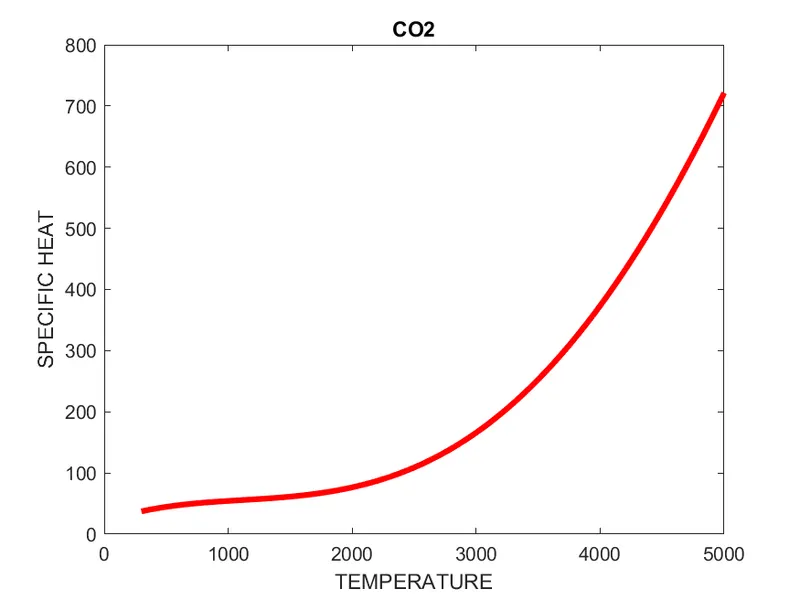
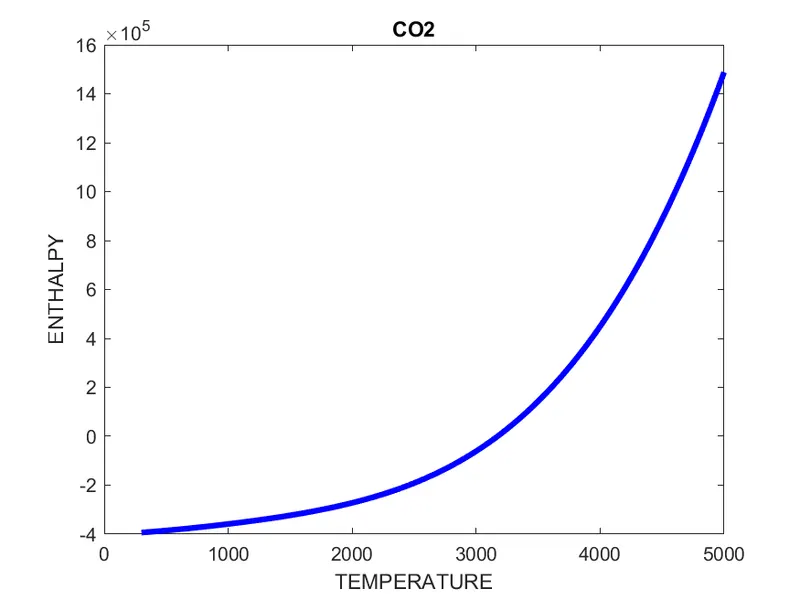
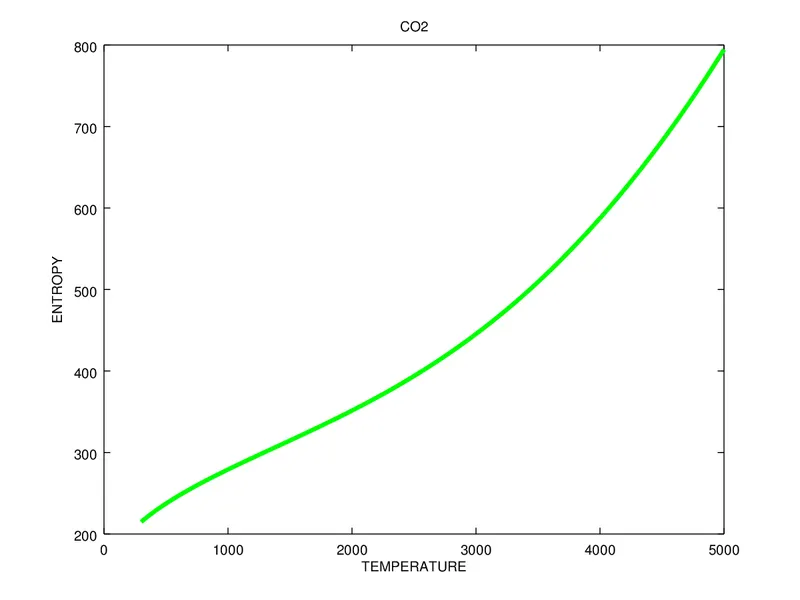
using plot command creating the plots and giving the title to the plot usig the command 'title' and also labelling the axes using the command 'xlabel' and 'ylabel'.
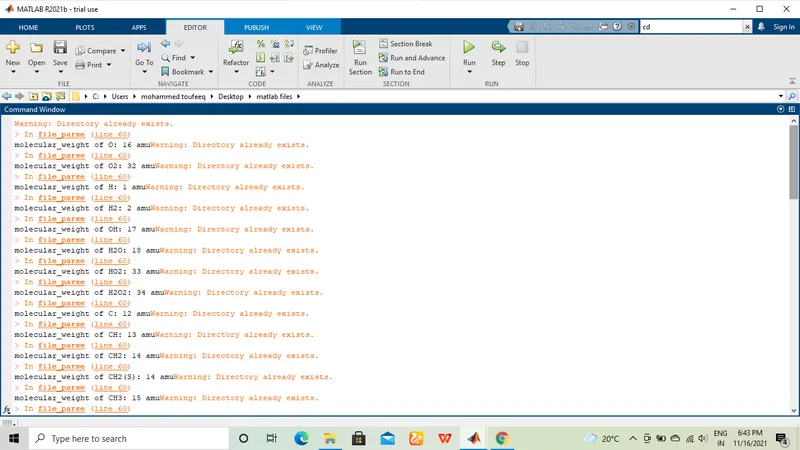
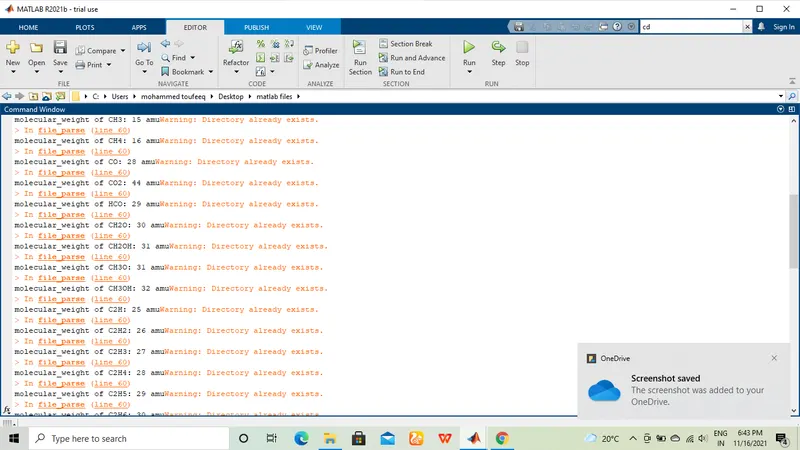
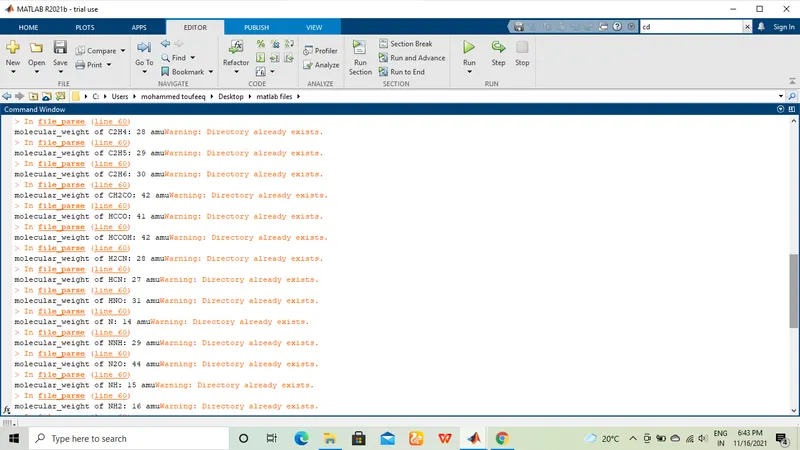
Next step is to calculate the molecular weight of each species and display it in the command window.
First we are creating a function called mol_wt and giving the inputs as species_name(ex: H20, H202..etc) and then declaring the constituents (in our case '5' constituents, namely: {'H','C','N','O','A'}) and assigning the atomic weight values to each of these constituents. We are going to compare the species_name with the constituents using the 'strcmp' and calculate the molecular weight (by adding the atomic weight of each of the constituents involved in the species_name) and repeating this logic to calculate molecular weight of all the species using the for loops and lastly using the command 'fprintf' to display the molecular weight of all species in the command window.
MAIN CODE
clear all
close all
clc

f1 = fopen('THERMO.dat','r');           % opening the given file under the variable 'f1'.
heading = fgetl(f1);                    %reading the 1st line (i.e THERMO)
global_temps = fgetl(f1);               %reading the global temperature line.
A = strsplit(global_temps,' ');         %separating the temperatures and storing in the
                                        variable 'A'.
global_low_temp = str2double(A{2});     %converting string data type to double and
                                        storing it in the variable.
global_mid_temp = str2double(A{3});     %converting string data type to double and
                                        storing it in the variable.
global_high_temp = str2double(A{4});    %converting string data type to double and
                                        storing it in the variable.

%Reading the comments
for i = 1:3
    comments = fgetl(f1);
end

%Reading the species information
for i = 1:53

    species = fgetl(f1);    %reading the line with the species name and assigning it to
                             the variable 'species'.
    B = strsplit(species,' ');  %separating the values where ever there is a space
    species_name = B{1};        %Extracting the species name form the line

    %Extracting the high temperature coefficients.

    line_1 = fgetl(f1); %reading the line
    l1 =  strfind(line_1,'E');  %finding the location of "E" of the coefficients from
                                the given line
    coeff_1 = str2double(line_1(1:(l1(1)+3)));        %Extracting the coefficient1
    coeff_2 = str2double(line_1(l1(1)+4:l1(2)+3));    %Extracting the coefficient2
    coeff_3 = str2double(line_1(l1(2)+4:l1(3)+3));    %Extracting the coefficient3
    coeff_4 = str2double(line_1(l1(3)+4:l1(4)+3));    %Extracting the coefficient4
    coeff_5 = str2double(line_1(l1(4)+4:l1(5)+3));    %Extracting the coefficient5
    line_2 = fgetl(f1);%reading the line
    l2 = strfind(line_2,'E');       %finding the location of "E" of the coefficients
                                    from the given line

    coeff_6 = str2double(line_2(1:(l2(1)+3)));         %Extracting the coefficient6
    coeff_7 = str2double(line_2(l2(1)+4:l2(2)+3));     %Extracting the coefficient7

    % Extracting low temperature coefficients.

    coeff_8 = str2double(line_2(l2(2)+4:(l2(3)+3)));    %Extracting the coefficient8.
    coeff_9 = str2double(line_2(l2(3)+4:(l2(4)+3)));    %Extracting the coefficient9.
    coeff_10 = str2double(line_2(l2(4)+4:(l2(5)+3)));   %Extracting the coefficient10.
     line_3 = fgetl(f1);                                %reading the line
     l3 = strfind(line_3,'E');       %finding the location of "E" of the coefficients
                                     from the given line.

    coeff_11 = str2double(line_3(1:(l3(1)+3)));         %Extracting the coefficient11.
    coeff_12 = str2double(line_3(l3(1)+4:l3(2)+3));     %Extracting the coefficient12.
    coeff_13 = str2double(line_3(l3(2)+4:l3(3)+3));     %Extracting the coefficient13.
    coeff_14 = str2double(line_3(l3(3)+4:l3(4)+3));     %Extracting the coefficient14.


    T = linspace(global_low_temp,global_high_temp,500); %Creating 500 values between
                                                  lower and higher global temperaures.

    %Calling the function to calculate the thermodynamic properties.

    [cp, h, s] = coeff(coeff_1, coeff_2, coeff_3, coeff_4, coeff_5, coeff_6, coeff_7,
    coeff_8, coeff_9, coeff_10, coeff_11, coeff_12, coeff_13, coeff_14, T);
    mkdir('C:\Users\mohammed toufeeq\Desktop\matlab files',species_name);    %creating
                                                a new folder inside the current folder
    cd(species_name);      %opening the new folder and saving the plot inside this
                           folder.

    %Creating the plot

    %plot between temperature and specific heat
    figure(1);
    plot(T,cp,'linewidth',3,'color','r');      %creating the plot.
    title(species_name);                       %Title of the plot
    xlabel('TEMPERATURE');                     %label on the x_axis
    ylabel('SPECIFIC HEAT');                   %label on the y_axis

    %plot between temperature and enthalpy.
    figure(2);
    plot(T,h,'linewidth',3,'color','b');       %creating the plot.
    title(species_name);                       %Title of the plot
    xlabel('TEMPERATURE');                     %label on the x_axis
    ylabel('ENTHALPY');                        %label on the y_axis

    %plot between temperature and entropy.
    figure(3);
    plot(T,s,'linewidth',3,'color','g');       %creating the plot.
    title(species_name);                       %Title of the plot
    xlabel('TEMPERATURE');                     %label on the x_axis
    ylabel('ENTROPY');                         %label on the y_axis
    saveas(figure(1),'Specific_heat.png');     %saving the plot in the species_name
                                               folder.
    saveas(figure(2),'Enthalpy.png');          %saving the plot in the species_name
                                               older.
    saveas(figure(3),'Entropy.png');           %saving the plot in the species_name
                                               folder.
    cd('C:\Users\mohammed toufeeq\Desktop\matlab files');  %coming out of the
                    species_name folder and going back to where the main code is saved.
    [molecular_weight] = mol_wt(species_name); %calling the function mol_wt to
                          calculate and display the molecular weight of all the species
end
fclose(f1);                                    %Closing the file.
Function call to calculate the Thermodynamic properties.
function [cp, h, s] = coeff(coeff_1,coeff_2,coeff_3,coeff_4,coeff_5,coeff_6,coeff_7,coeff_8,coeff_9,coeff_10,
                      coeff_11,coeff_12,coeff_13,coeff_14,T)
R = 8.314;              %Value of universal gas constant.
for j = 1:length(T)     %Running the loop for 500 times
    if T(j)<300

        %Calculating specific heat as per the formula provided.
        cp = (coeff_1+(coeff_2.*T)+(coeff_3.*T.^2)+(coeff_4.*T.^3)+(coeff_5.*T.^4))*R;

        %Calculating enthalpy as per the formula provided.
        h = ((coeff_1+coeff_2.*(T/2))+(coeff_3.*(t.^2./3))+(coeff_4.*(T.^3./3))+
             (coeff_5*(T.^4./4))+(coeff_6./T))*R.*T;

        %Calculating entropy as per the formula provided.
        s = ((coeff_1.*log(T))+(coeff_2.*T)+(coeff_3.*(T.^2./3))+(coeff_4.*(T.^3./3))+
              (coeff_5.*(T.^4./4))+(coeff_7))*R;
    else
        %If the temperature is more than 300 then the other 7 coefficients
        %will be used with the same formula to calculate the properties.

        %Calculating specific heat as per the formula provided.
        cp = (coeff_8+(coeff_9*T)+(coeff_10*T.^2)+(coeff_11*T.^3)+(coeff_12*T.^4))*R;
        %Calculating enthalpy as per the formula provided.

        h = ((coeff_8+coeff_9.*(T./2))+(coeff_10.*(T.^2./3))+(coeff_11.*(T.^3./3))+
              (coeff_12.*(T.^4./4))+(coeff_13./T))*R.*T;
        %Calculating entropy as per the formula provided.

        s = ((coeff_8.*log(T))+(coeff_9.*T)+(coeff_10.*((T.^2)./3))+(coeff_11.*
             ((T.^3)./3))+(coeff_12.*((T.^4)./4))+(coeff_14))*R;
    end    %end of if statement
end        %end of for statement
end        %end of the function
CODE TO CALCULATE THE MOLECULAR WEIGHT
function [molecular_weight] = mol_wt(species_name) %function to calculate the molecular
                                                   weight of the species.
    %SPECIES = upper(species_name);
    constituents = ['H','C','N','O','A'];          %declaring the elements that are
                                                   involved in the species
    atomic_weight = [1 12 14 16 40];               %Atomic weight of the species.
    molecular_weight = 0;               %Assigning 0 to moecular weight initially
    for i = 1:length(species_name)      %for the length of the species calculating the
                                        molecular weight
        for j = 1:length(constituents)  %locating the constituent from the list.
            if strcmp(species_name(i),constituents(j))  %comparing the species_name
                                                        with the constituents
                molecular_weight = molecular_weight+atomic_weight(j); %calculating the
                                    molecular weight by adding the atomic_weight value
                u = j;
            end
        end
        n = str2double(species_name(i));    %converting the string data type to double
        if n>1           %If the number involved in the species name is greater than 1
            molecular_weight = molecular_weight+atomic_weight(u)*(n-1);   %calculating
                                 the molecular weight by adding the atomic_weight value
        end
    end
    fprintf('molecular_weight of %s: ',species_name)  %To display species_name
    fprintf('%d',molecular_weight)                    %To display atomic weight value.
    fprintf(' ')
    fprintf('amu')                              %To display amu (i.e atomic mass unit).
end
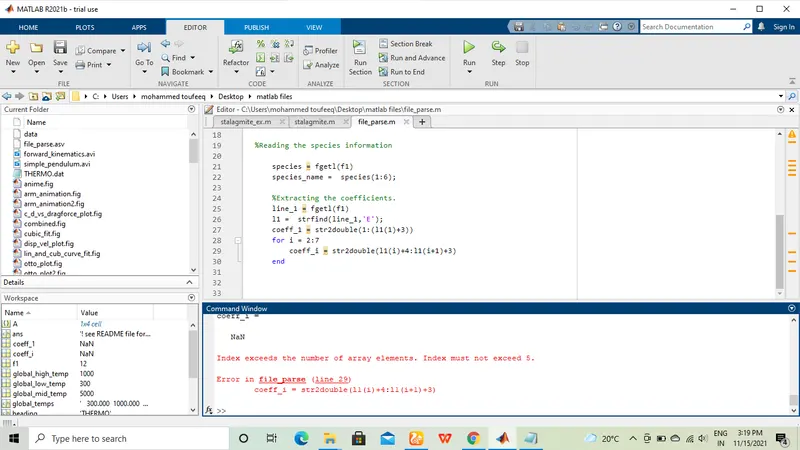
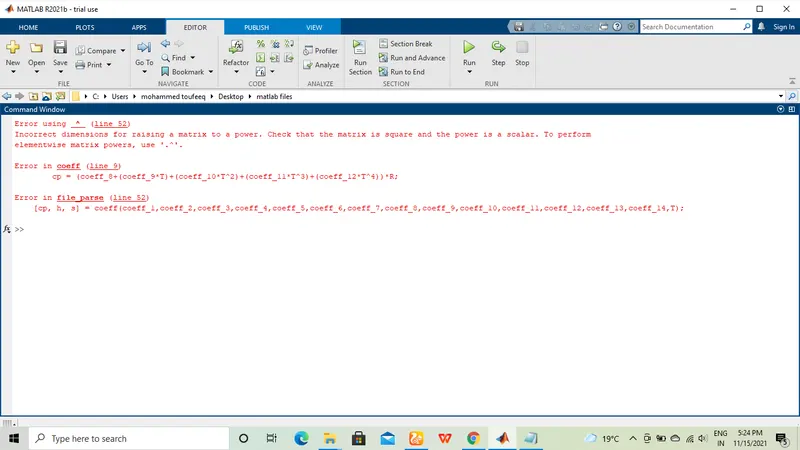
2.Errors faced while programming
1.Error stating 'index exceeds the number of array elements'
2.Error stating 'incorrect dimensions for raising a matrix to a power'
Screenshots below show the errors thrown in the command window
3. Steps taken to overcome these errors
1.The 1st error appeared because i was trying to use a for loop to calculate the coefficients which did not workout as i was not able change the coefficient names using the for loop so i had the write the code individually for all the coefficients and the error was rectified.
2. The 2nd error appeared because i forget to type the element wise operator i.e "." when raising the power in the equations which was rectified later.
SCREENSHOTS OF THE WINDOW WHERE ALL THE FOLDERS ARE SAVED
SREENSHOTS SHOWING THE MOLECULAR WEIGHTS DISPLAYED IN THE COMMAND WINDOW
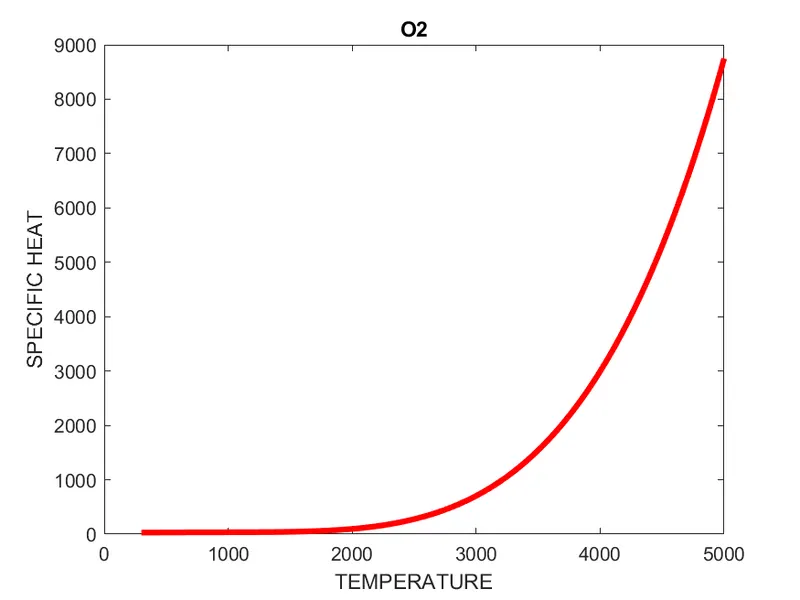
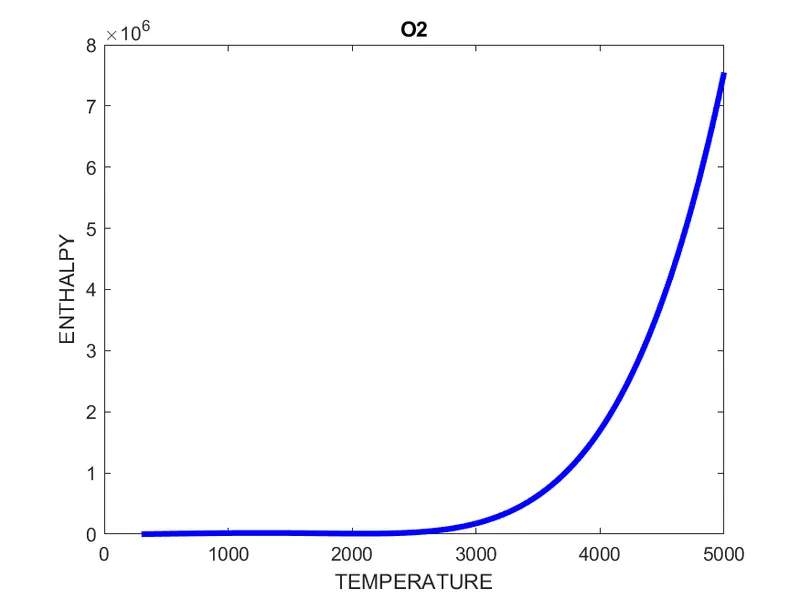
PLOT FOR O2
PLOT FOR N2
PLOT FOR CO2
References: 1.https://proxyway.com/guides/what-is-data-parsing#
2. https://skill-lync.com/student-projects/parsing-nasa-thermodynamic-data-190
3. https://oxylabs.io/blog/what-is-data-parser
4. Youtube