Project 1 - Parsing NASA thermodynamic data
1.enthalpy: it is a property of thermodynamic system,is a sum of systems internal energy and the product of pressure and volume.
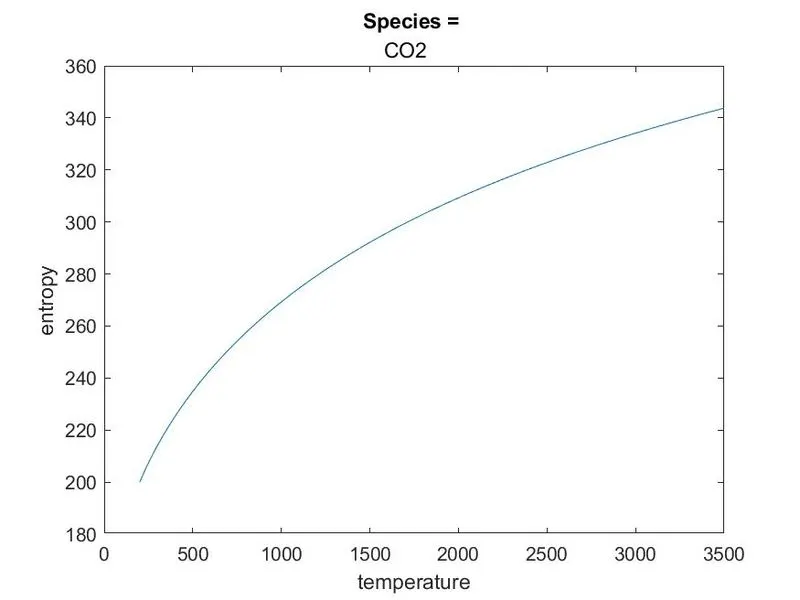
entropy: a thermodynamic quantity representing the unavilability of systems thermal energy for conversion into mechanical energy,often interpreted as the degree of randomness in the system.
specific heat: it is the amount of heat that must be added to one unit mass of the substance in order to cause of unit rise in temperature
function of file parse:
function [c_p,H,S]= fileparse(a1,a2,a3,a4,a5,a6,a7,a8,a9,a10,a11,a12,a13,a14,Tl3,temp_o)

R=8.314;
%using if condition to execute right set of blocks using mean temperature

if( temp_o >=Tl3)

    c_p =R*(a1+a2.*temp_o+a3.*temp_o.^2+a4.*temp_o.^3+a5.*temp_o.^4);
    H=R.*temp_o.*(a1+a2.*(temp_o/2)+a3.*((temp_o.^2)/3)+a4.*((temp_o.^3)/4)+a5.*((temp_o.^4)/5)+a6./temp_o);
    S=R.*(a1.*log(temp_o)+a2.*temp_o+a3.*((temp_o.^2)/2)+a4.*((temp_o.^3)/3)+a5.*((temp_o.^4)/4)+a7);

else

     c_p =R*(a8+a9.*temp_o+a10.*temp_o.^2+a11.*temp_o.^3+a12.*temp_o.^4);
     H=R.*temp_o.*(a8+a9.*(temp_o)/(2)+a10.*((temp_o.^2)/3)+a11.*((temp_o.^3)/4)+a12.*((temp_o.^4)/5)+a13./temp_o);
     S=R.*(a8.*log(temp_o)+a9.*temp_o+a10.*((temp_o.^2)/2)+a11.*((temp_o.^3)/3)+a12.*((temp_o.^4)/4)+a14);

end2.function to calculate molecular weight:
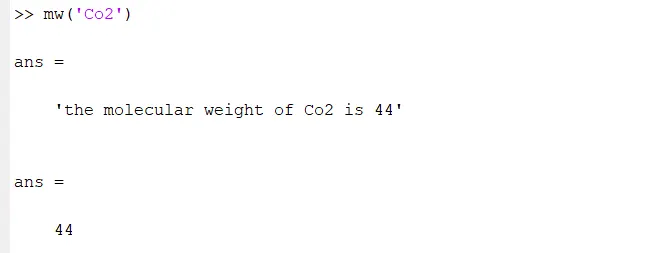
function [molecular_wt] = mw(species_name)

%elements is an array of species atomic symbol
%atomic_wt  an array represents the atomic weights

elements=['H','C','N','O','A'];
atomic_wt=[1 ,12 ,14 ,16 ,40];
molecular_wt=0;

for i=1:length(species_name)
    for j=1:length(elements)
        if strcmpi(species_name(i),elements(j))==1
            molecular_wt=molecular_wt+atomic_wt(j);
            position=j;
        end
    end
    f=str2num(species_name(i));
    if f>1
        molecular_wt=molecular_wt+atomic_wt(position)*(f-1);
    end

end
sprintf('the molecular weight of %s is %d',species_name,molecular_wt)
endreport:
aim:
program to plot cp ,H and s plots with respect to the temperature and calculate the molecular weight of each and every component
governing equations:
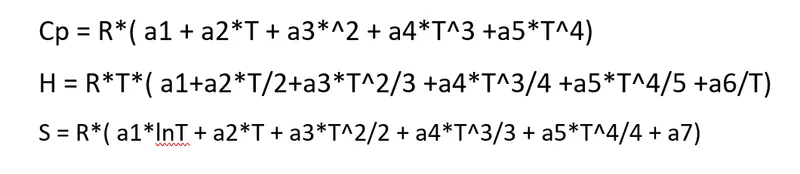
cp = specific heat
H = enthalpy
s = entropy
R = universal gas constant
T = temperature
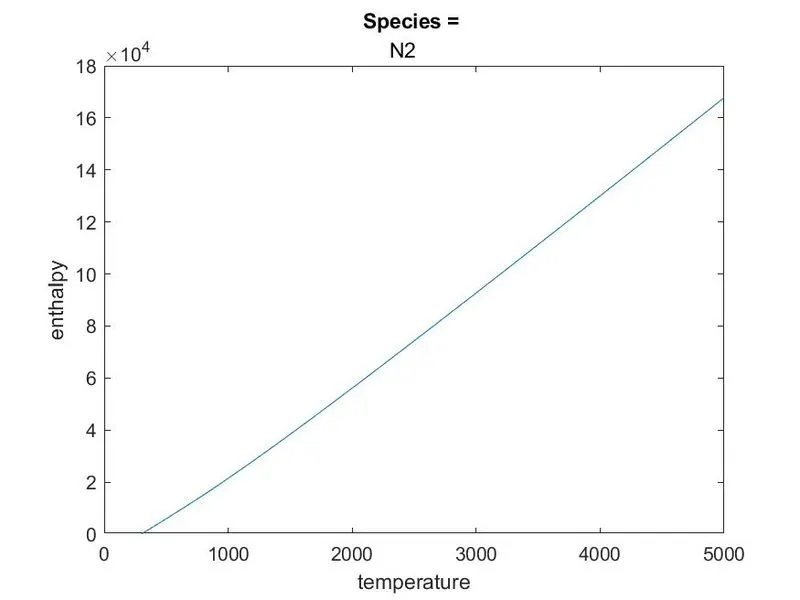
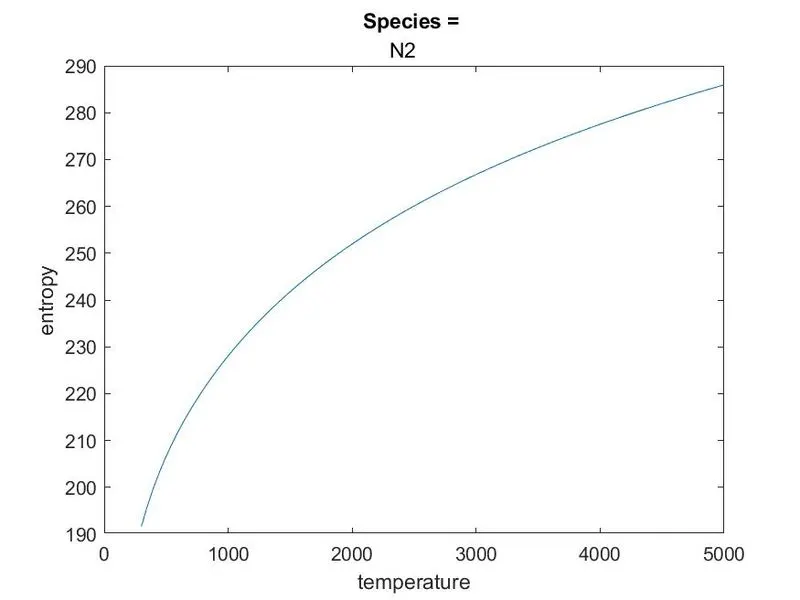
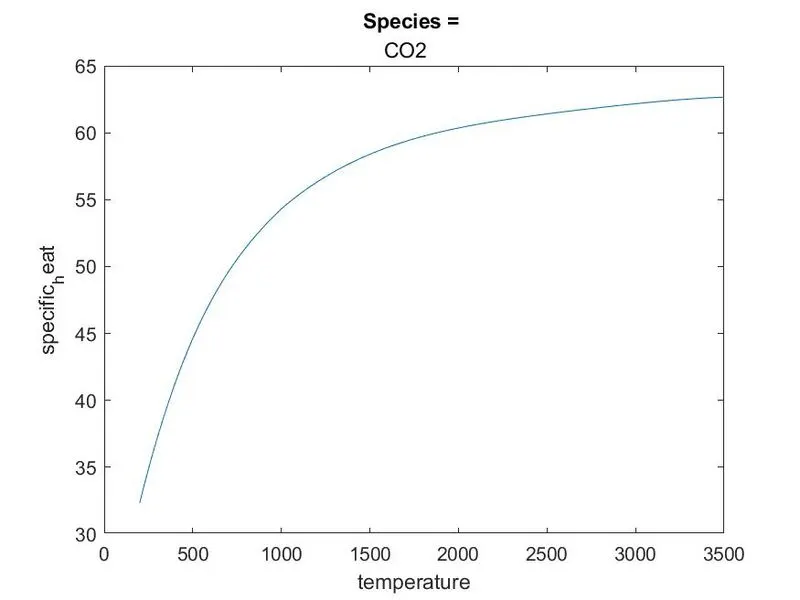
using the above set of equations we can can get the different values of cp ,H and S such that we can plot the graphs between the temperatures and cp,h ,s
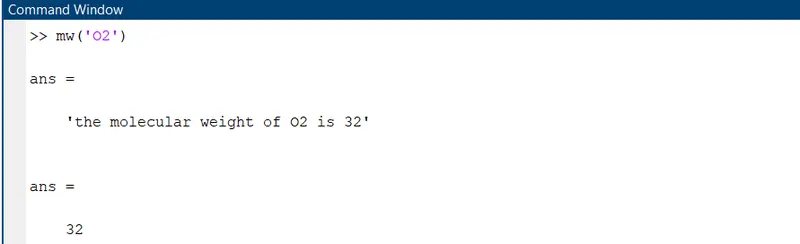
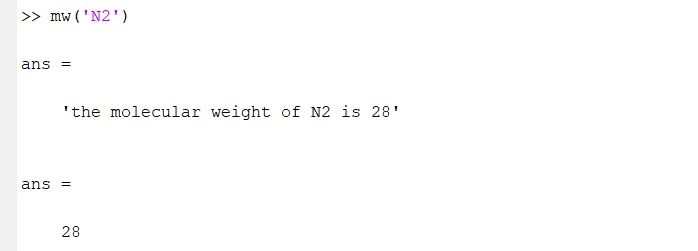
molecular weight = atomic weight
for singular components such as hydrogen .carbon ,oxygen atomic weight itself represents the molecular weight of the component which is twice that of atomic number
where as of compound components it changes which is equal to sum of all atomic weights
objective:
the main objective of program is to plot the graphs of cp vs T , H vs T and S vs T and also molecular weights of each species
body:
matlab is the software used to develop the program
clear all
clc
close all

%open the  thermo file to read the contents to the code
%fgetl command returns output that dispalys in one line
%strsplit command splits the string get alloted in to cells

f2 = fopen('themo.dat','r');
fgetl(f2);
temp=fgetl(f2);
A=strsplit(temp,' ');

%str2double converts string datatype variables in to floating point numbers

globel_low_temp=str2double(A{2});
globel_med_temp=str2double(A{3});
globel_high_temp=str2double(A{4});

% the loop is used to skip the comments using fgetl command

for i=3:5
    g=fgetl(f2);
end

%for loop is used to get the plots and molecular weights for individual
%species

for j=1:53

    species=fgetl(f2);
    %strfind command is used to find specified character in the given
    %string

    t=strfind(species,'.');

    %local temperatures

    species(52-3:52+3);
    T1=species(52-3:t(1)+3);
    Tl1=str2double(T1);

    species(t(1)+6:62+3);
    T2=species(t(1)+6:t(2)+3);
    Tl2=str2double(T2);

    species(t(2)+6:72+3);
    T3=species(t(2)+6:t(3)+3);
    Tl3=str2double(T3);

    species_name=species(1:6);


    l1=fgetl(f2);
    a=strfind(l1,'E');
    a1=l1(1:a(1)+3);
    a1=str2double(a1);
    a2=str2double(l1(a(1)+4:a(2)+3));
    a3=str2double(l1(a(2)+4:a(3)+3));
    a4=str2double(l1(a(3)+4:a(4)+3));
    a5=str2double(l1(a(4)+4:a(5)+3));

    l2=fgetl(f2);
    b=strfind(l2,'E');
    a6=l2(1:b(1)+3);
    a6=str2double(a6);
    a7=str2double(l2(b(1)+4:b(2)+3));
    a8=str2double(l2(b(2)+4:b(3)+3));
    a9=str2double(l2(b(3)+4:b(4)+3));
    a10=str2double(l2(b(4)+4:b(5)+3));

    l3=fgetl(f2);
    c=strfind(l3,'E');
    a11=l3(1:c(1)+3);
    a11=str2double(a11);
    a12=str2double(l3(c(1)+4:c(2)+3));
    a13=str2double(l3(c(2)+4:c(3)+3));
    a14=str2double(l3(c(3)+4:c(4)+3));

    %temp_o contains the set of values temperaturebetween to specified
    %temperaqtures

    temp_o=linspace(Tl1,Tl2,100);

    %using the for loop calling the function by passing the arguments and
    %stored in to the  arrays of c_p ,H ,S

    for i=1:length(temp_o)
        [c_p(i),H(i),S(i)]=fileparse(a1,a2,a3,a4,a5,a6,a7,a8,a9,a10,a11,a12,a13,a14,Tl3,temp_o(i));
    end

    %mkdir command creates folder with name of species_name
    %cd command changes the current folder to a newfolder

    mkdir(species_name);
    cd(species_name);

    %plot between specific heat and tempearture

    figure(1)
    plot(temp_o,c_p)
    xlabel('temperature')
    ylabel('specific_heat')
    title('Species = ',species_name);
    saveas(1,'Cp Vs T.jpg')

     %plot between enthalpy and tempearture

    figure(2)
    plot(temp_o,H)
    xlabel('temperature')
    ylabel('enthalpy')
    title('Species = ',species_name)
    saveas(2,'H Vs T.jpg')

    %plot between entropy and tempearture

    figure(3)
    plot(temp_o,S)
    xlabel('temperature')
    ylabel('entropy')
    title('Species = ',species_name)
    saveas(3,'S Vs T.jpg')

    % clculating the molecular weight calling the function mw

    molecular_weight_calculation=mw(species_name);
cd ..
end
conclusion:
this project contain two functions one in which is used create the plots and another function is to calculate the moleculer weights
file parsing technique used to read the nasa data provided using fgetl command we acess the entire data in a line on this basic concept we can written a logic so that we can calculate cofficient values using for loop to this logic makes quite simple
by using the commands above we can read the data quite easily and also perfom various operations
results:

graphs:
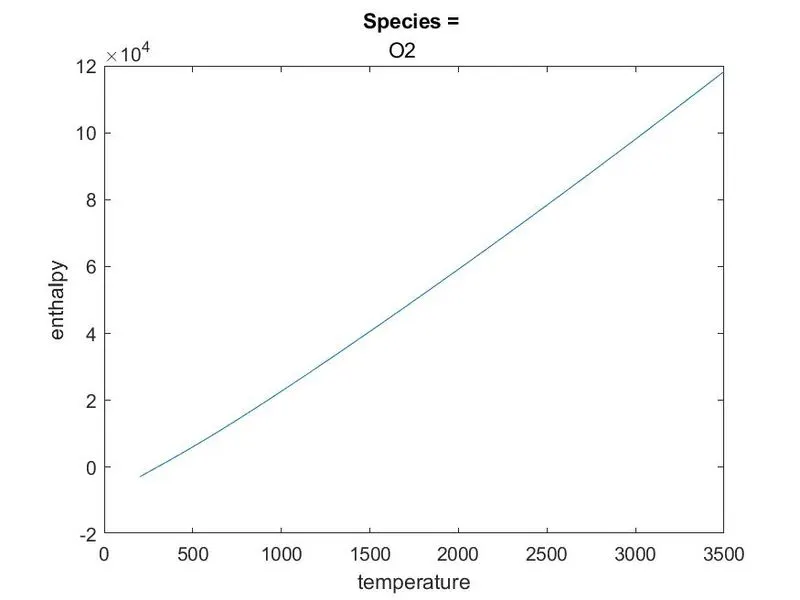
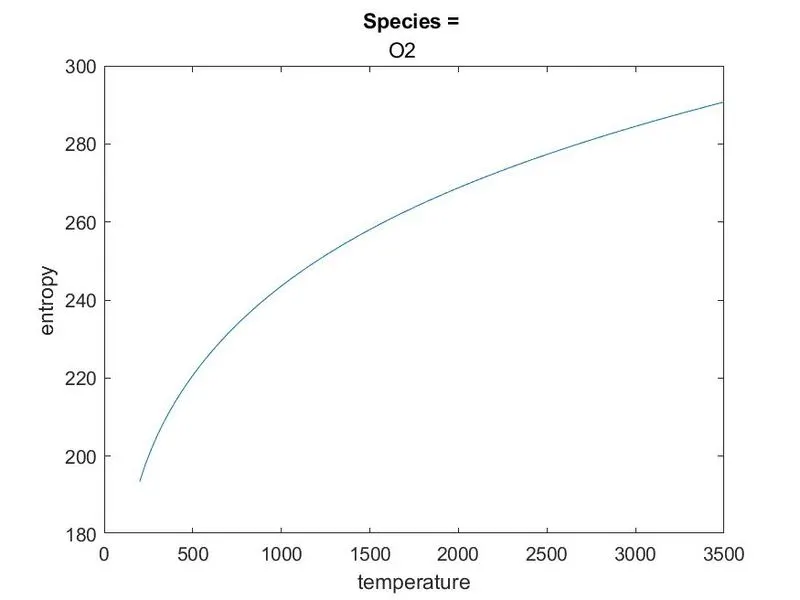
plots of o2
c_p vs T
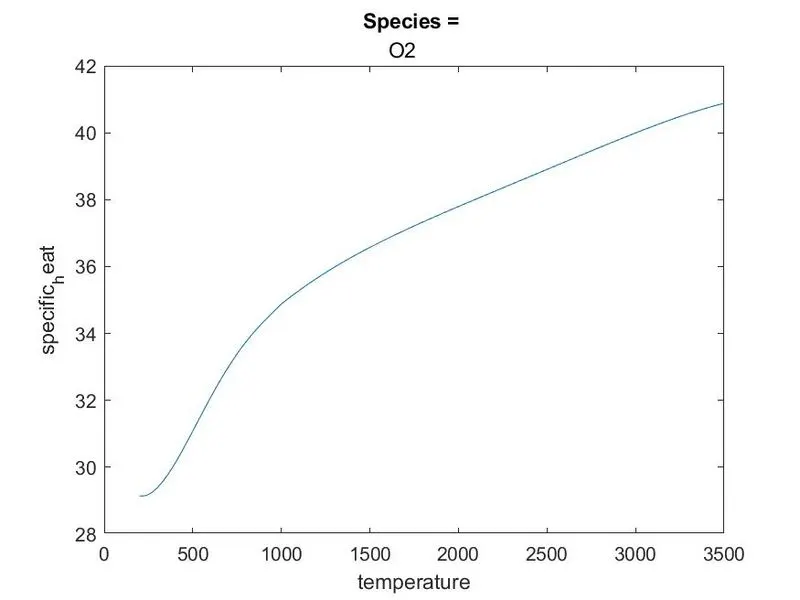
H VS T
S vs T
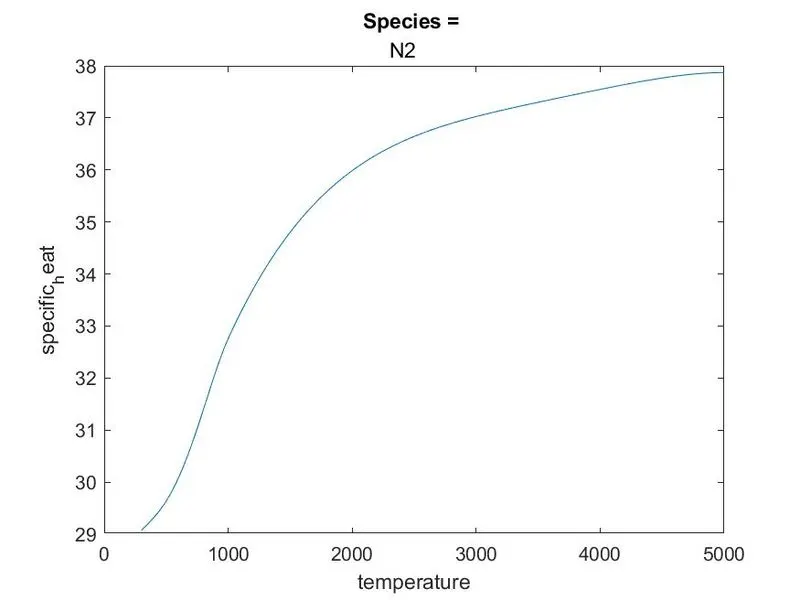
plots of N2
c_p vs T
H vs T
S vs T
plots of co2
c_p vs T
H vs T
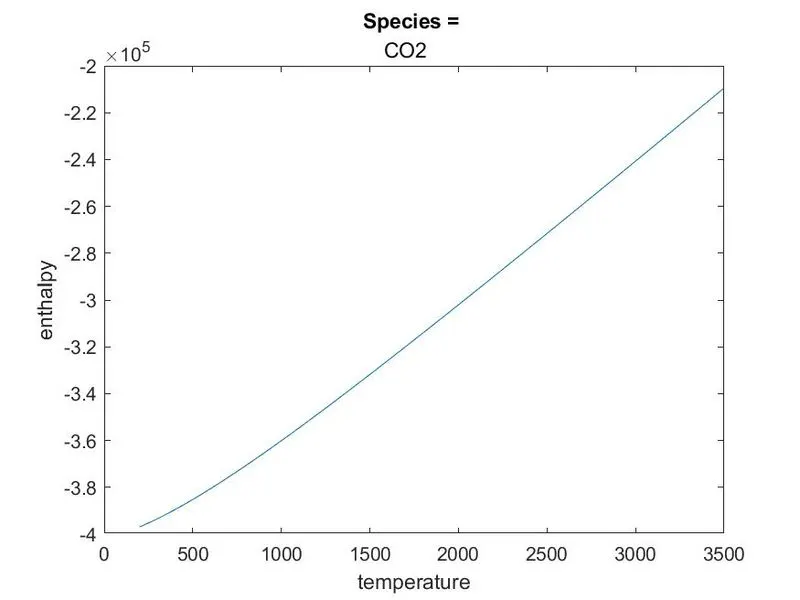
S vs T