Project 1 - Parsing NASA thermodynamic data
FILE PARSING:
Nasa Thermodynamic Data:
In this project, we make use of the File parsing method using MATLAB programming to extract the information from the given Nasa Thermodynamic Data(THERMO.dat) file which can be obtained from the drive using the following link,
https://drive.google.com/file/d/1n7NUs20_wiGw8sjh8rVngdyM4eeTA6rM/view?usp=sharing.
Aim:
The following points are the main objectives/aims which are to be compiled in this report.
- To write a function that extracts the 14 coefficients and calculates the enthalpy, entropy, and specific heats for all the species in the data file.
- To calculate the molecular weight of each species and display it in the command window.
- To plot the Cp, Enthalpy, and Entropy for the local temperature range (low temperature: high temperature) specific for each species.
- To save the plots as images with appropriate names and dump them in separate folders for each species with a suitable name.
Procedure:
- The main program will be framed by taking the "THERMO.dat" file as the input source.
- Then, we would perform some MATLAB-based Read mode commands, and some split and obtain features in order to gain the main and essential terms needed for the operation.
- Write a Universal code to obtain the header information, and also form a code to obtain all 14 coefficients for each and every individual species(53) from the Species block of the data file.
- Write Codes as functions for 4 different properties namely, 1. Enthalpy, 2. Entropy, 3. Specific Heat, and 4. Molecular Weight with the help of the governing equations for the first 3 properties which are given as in the below image.

- The first 7 coefficients are high-temperature coefficients and the second 7 coefficients are low-temperature coefficients.
- Write a code to create the function file for Molecular weight such that it must obtain the MWs of every species.
Let us now move on to the MATLAB code and discuss the steps involved in it in detail.
Matlab Code:
First, let us frame the function codes for the properties of 1. Enthalpy, 2. Entropy, and 3. Specific Heat respectively, and then move to the main code that includes File Parsing commands.
Function Code of Enthalpy:
function [H]=enthalpy(a_1,a_2,a_3,a_4,a_5,a_6,a_7,a_8,a_9,a_10,a_11,a_12,a_13,a_14,R,T,g_mid_temp)
    if T<=g_mid_temp
        H = (a_8 + (a_9.*T)./2 + (a_10.*(T).^2)./3 + (a_11.*(T).^3)./4 + (a_12.*(T).^4)./5 + (a_13./T)).*(R.*T);
    else
        H = (a_1 + (a_2.*T)./2 + (a_3.*(T).^2)./3 + (a_4.*(T).^3)./4 + (a_5.*(T).^4)./5 + (a_6./T)).*(R.*T);
    end
end
Function Code of Entropy:
function [S]=entropy(a_1,a_2,a_3,a_4,a_5,a_6,a_7,a_8,a_9,a_10,a_11,a_12,a_13,a_14,R,T,g_mid_temp)
    if T<=g_mid_temp
        S = R*((a_8.*log(T)) + (a_9.*T) + (a_10.*(T).^2)./2 + (a_11.*(T).^3)./3 + (a_12.*(T).^4)./4 + (a_14));
    else
        S = R*((a_1.*log(T)) + (a_2.*T) + (a_3.*(T).^2)./2 + (a_4.*(T).^3)./3 + (a_5.*(T).^4)./4 + (a_7));
    end
end
Function Code of Specific Heat:
function [CP]=specific_heat(a_1,a_2,a_3,a_4,a_5,a_6,a_7,a_8,a_9,a_10,a_11,a_12,a_13,a_14,R,T,g_mid_temp)
    if T<=g_mid_temp
        CP = R*(a_8 + (a_9.*T) + (a_10.*(T).^2) + (a_11.*(T).^3) + (a_12.*(T).^4));
    else
        CP = R*(a_1 + (a_2.*T) + (a_3.*(T).^2) + (a_4.*(T).^3) + (a_5.*(T).^4));
    end
end
Code Explanation for the H, S, and CP functions:
- For now, assume the terms a_1,a_2,a_3....a_14, R(Universal Gas Constant), T(Temperature values over a range), and g_mid_temp(Global Medium Temperature) are obtained from the main program which would be well explained later.
- Now, these elements are used to call the function from the main code and are also used as the inputs for these supplement function codes.
- Use if command to impart the higher temperature coefficients(a_1,a_2...a_7) for T(Temperature values) greater than the g_mid_temp(Global Medium Temperature) and lower temperature coefficients(a_8,a_9...a_14) for T(Temperature values) lesser than the g_mid_temp(Global Medium Temperature) to their respective governing equations as given above in the procedure.
- Finally, take back the Function result to the respective part(H, S, and CP) in the main code.
Now let us move to the main code and after which we can make a clear statement about the Molecular Weight function code.
Main Code/Program:
clear all
close all
clc

fnasa=fopen('THERMO.dat','r');                                             %Opening the nasa THERMO.dat file
%%
%HEADER INFORMATION:
for i=1:2                                                                  %Skipping the 1st line using for loop
    g=fgetl(fnasa);
    temp=strsplit(g,'  ');
end
c=strsplit(temp{2},' ');                                                   %Extracting the Global temperatures from 2nd line
g_low_temp=str2double(c{2});                                               %Global Low Temperature
g_mid_temp=str2double(temp{3});                                            %Global Medium Temperature
g_high_emp=str2double(temp{4});                                            %Global High Temperature

T=linspace(g_low_temp,g_high_emp,1000);                                    %Creating Temperature value range bw g_low_temp & g_high_emp
%%
for i=1:3                                                                  %Skipping the 3rd and 4th lines
    fgetl(fnasa);
end                                                                        %Setting at 5th line
for m=1:53                                                                 %[(217-5)/4]=53 number of species.
    t_sp=fgetl(fnasa);                                                     %Setting at the 1st line of every species
    t_sp_ind=strsplit(t_sp,'  ');                                          %Dividing the Temperature ranges by strsplit
    species=char(t_sp_ind(1));                                             %Obtaining the name of the species
    l=length(t_sp_ind);
    low_temp=t_sp_ind(l-3);                                                %Obtaining the Temperature ranges(In String/character type)
    mid_temp=t_sp_ind(l-2);
    high_temp=t_sp_ind(l-1);

    low_temp=str2double(low_temp);                                         %Obtaining the Temperature ranges(In Number type)
    mid_temp=str2double(mid_temp);
    high_temp=str2double(high_temp);
    %%
    %SPECIES BLOCK:
    %1st line in each individual species block contains 5 coefficients
    b=fgetl(fnasa);
    a=strfind(b,'E');
    a1=b(1: a(1)+3);
    a_1=str2double(a1);
    a2=b(a(1)+4 : a(2)+3);
    a_2=str2double(a2);
    a3=b(a(2)+4 : a(3)+3);
    a_3=str2double(a3);
    a4=b(a(3)+4 : a(4)+3);
    a_4=str2double(a4);
    a5=b(a(4)+4 : a(5)+3);
    a_5=str2double(a5);

    b=fgetl(fnasa);                                                        %passing over to next line
    %2nd line in each individual species block contains 5 coefficients:
    d=strfind(b,'E');
    a6=b(1: d(1)+3);
    a_6=str2double(a6);
    a7=b(d(1)+4 : d(2)+3);
    a_7=str2double(a7);
    a8=b(d(2)+4 : d(3)+3);
    a_8=str2double(a8);
    a9=b(d(3)+4 : d(4)+3);
    a_9=str2double(a9);
    a10=b(d(4)+4 : d(5)+3);
    a_10=str2double(a10);

    b=fgetl(fnasa);                                                        %passing over to next line
    %3rd line in each individual species block contains 4 coefficients:
    f=strfind(b,'E');
    a11=b(1: f(1)+3);
    a_11=str2double(a11);
    a12=b(f(1)+4 : f(2)+3);
    a_12=str2double(a12);
    a13=b(f(2)+4 : f(3)+3);
    a_13=str2double(a13);
    a14=b(f(3)+4 : f(4)+3);
    a_14=str2double(a14);


    %%
    %Calling out the functions for #Enthalpy #Entropy #Specific Heat:
    R=8.314;                                                               %Universal Gas Constant
    %Enthalpy:
    [H]=enthalpy(a_1,a_2,a_3,a_4,a_5,a_6,a_7,a_8,a_9,a_10,a_11,a_12,a_13,a_14,R,T,g_mid_temp);

    %Specific Heat:
    [CP]=specific_heat(a_1,a_2,a_3,a_4,a_5,a_6,a_7,a_8,a_9,a_10,a_11,a_12,a_13,a_14,R,T,g_mid_temp);

    %Entropy:
    [S]=entropy(a_1,a_2,a_3,a_4,a_5,a_6,a_7,a_8,a_9,a_10,a_11,a_12,a_13,a_14,R,T,g_mid_temp);

    %Molecular weight:
    [MW]=molecular_weight_corr(species); %added semicolon here
%%
     t=sprintf('%s',species);                                              %Just prints the species name and stores in t
     mkdir(t)                                                              %creating a directory in the name of t(species)
     cd(t)                                                                 %Going/Opening the respective directory

     %Plots:
     %Enthalpy:
     figure(1)
     plot(T,H,'LineWidth',3,'Color','r')
     xlabel('Temperature(K)')
     ylabel('Enthalpy(J)')
     grid on
     titl_H=sprintf('Enthalpy Vs Temperature of %s',species);
     title(titl_H)
     saveas(1,'Enthaply(H).jpg')

     %Entropy:
     figure(2)
     plot(T,S,'LineWidth',3,'Color','b')
     xlabel('Temperature(K)')
     ylabel('Entropy(J⋅K−1)')
     grid on
     titl_S=sprintf('Entropy Vs Temperature of %s',species);
     title(titl_S)
     saveas(2,'Entropy(S).jpg')

     %Specific Heat:
     figure(3)
     plot(T,CP,'LineWidth',3,'Color','m')
     xlabel('Temperature(K)')
     ylabel('Specific Heat(J/(kg⋅K))')
     grid on
     titl_CP=sprintf('Specific Heat Vs Temperature of %s',species);
     title(titl_CP)
     saveas(3,'Specific Heat(CP).jpg')

     cd ..
 end
Code Explanation for Main Program:
- First, we open the 'THERMO.dat' using the command fopen with reading(r) mode imparted in it.
- Then, we aim at skipping the 1st line to move on to the 2nd line in order to read the Global temperature values, for which we use the fgetl command inside a 'for' loop for i=1:2
- Now we split the elements in the line by a double space gap(' ') using the strsplit command so that we get the individual elements split from the conjoined elements from that line.
- We obtain these elements in the string format and in order to obtain the Global temperature values we must use the str2double command to convert the obtained string elements to numbers.
- Then we create a range of Temperature values from g_low_temp to g_high_emp using the linspace command having 1000 as the range in between.
- Then the next 3 lines aren't important and thus we skip those with the help of the fgetl command.
- Now we introduce a for loop for 53 individual species and then move on to the first line of the species block by imparting a fgetl command.
- Thus in this 1st line, we will be having the Species name, along with the local (high, middle, and low)temperature values at the end, and initially, we would be dividing these elements of the line by using the strsplit command and is saved to t_sp_ind.
- The 1st element occupied by t_sp_ind must be the Species name and it is taken out using the char command so that it stores it as the character element.
- Then we know that the line's 3 end elements are the local temperature values so that we impart these values by obtaining them by using the length of the elements of that line and storing them to low_temp, mid_temp, and high_temp which are primarily in the form of string and thus we convert them into numbers and save them in their respective names.
- Then we move on to the 2nd line in the species block that has by identifying the common term that is separating the values of the coefficients and identifying their position using strfind and then by using them, we accurately match the values and store them to corresponding variables.
- Similarly, we do this method for the other 2 lines, and hence all the 14 variables for each species are found out.
- Then we call out the functions for 1. Enthalpy, 2. Entropy, 3. Specific Heat, and 4. Molecular Weight respectively.
- Then we create a variable t to store all the species names using the sprintf command.
- Create a directory in the name of t(species) using the mkdir command and, Opening the respective directory using the cd command.
- Finally, we make our plots for the corresponding properties excluding Molecular weight and save them using the saveas command.
- Hence the code runs 53 times and for each time, it happens to move to a new species workspace.
Function Code of Molecular Weight:
function [MW]=molecular_weight_corr(species)
atom=['H','O','N','A','C'];
atomic_weight=[1.007,15.999,14.0067,39.943,12.0107];
MW=0;
for i=1:length(species)
    for j=1:length(atom)
        if strcmp(species(i),atom(j))
            MW=MW+atomic_weight(j);
            p=j;
        end
    end

    n = str2double(species(i));
    if n>1
        MW=MW+(atomic_weight(p)*(n-1));
    end
end
sprintf('%s species %s is %f ',species,'molecular_mass',MW)
end
Code Explanation:
- In this function code, we impart the name of the species from the main program as the input.
- We designate the base chemical constituents of Hydrogen, Oxygen, Nitrogen, Argon, and Carbon as ['H', 'O',' N', 'A', 'C'] to the variable named atom.
- For these corresponding constituents, we also give the value of [1.007,15.999,14.0067,39.943,12.0107] equated to the variable named atomic_weight.
- Now define/equate the molecular weight as zero.
- Now use two conditional for loops, one for the condition of i=1:length(species) and another for the condition of j=1:length(atom).
- Inside the 2 for loops, we firstly check for the condition of equity between the 1st letter of Species name and all the constituents of the atom variable using the command called strcmp and if it is so, then we must imply the command of, MW=MW+atomic_weight(j) so that atomic weight of the matched constituent of the atom variable is accounted, and if this if condition is satisfied, we will save the corresponding j value to p.
- "What if there are double or triple constituents like O2, H2O, and NH3? ", so for this question to be answered, we have introduced a term n that converts all the elements of the species into numbers using the str2double command.
- If it is an alphabetical string, the command cannot convert them and it results as NaN(Not a Number), thus we incorporate an if condition that allows only if n>1, and the command is given as, MW=MW+(atomic_weight(p)*(n-1)) which seems to be more logical when calculating the molecular weight.
- At last, an additional command using printf is imparted to create the statement regarding the Molecular weight for each species to get printed at the command window.
Results:
Screenshot of the window where all the folders are saved:

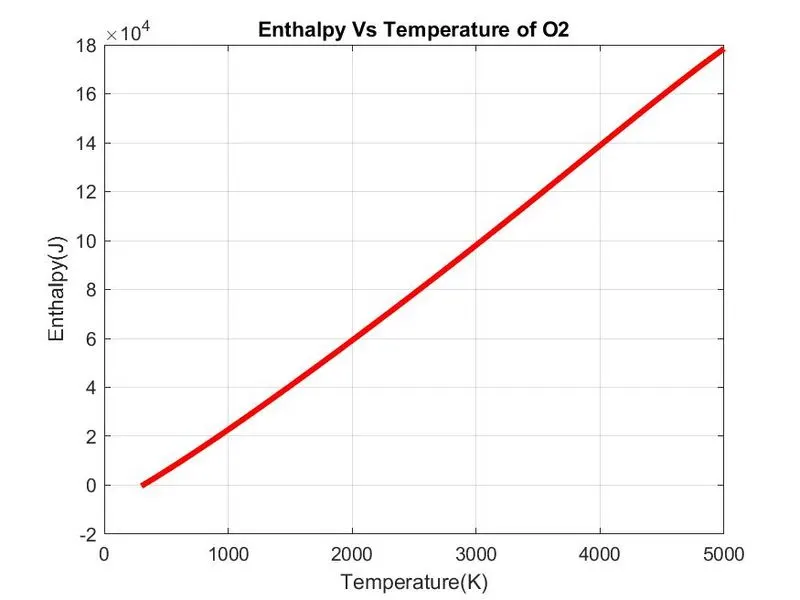
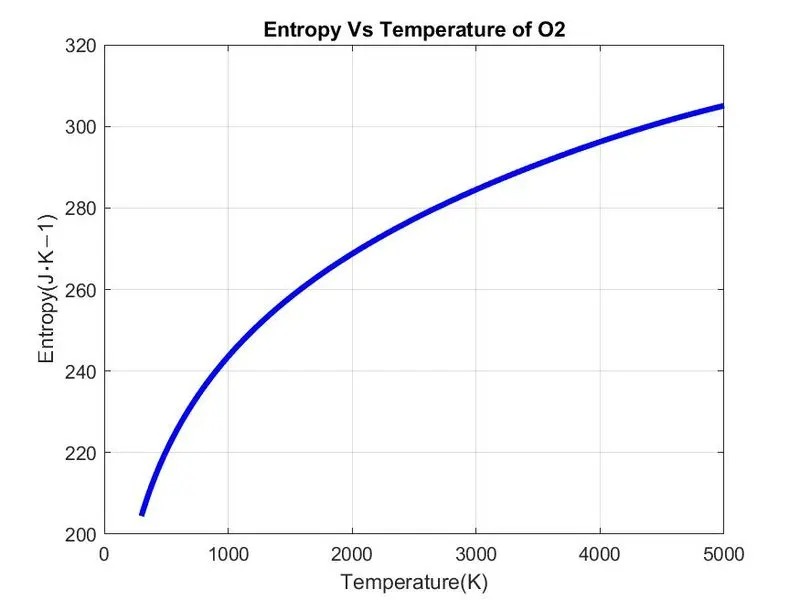
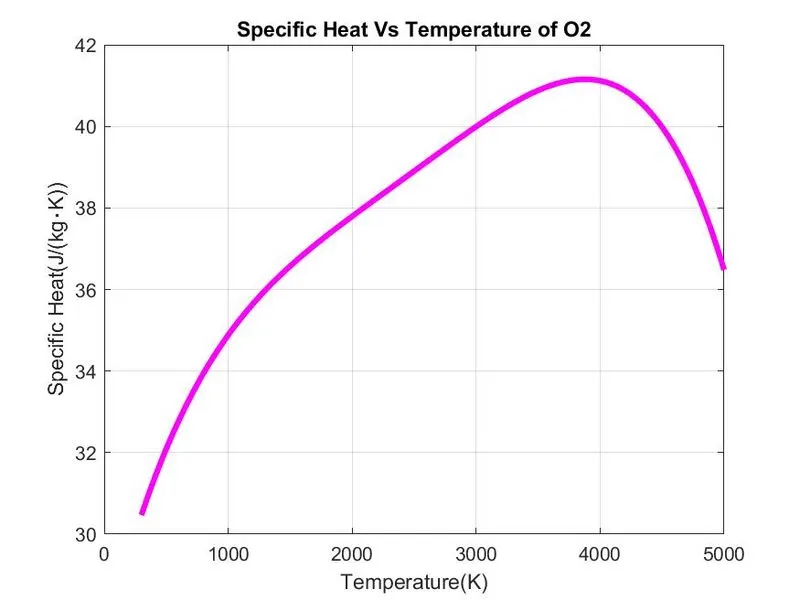
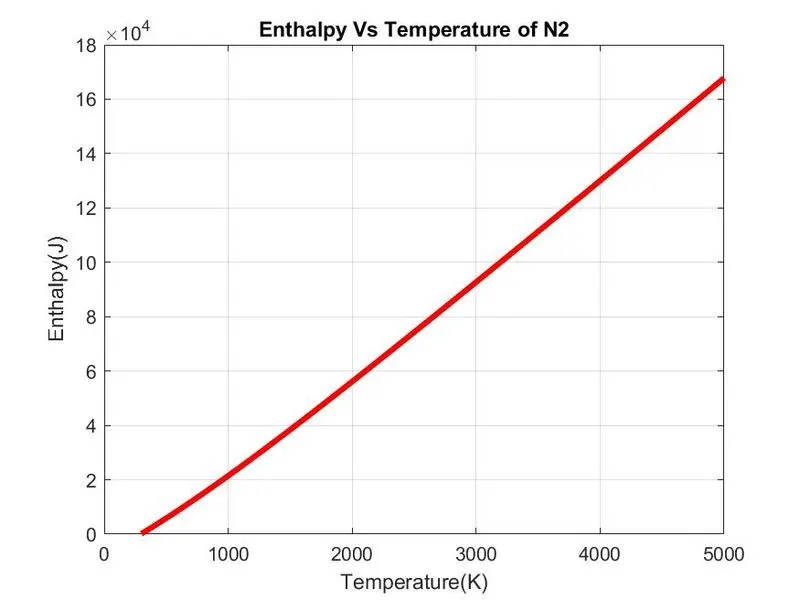
Plots for O2, N2, and CO2 species:
O2 species:
Enthalpy Vs Temperature Plot:
Entropy Vs Temperature Plot:
Specific Heat Vs Temperature Plot:
N2 species:
Enthalpy Vs Temperature Plot:
Entropy Vs Temperature Plot:
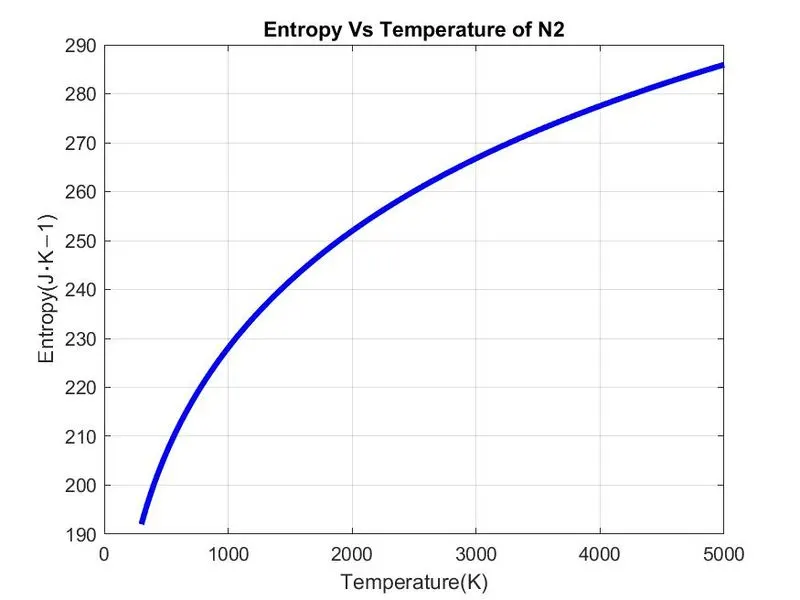
Specific Heat Vs Temperature Plot:
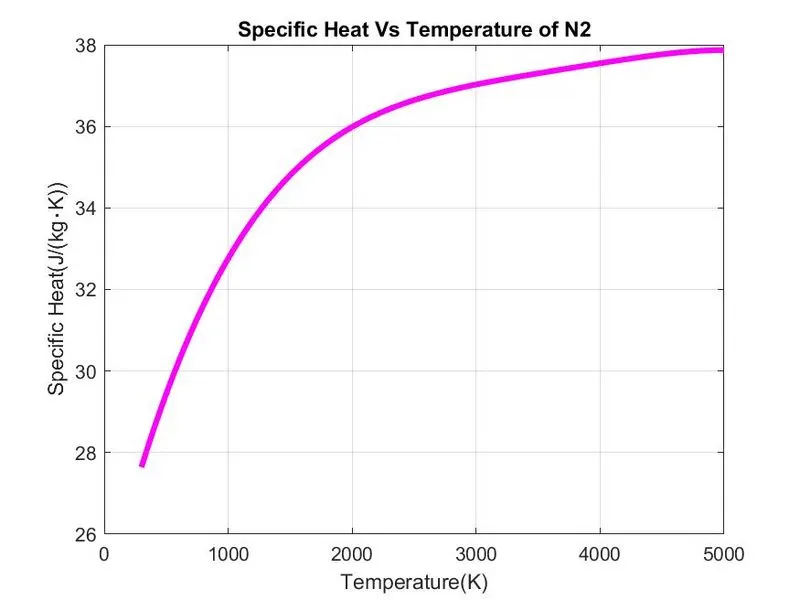
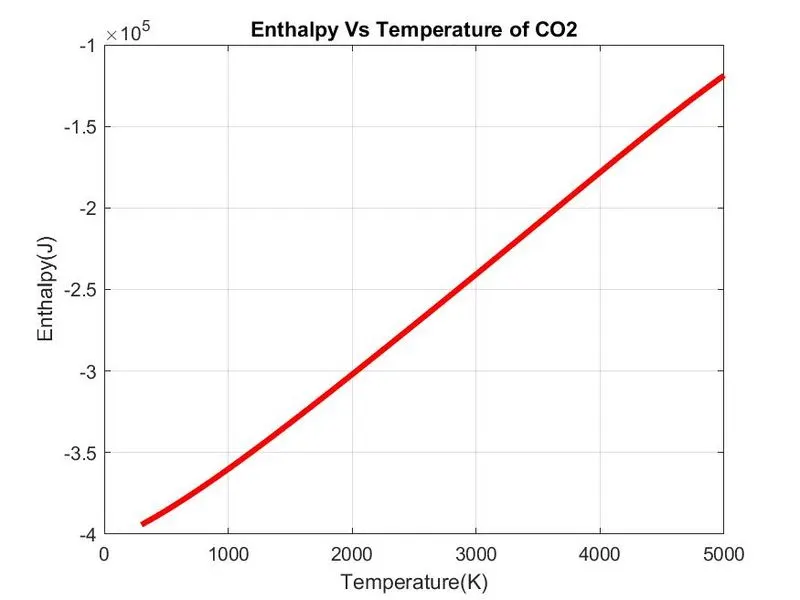
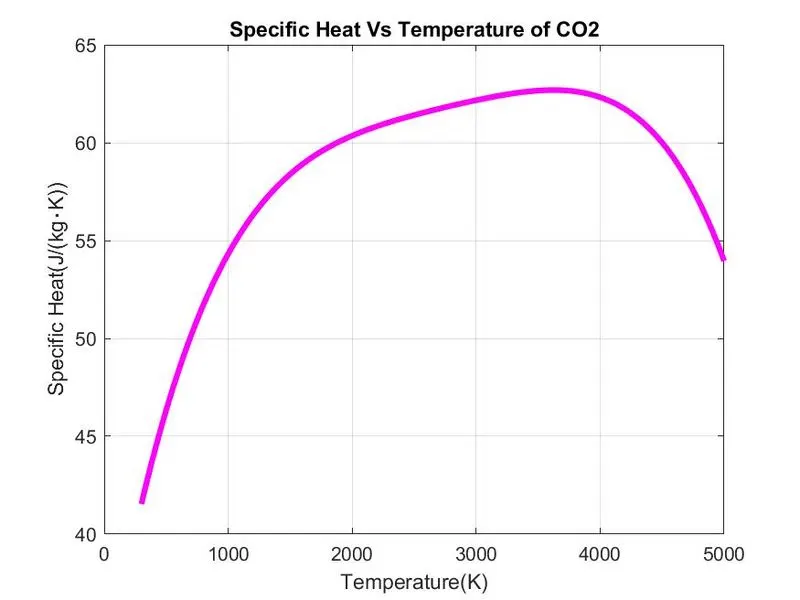
CO2 species:
Enthalpy Vs Temperature Plot:
Entropy Vs Temperature Plot:
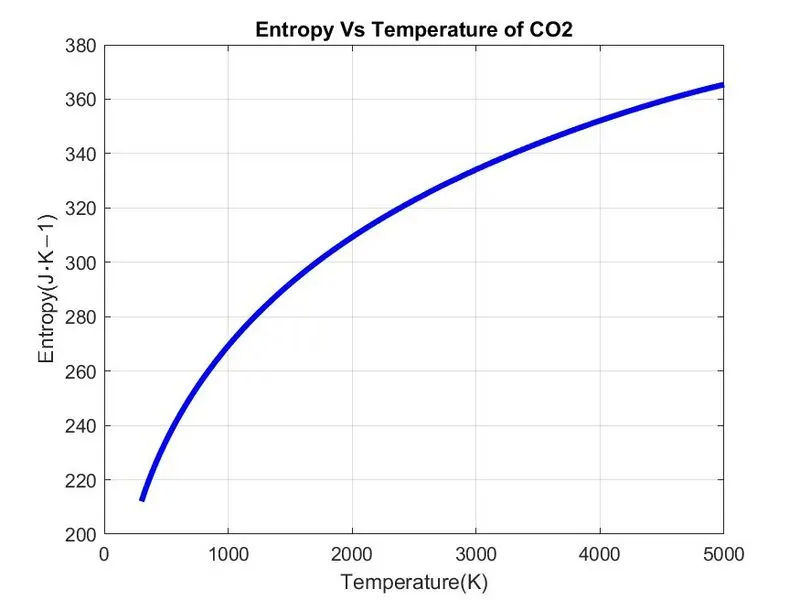
Specific Heat Vs Temperature Plot:
Molecular weight of each species in the command window:







Conclusion:
Thus using the File parsing method, we have successfully collected Nasa's thermodynamic data from their data file and hence also performed certain functions to plot the characteristics of the properties with respect to the temperature range with the help of the values from the data file.