Project 1 - Parsing NASA thermodynamic data
AIM: To write a code in MATLAB to parse the NASA thermodynamic data file and then calculate the thermodynamic properties of various gas species.
OBJECTIVE:
1. Write a function that extracts the 14 co-efficients and calculates the enthalpy, entropy and specific heats for all the species in the data file.
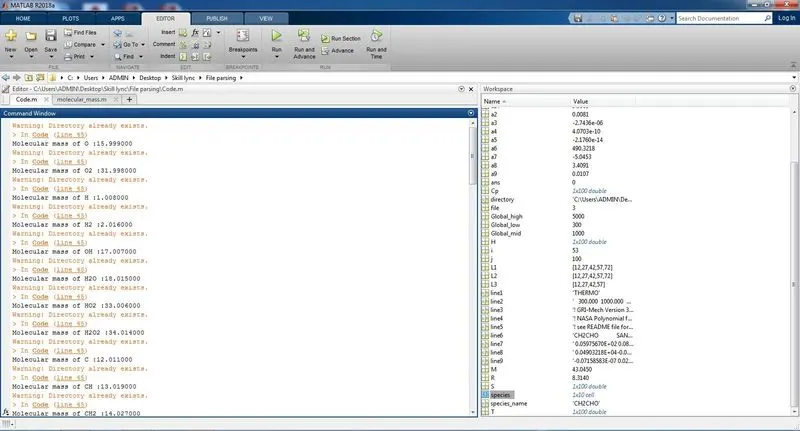
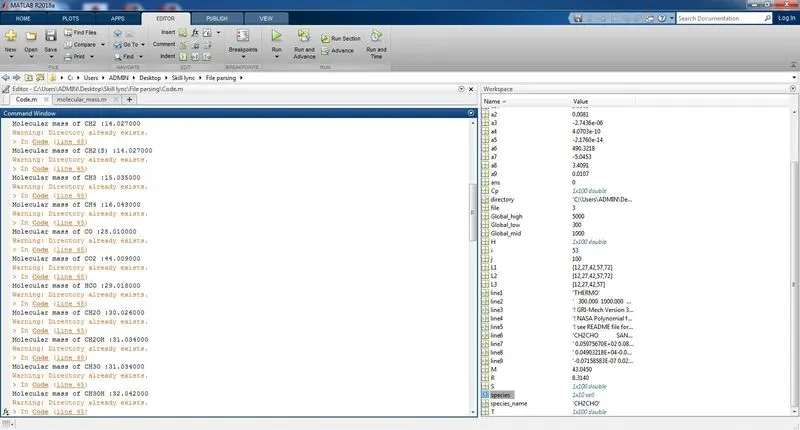
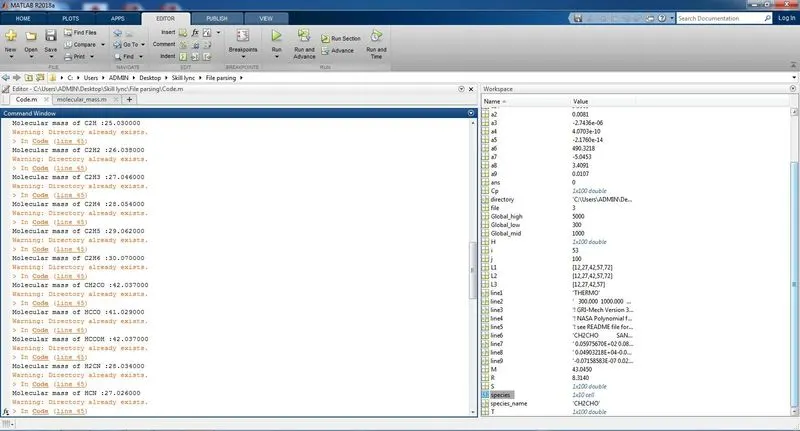
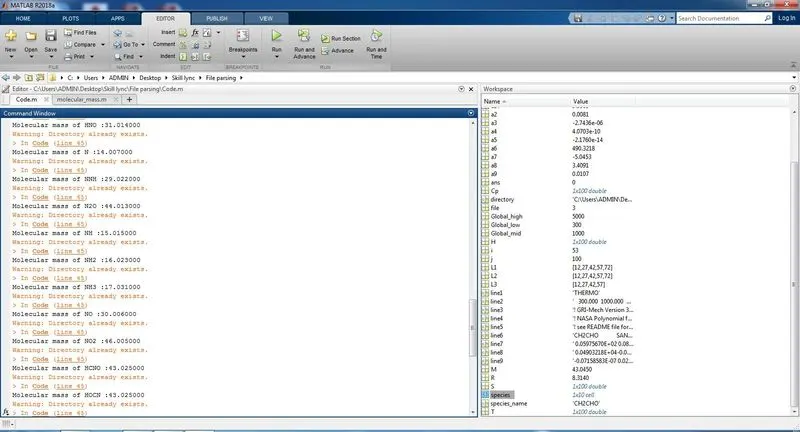
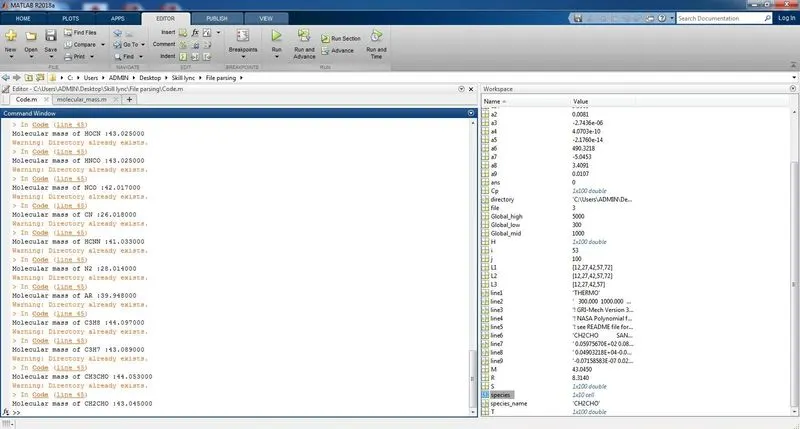
2. Calculate the molecular weight of each species and display it in the command window.
3. Plot the Cp, Enthalpy and Entropy for the local temperature range (low temperature : high temperature) specific for each species.
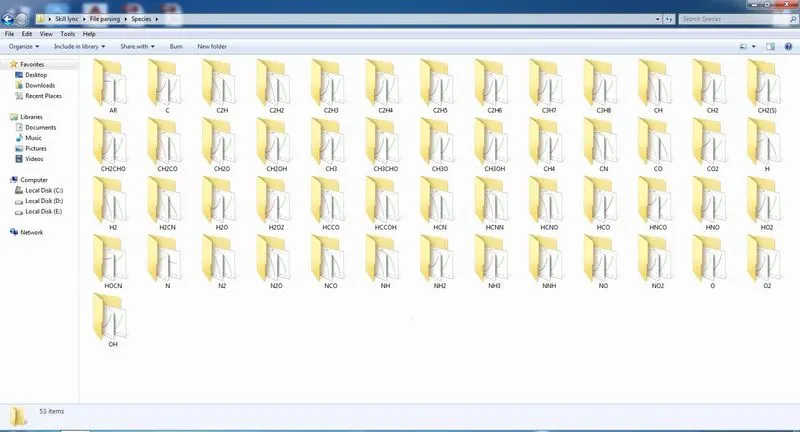
4. Save the plots as images with appropriate names and dump them in separate folders for each species with suitable name. All these should be generated automatically.
5. The main program has to take the "THERMO.dat" file as an input and generate Cp, H and S plots.
6. Screenshot of the window where all the folders are saved.
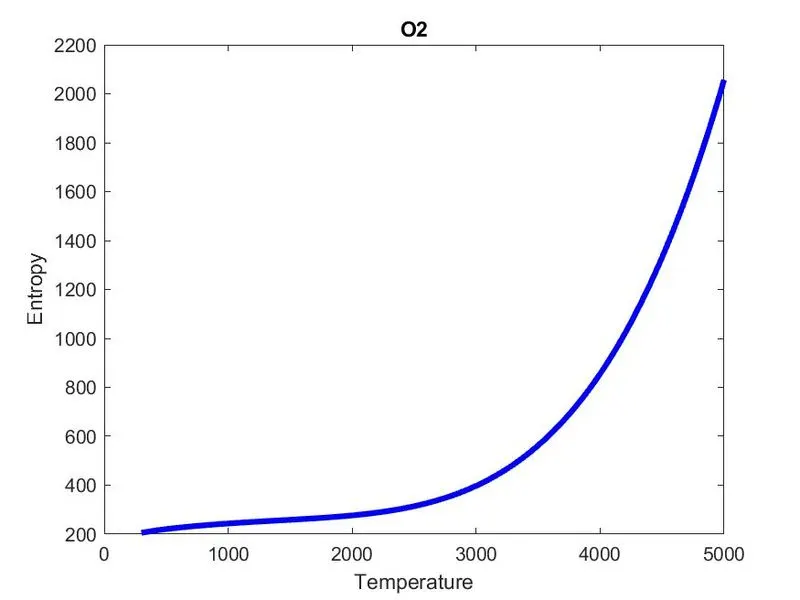
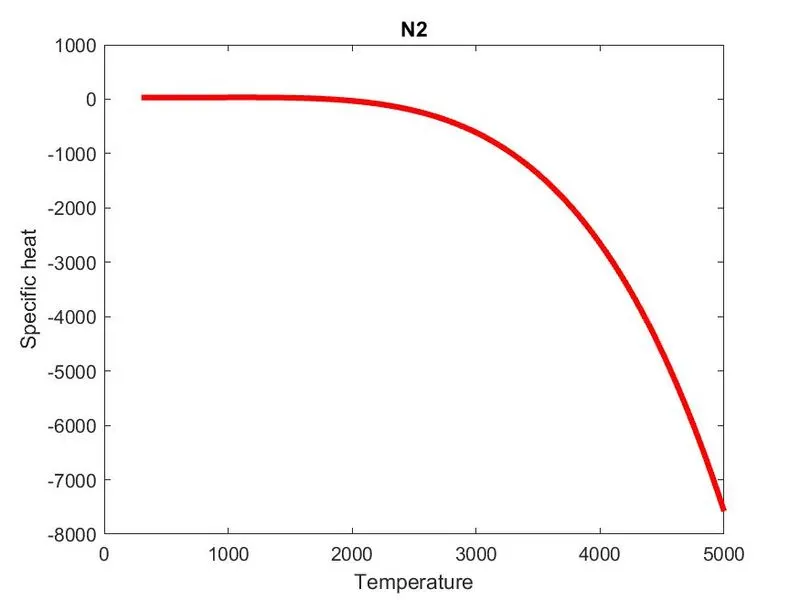
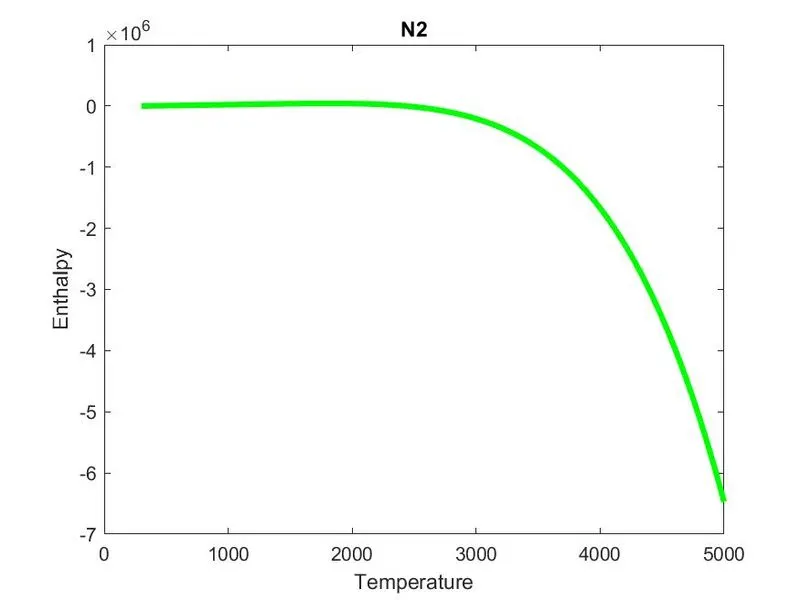
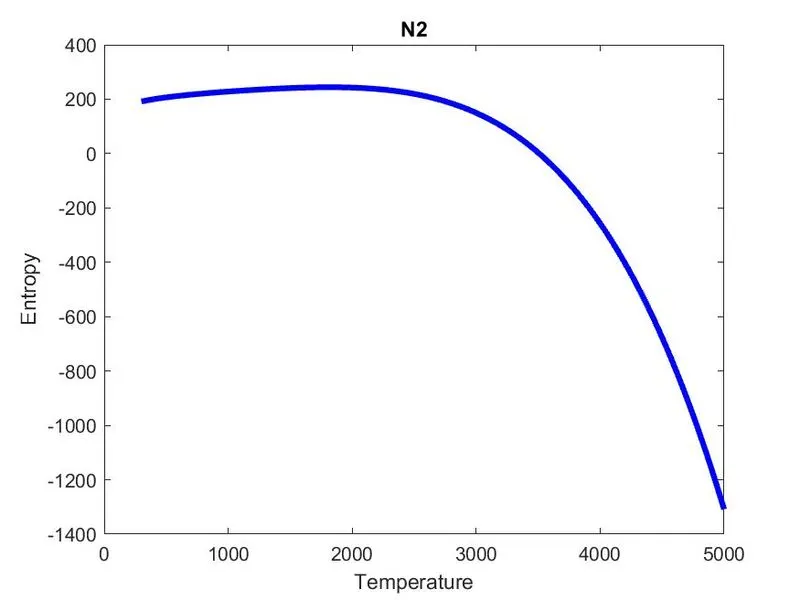
7. Plots for o2, N2 and Co2 species.
THEORY:
File parsing is the process of analyzing a string of symbols, either in natural language, computer languages or data structures, conforming to the rules.
FORMULA USED:
The formula used to calculate the thermodynamic properties is as below:

Here 'R' is the universal gas constant and 'T" is the temperature.
MATLAB CODE:
close all
clc

file = fopen('THERMO.dat','r');
line1 = fgetl(file);
line2 = fgetl(file);
A = strsplit(line2,' ');
Global_low = str2double(A{2});
Global_mid = str2double(A{3});
Global_high = str2double(A{4});

R=8.314;

line3 = fgetl(file);
line4 = fgetl(file);
line5 = fgetl(file);

for i = 1:53
line6 = fgetl(file);
species = strsplit(line6,' ');
species_name = (species{1});
line7 = fgetl(file);
L1 = strfind(line7,'E');
a1 = str2double(line7(1:(L1(1)+3)));
a2 = str2double(line7((L1(1)+4):(L1(2)+3)));
a3 = str2double(line7((L1(2)+4):(L1(3)+3)));
a4 = str2double(line7((L1(3)+4):(L1(4)+3)));
a5 = str2double(line7((L1(4)+4):(L1(5)+3)));

line8 = fgetl(file);
L2 = strfind(line8,'E');
a6 = str2double(line8(1:(L2(1)+3)));
a7 = str2double(line8((L2(1)+4):(L2(2)+3)));
a8 = str2double(line8((L2(2)+4):(L2(3)+3)));
a9 = str2double(line8((L2(3)+4):(L2(4)+3)));
a10 = str2double(line8((L2(4)+4):(L2(5)+3)));

line9 = fgetl(file);
L3 = strfind(line9,'E');
a11 = str2double(line9(1:(L3(1)+3)));
a12 = str2double(line9((L3(1)+4):(L3(2)+3)));
a13 = str2double(line9((L3(2)+4):(L3(3)+3)));
a14 = str2double(line9((L3(3)+4):(L3(4)+3)));

mkdir(['C:\Users\ADMIN\Desktop\Skill lync\File parsing\Species\',species_name])

T = linspace(300,5000,100);

for j=1:length(T)
    if T(j)<3000
        Cp = (a1 + a2.*T + a3.*T.^2 + a4.*T.^3 + a5.*T.^4).*R;
        H = (a1 + (a2.*T)./2 + (a3.*T.^2)./3 + (a4.*T.^3)./4 + (a5.*T.^4)./5 + (a6./T)).*R.*T;
        S = ((a1.*log(T)) + (a2.*T) + (a3.*T.^2)./2 + (a4.*T.^3)./3 + (a5.*T.^4)./4 + a7).*R;
    else
        Cp = (a8 + a9.*T + a10.*T.^2 + a11.*T.^3 + a12.*T.^4).*R;
        H = (a8 + (a9.*T)./2 + (a10.*T.^2)./3 + (a11.*T.^3)./4 + (a12.*T.^4)./5 + (a13./T)).*R.*T;
        S = ((a8.*log(T)) + (a9.*T) + (a10.*T.^2)./2 + (a11.*T.^3)./3 + (a12.*T.^4)./4 + a14).*R;
    end
end

figure(1)
plot(T,S,'linewidth',3,'color','b');
title(species_name);
xlabel('Temperature');
ylabel('Entropy');

figure(2)
plot(T,H,'linewidth',3,'color','g');
title(species_name);
xlabel('Temperature');
ylabel('Enthalpy');

figure(3)
plot(T,Cp,'linewidth',3,'color','r');
title(species_name);
xlabel('Temperature');
ylabel('Specific heat');

directory = (['C:\Users\ADMIN\Desktop\Skill lync\File parsing\Species\',species_name]);
cd(directory)

saveas(1,'Entropy.jpg');
saveas(2,'Enthalpy.jpg');
saveas(3,'Specific heat.jpg');

cd('C:\Users\ADMIN\Desktop\Skill lync\File parsing\')
M = molecular_mass(species_name);
end

fclose(file);
FUNCTION CODE
function M = molecular_mass(species_name)
atomic_name = ['H','C','O','N','A'];
atomic_weight = [1.008 12.011 15.999 14.007 39.948];
M=0;
for i=1:length(species_name)
  for j=1:length(atomic_name)
      if strcmp (species_name(i),atomic_name(j))
          M = M + atomic_weight(j);
          Position = j;
      end
  end
  n = str2double(species_name(i));
  if n>1
      M = M + atomic_weight(Position)*(n-1);
  end
end
  fprintf('Molecular mass of %s :',species_name);
  fprintf('%f',M);
  disp(' ')
end
EXPLANATION OF THE CODE:
- First step is to open the data file (‘THERMO.dat’) using the fopen command and read the same using ‘r’ command.
- The data from the lines are extracted using fgetl command.
- Each time we use fgetl command, we get the successive lines accordingly.
- By using the fgetl command five times, we get the first five lines (i.e. title, global temperature and comments) from the data file.
- The first line is title. Whereas the 3rd,4th and 5th line is just comments which can be ignored as it doesn’t have any valuable data which can be used for calculation.
- Now the global temperature (2nd line) is extracted separately using strsplit() command and to convert the string to number str2num() command is used.
- The value of universal gas constant (R=8.314 J/mol-K) is defined.
- Now the 14 co-efficients (a1 to a14) is extracted from the data file needs to be extracted.
- Each species has three lines in which the co-efficient values are defined. The same pattern continues for all the species. Hence for loop can be used.
- The species name is extracted using fgetl and strsplit() command.
- By using strfind() command, the exponential ‘E’ is found out and required logic is applied so that we get the first value i.e. a1. Then it is converted to number using str2num() command.
- Similarly a2 to a14 is extracted.
- The co-efficients for all the other 52 species has to be extracted in the same way. Hence ‘for loop’ is used to do the same.
- The temperature is defined using linspace command (300 to 5000).
- Once the co-efficients is obtained, the specific heat, enthalpy and entropy is calculated by using the formula which is provided.
- The first 7 co-efficients i.e. a1 to a7 are used for high temperature co-efficients calculation and a8 to a14 are used for low temperature co-efficients calculation.
- Hence if-else statement command is used in calculation.
- Once the specific heat, enthalpy and entropy is calculated for all the species, the graph of temperature v/s specific heat, temperature v/s enthalpy and temperature v/s entropy is plotted.
- For each species we get three different graphs as mentioned above. The obtained graphs are saved as an image file in a particular folder.
- The images are saved using saveas() command.
- For each species an individual folder is created using mkdir() command.
- To change the directory we use cd command.
- The molecular weight for all the species are calculated using a separate function and the results are displayed in the command window.
- In the function code, the array for the atoms and respective atomic weights of the same are defined.
- Now the input string is compared with character array using strcmp() command and when a match occurs the associated atomic weights are taken.
- For species having numbers defining the number of atoms, the number is extracted first and it is multiplied with atomic weights.
- Now the for loop command is terminated using end command.
- Also the open files are closed using fclose command.
ERRORS FACED DURING PROGRAMMING:
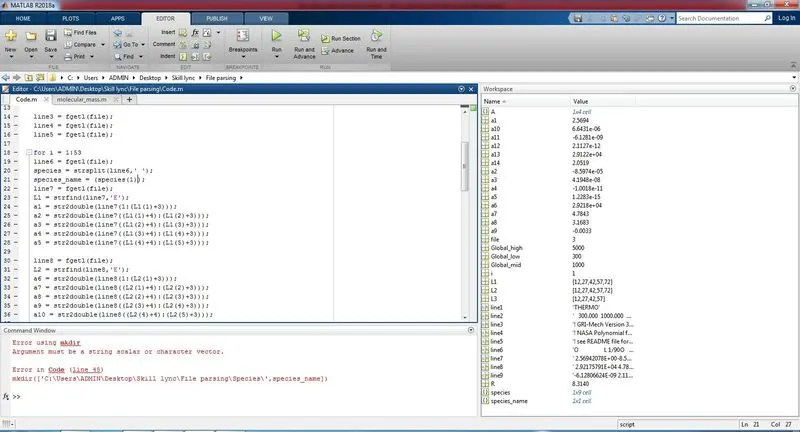
1. Normal bracket was used instead of curly bracket hence this error occurred. After using the bracket correctly the error was resolved.
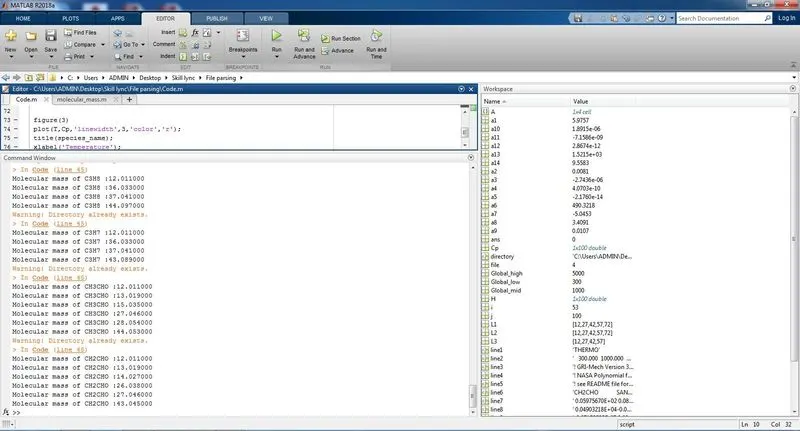
2. This is not exactly an error but the desired result was not getting properly. The molecular mass of the species was getting looped. This was due to wrong placement of statement in for loop. The same was resolved after correction.
RESULTS:
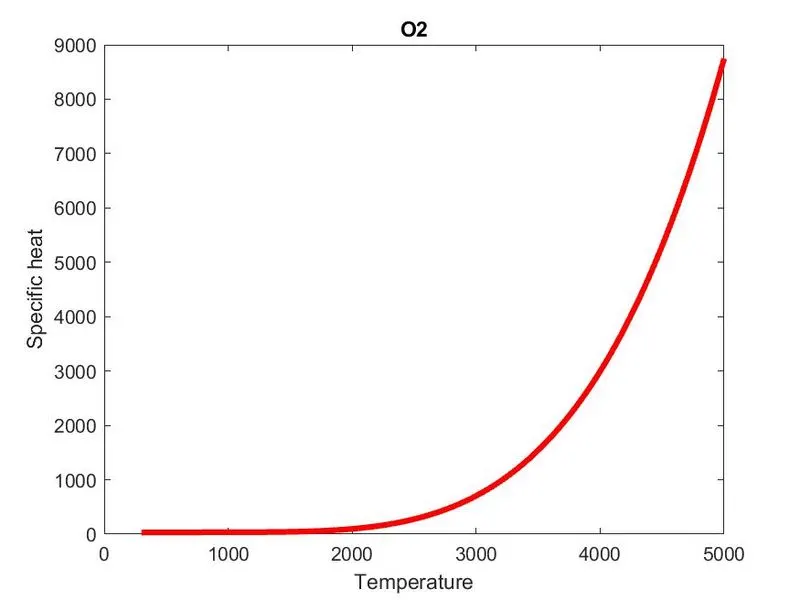
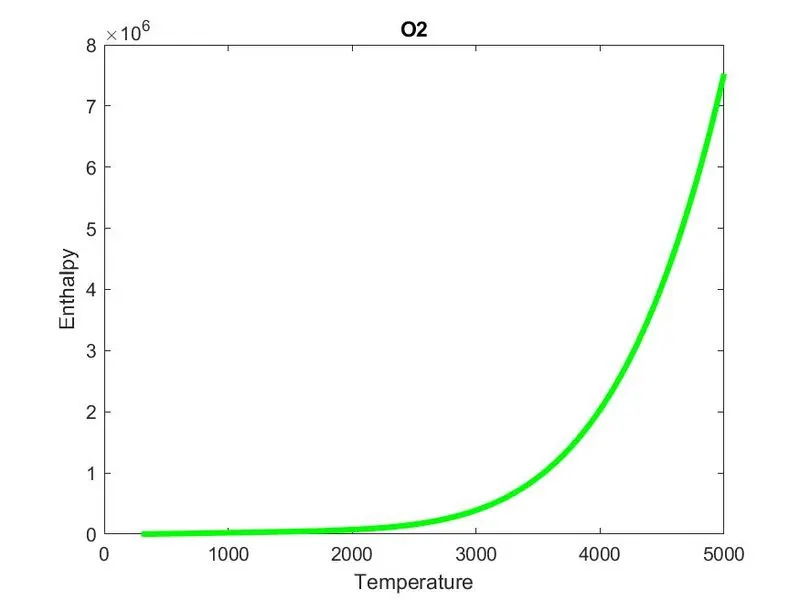
1. Plots for O2
2. Plots for N2
3. Plots for CO2
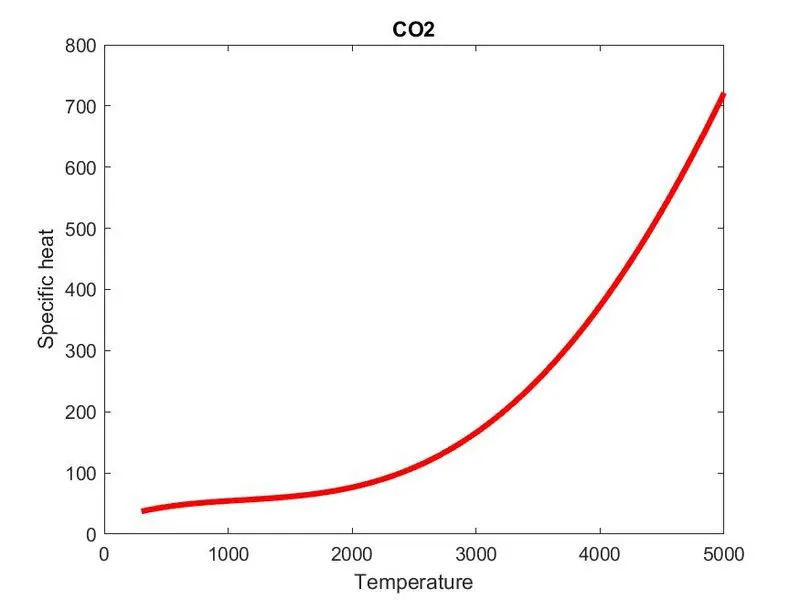
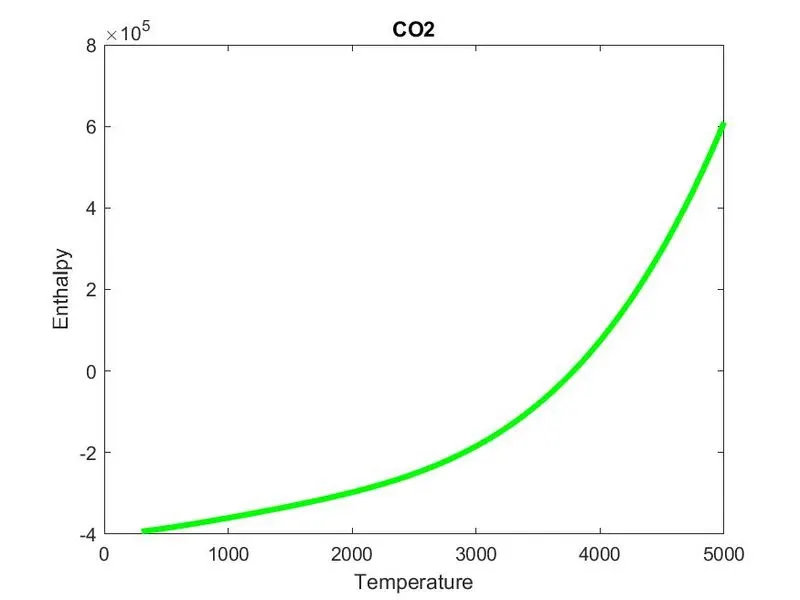
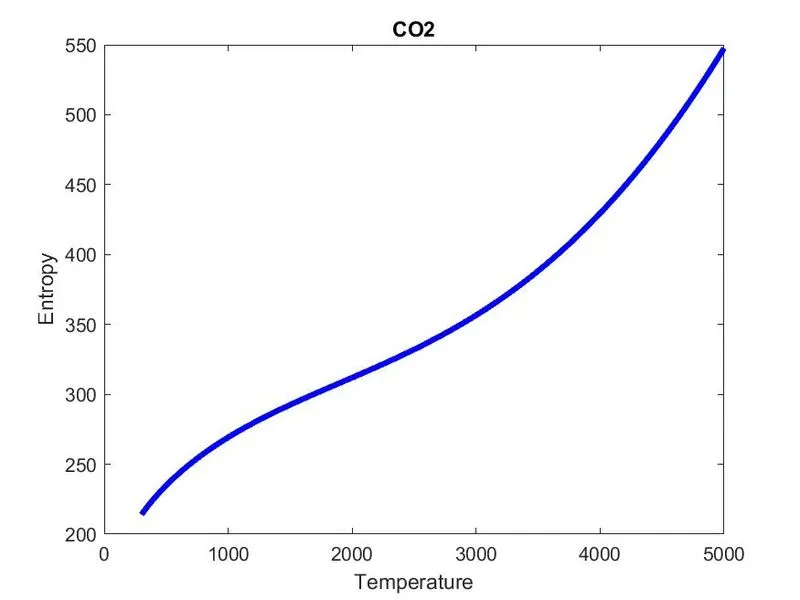
Screenshot of the folders for the species
Molecular mass of the species shown in command window
REFERENCES:
https://en.wikipedia.org/wiki/Parsing
https://in.mathworks.com/matlabcentral/answers/472084-how-to-parse-text-data
https://in.mathworks.com/matlabcentral/answers/30197-data-parsing