Project 1 - Parsing NASA thermodynamic data
% Theory
-THERMO.dat file is imported to the program by using 'fopen' command and each and every line is read by using fgetl command.
-in second line by using fgetl command we also read the line and after that obtain the temperature ranges by using the code 'strsplit'
-now obtain the global min, max, and med temp ranges. use 'str2num' character array to numeric array.
-Then create a vector of 400 evenly spaced temperature points using 'linspace' command and provide universal gas constant value.
-3rd,4th,5th lines in the data are comments.use 'fgetl' again for reading those 3 lines.
-form line '6' to lines '218', there are a set of 4 lines of data.
-line 1 - I have read line '6' using 'fgetl' and stored it in line 1 variable.
-i have used 'strtok' command to get the selected parts of the string.
-line 2- i have read line'7' using 'fgetl' and stored it in the line 2 variable.
--use 'strfind' command to find the places of 'E' in line 7,'stsfind' is used to find string within other strings. Now stored them in an array named 'A'
-Similarly, follow these steps for the next 2lines. Then you will get A, B, C arrays respectively.
-Now, extract all the coefficients (a1,a2,a3,a4,a5,a6,a7,b1,b2,b3,b4,b5,b6,b7)using 'str2num' command.
-All these processes should be done again for line 7 to line 212. therefore, I have created a 'for-loop for all the 53 species.
function [s] = entropy(a1,a2,a3,a4,a5,a6,a7,b1,b2,b3,b4,b5,b7,T,R,globle_mid_temp)
% here we calculating the entropy values
if T > globle_mid_temp
s = R.*(a1*log(T)+a2.*T+((a3.*T.^2)./2)+((a4.*T.^3)./3)+((a5.*T^4)./4)+a7);
else
 s = R.*(b1*log(T)+b2.*T+((b3.*T.^2)./2)+((b4.*T.^3)./3)+((b5.*T.^4)./4)+b7);

end


function [h] = enthalpy(a1,a2,a3,a4,a5,a6,a7,b1,b2,b3,b4,b5,b6,T,R,globle_mid_temp)
% here we find enthalpy
if T >= globle_mid_temp
h = R.*T.*(a1+((a2.*T)./2)+((a3.*T.^2)./3)+((a4.*T.^3)./4)+((a5.*T.^4)./5)+(a6./T));

else h = R.*T.*(b1+((b2.*T)./2)+((b3.*T.^2)./3)+((b4.*T.^3)./4)+((b5.*T.^4)./5)+(b6./T));
end


   % specific heat function
    function Cp =sp_heat(a1,a2,a3,a4,a5,a6,a7,b1,b2,b3,b4,b5,T,R,globle_mid_temp);
     if T > globle_mid_temp

    Cp = R.*(a1+a2.*T+a3.*T.^2+a4.*T.^3+a5.*T.^4);
    else
            Cp = R.*(b1+b2.*T+b3.*T.^2+b4.*T.^3+b5.*T.^4);

    end


clear all
close all
clc

f3 = fopen('THERMO.dat','r');
first_line = fgetl(f3); % reading the first line from data


% obtaining the globle min,maxand medium temperatures
globle_temp = fgetl(f3); % reading 2nd line from data
temp_range = strsplit(globle_temp,' '); % spliting 2nd line using blank space as a delimeters
%ontaining temperature value from splitted data
globle_min_temp = str2num(temp_range{2});
globle_mid_temp = str2num(temp_range{3});
globle_high_temp = str2num(temp_range{4});

% create a vector of 400 evenly spaced temperature points
T = linspace(globle_min_temp,globle_high_temp,400);
R = 8.314
comments1 = fgetl(f3);
comments2 = fgetl(f3);
comments3 = fgetl(f3);

for i = 1:53
    line1 = fgetl(f3);
    element_name = strtok(line1);
    line2 = fgetl(f3);
    A = strfind(line2,'E');
    line3 = fgetl(f3);
    B = strfind(line3,'E');
    line4 = fgetl(f3);
    C = strfind(line4,'E');

    a1 = str2num(line2(1:A(1)+3));
    a2 = str2num(line2(A(1)+4:A(2)+3));
    a3 = str2num(line2(A(2)+4:A(3)+3));
    a4 = str2num(line2(A(3)+4:A(4)+3));
    a5 = str2num(line2(A(4)+4:A(5)+3));

    a6 = str2num(line3(1:B(1)+3));
    a7 = str2num(line3(B(1)+4:B(2)+3));
    b1 = str2num(line3(B(2)+4:B(3)+3));
    b2 = str2num(line3(B(3)+4:B(4)+3));
    b3 = str2num(line3(B(4)+4:B(5)+3));

    b4 = str2num(line4(1:C(1)+3));
    b5 = str2num(line4(C(1)+4:C(2)+3));
    b6 = str2num(line4(C(2)+4:C(3)+3));
    b7 = str2num(line4(C(3)+4:C(4)+3));

    % specific heat
   Cp = sp_heat(a1,a2,a3,a4,a5,a6,a7,b1,b2,b3,b4,b5,T,R,globle_mid_temp);
   %enthalpy
   h = enthalpy(a1,a2,a3,a4,a5,a6,a7,b1,b2,b3,b4,b5,b6,T,R,globle_mid_temp);
   % entorpy
   s = entropy(a1,a2,a3,a4,a5,a6,a7,b1,b2,b3,b4,b5,b7,T,R,globle_mid_temp);


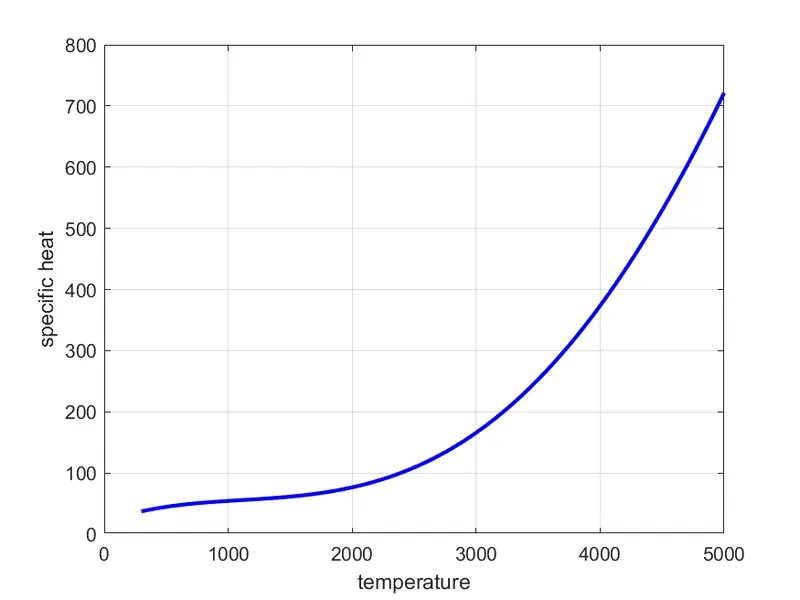
  figure(1)
   plot(T,Cp,'linewidth',2,'color','b');
   grid on
   xlabel('temperature');
   ylabel('specific heat');

   figure(2)
   plot(T,h,'linewidth',2,'color','y');
   grid on
   xlabel('temperature');
   ylabel('enthalpy');


   figure(3)
   plot(T,s,'linewidth',2,'color','r');
   grid on
   xlabel('temperature');
   ylabel('entropy');

   pause(0.0001)

 exist mkdir('C:\Users\chait\OneDrive\Desktop\file parcing',element_name)
   cd(element_name)
   saveas(figure(1),'sp_heat.png');
   saveas(figure(2),'enthalpy.png');
   saveas(figure(3),'entropy.png');
   cd('C:\Users\chait\OneDrive\Desktop\file parcing')


    % calculating moleculer weight
  atoms = ('H''C''O''N''A');
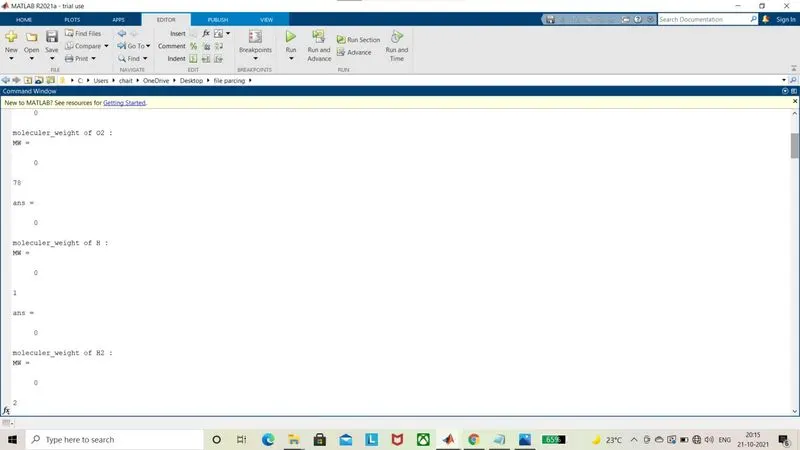
fprintf('moleculer_weight of ');
fprintf(element_name);
fprintf(' : ')

atomic_weight = [ 1 12 15 14 39];
MW = 0

for i = 1:length(element_name);
    for j= 1:length(atoms);
        if strcmp(element_name(i),atoms(j))
          MW = MW + atomic_weight(j);
            position = j;
        end
    end
    n = str2num(element_name(i));
    if n>1;
          MW = MW + atomic_weight(position)*(n-1);

    end
end
fprintf('%d',MW);
disp(' ');

sprintf('moleculer weight of %s:%f ',element_name,MW);


end

fclose(f3)
% Plots of O2
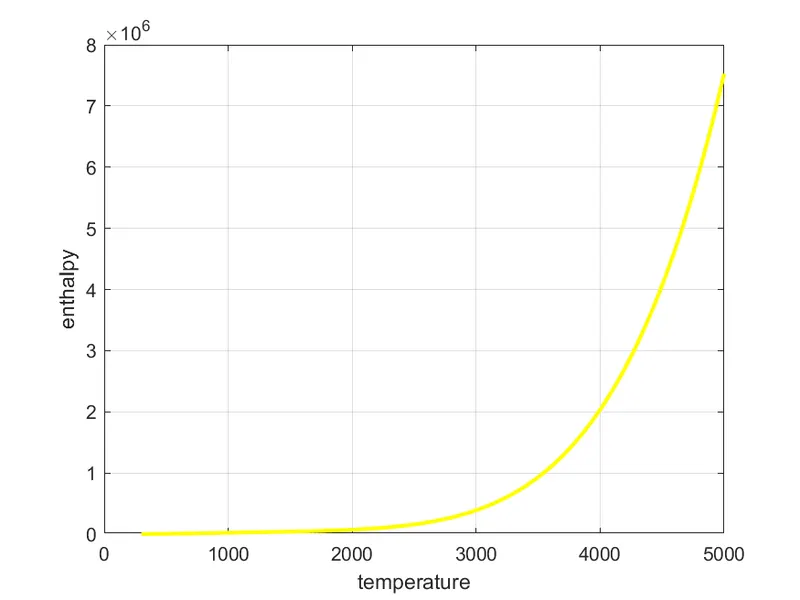
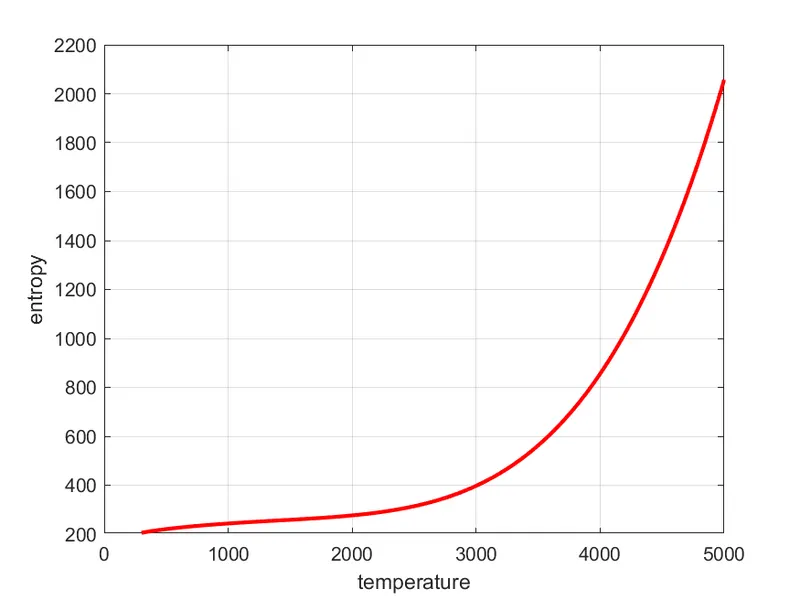
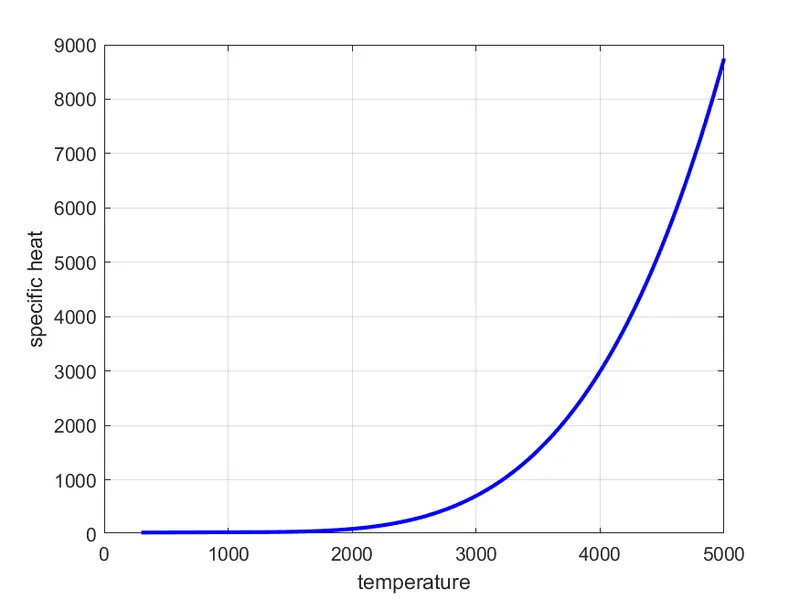
% Plots of N2
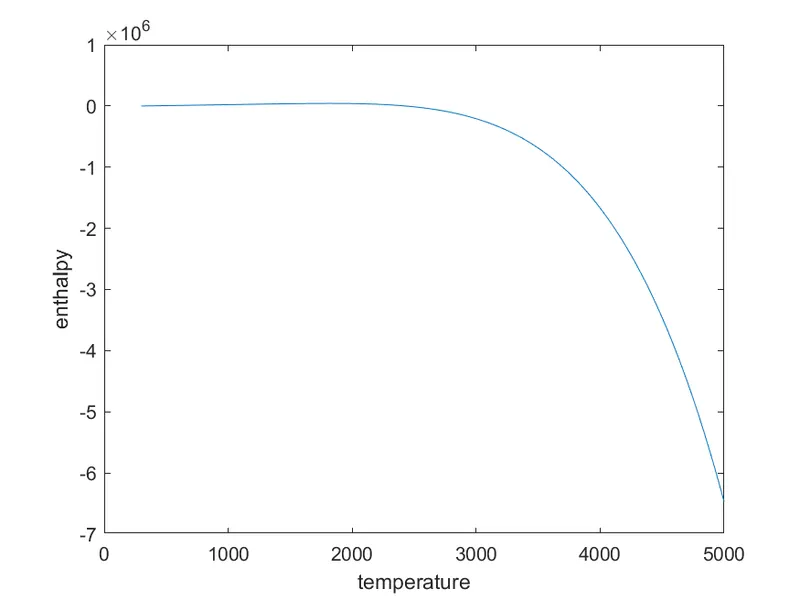
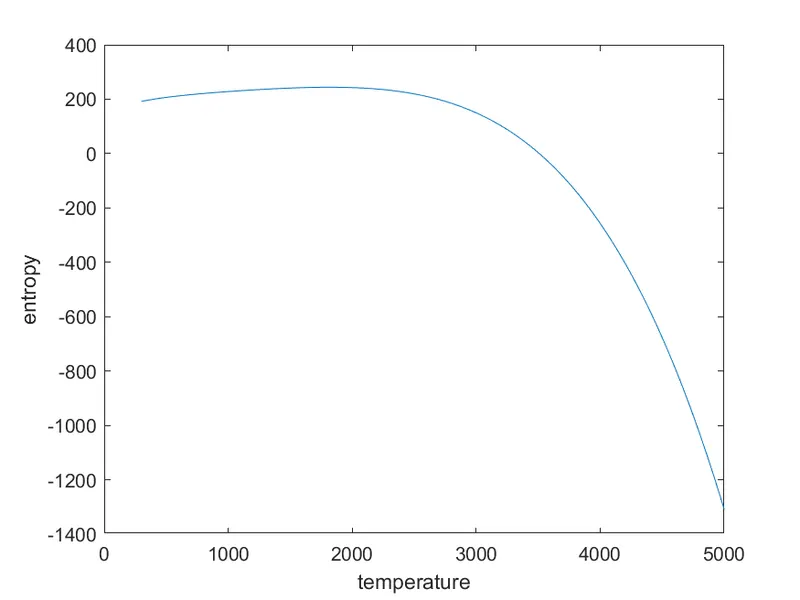
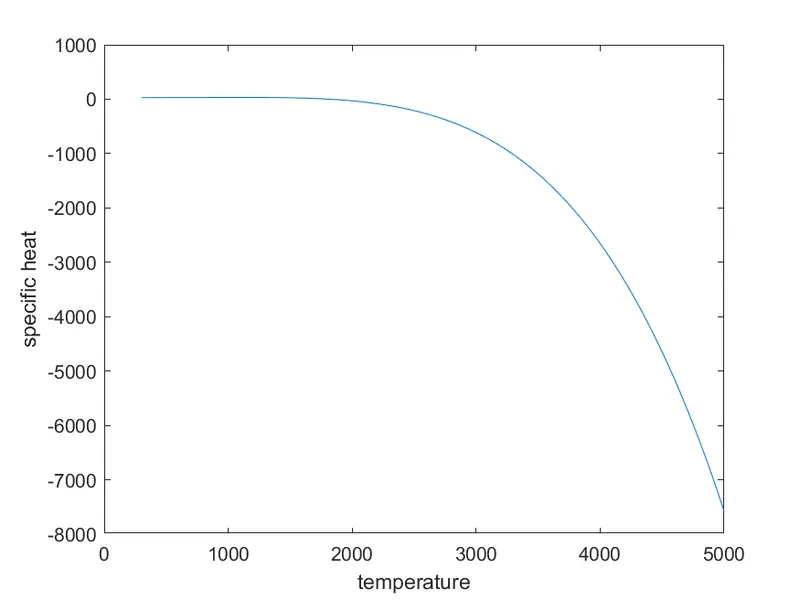
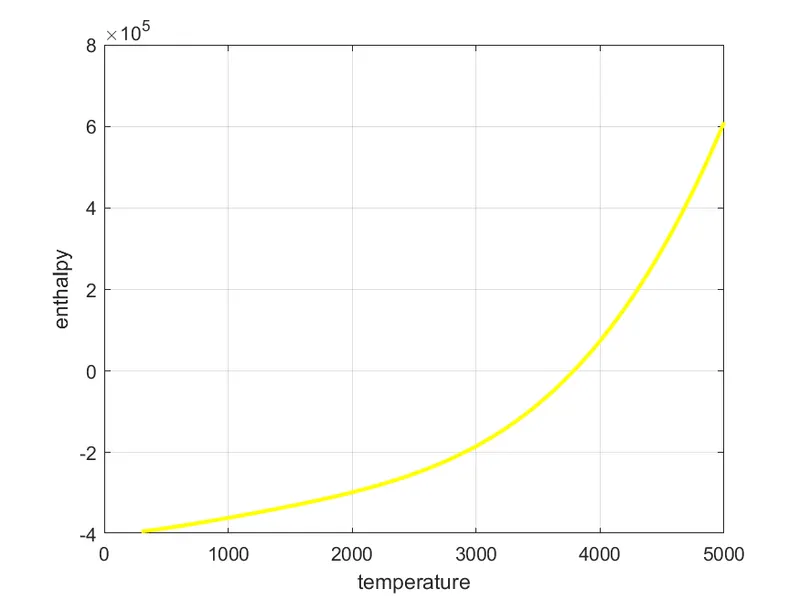
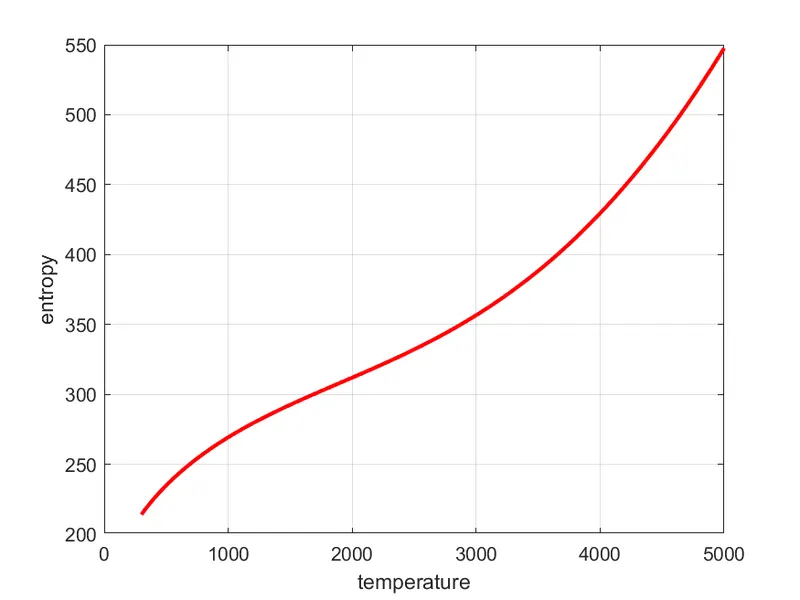
% Plots of CO2
% Screenshot of Command Window
% file derectory