Project - Parsing NASA thermodynamic data
AIM: To write a program in MATLAB to parse the NASA thermodynamic data.
OBJECTIVE:
- Write a function that extracts the 14 coefficients and calculate the enthalpy, entropy and specific heats for all the species in the data file.
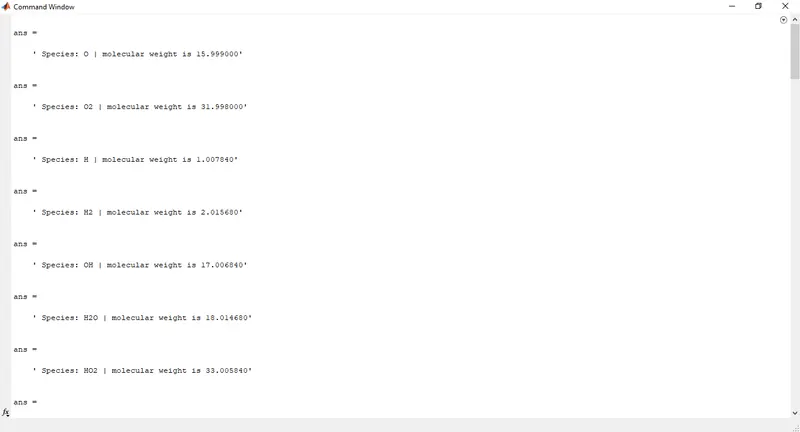
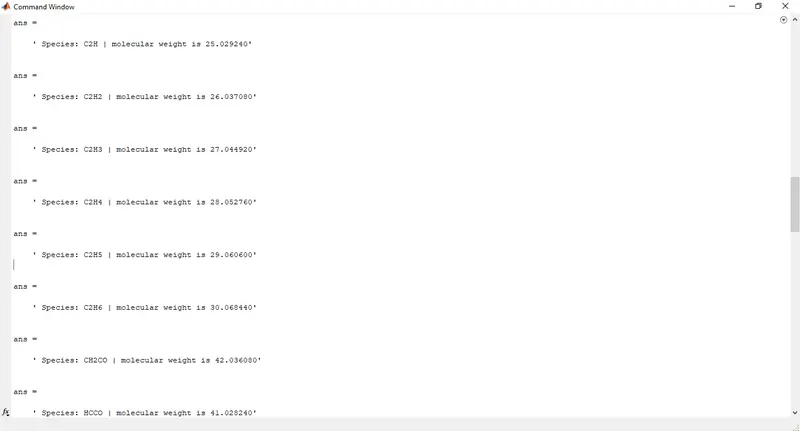
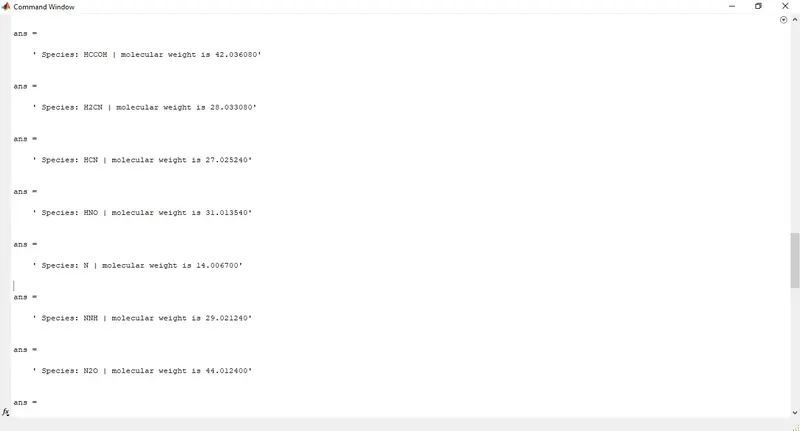
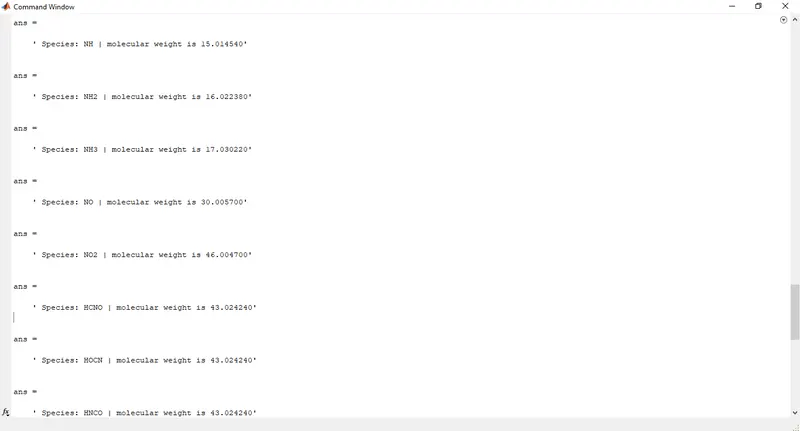
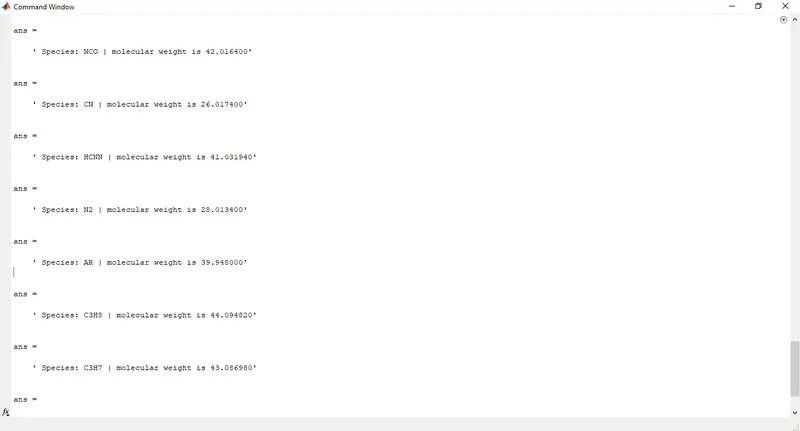
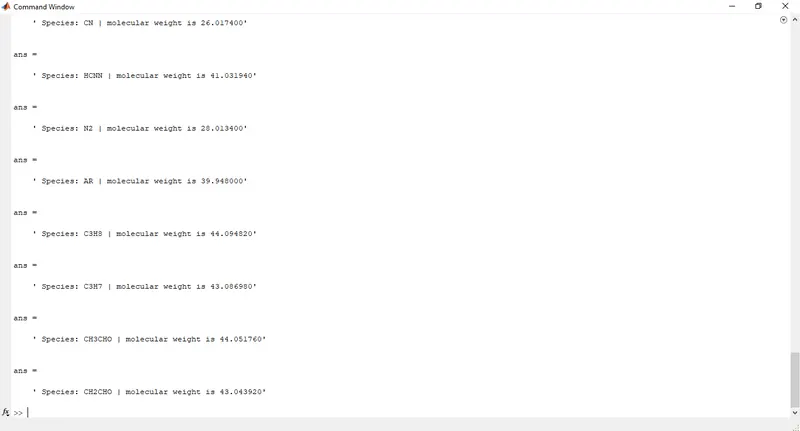
- Calculate the molecular weight of each species and display it in the command window.
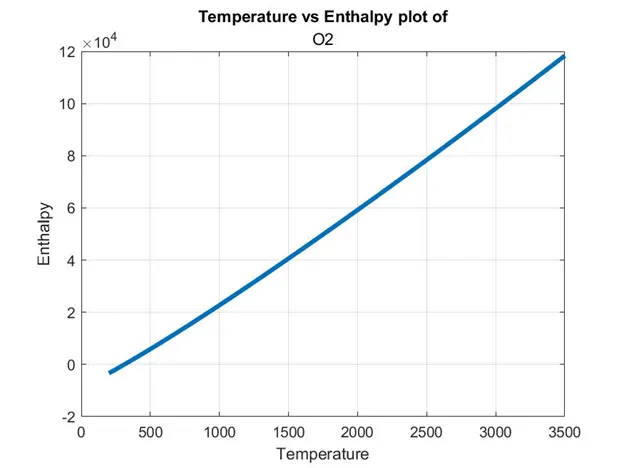
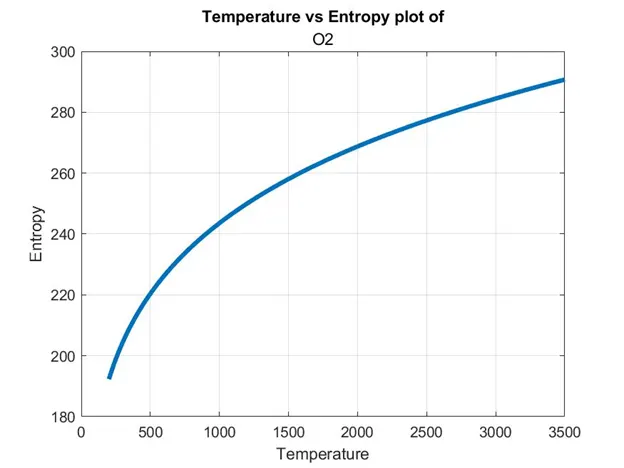
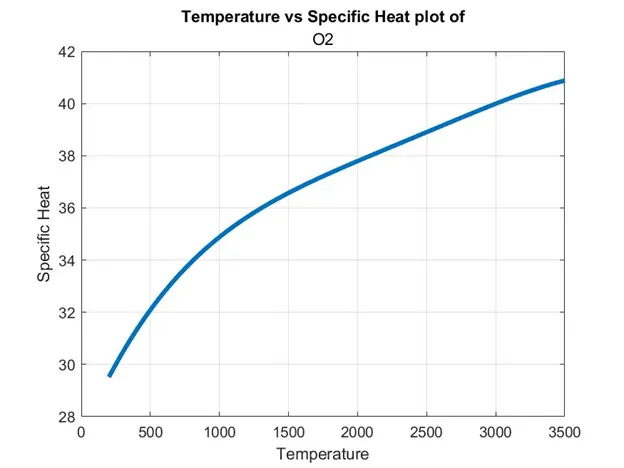
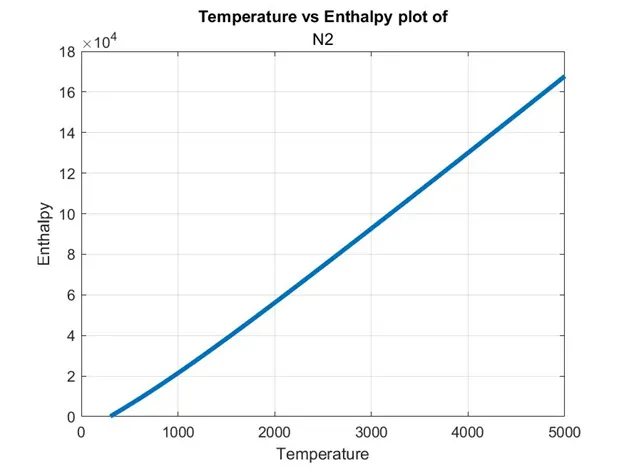
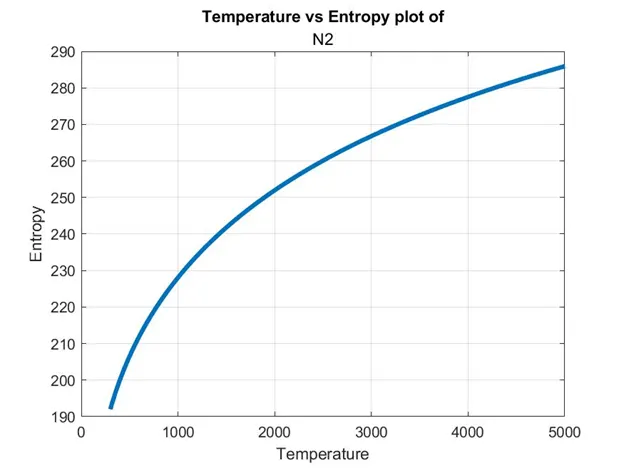
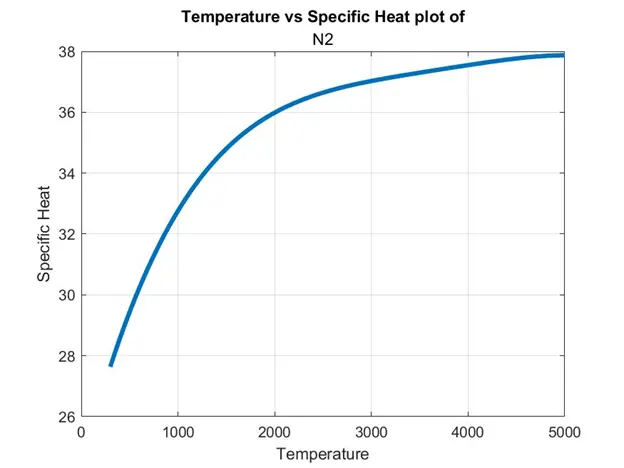
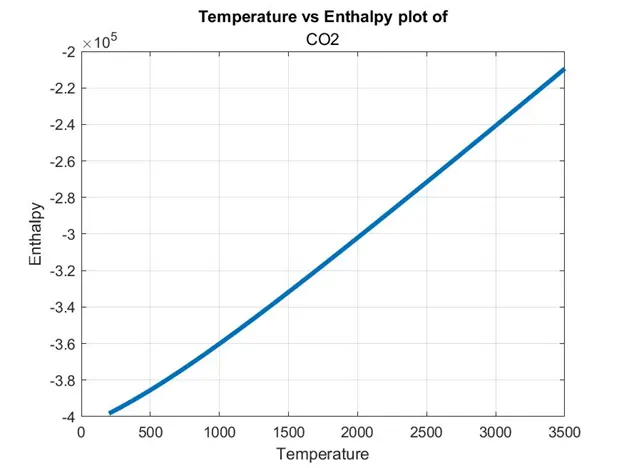
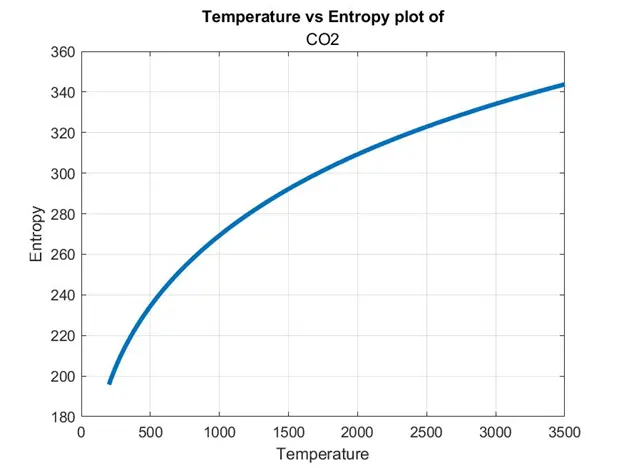
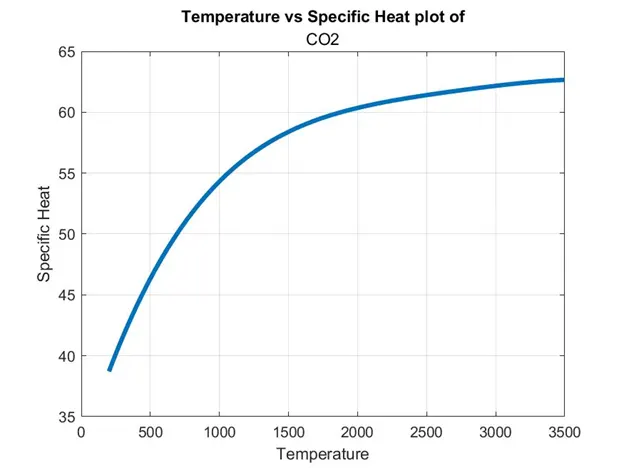
- Plot the Cp, Enthalpy and Entropy for the local temperature specific for each species.
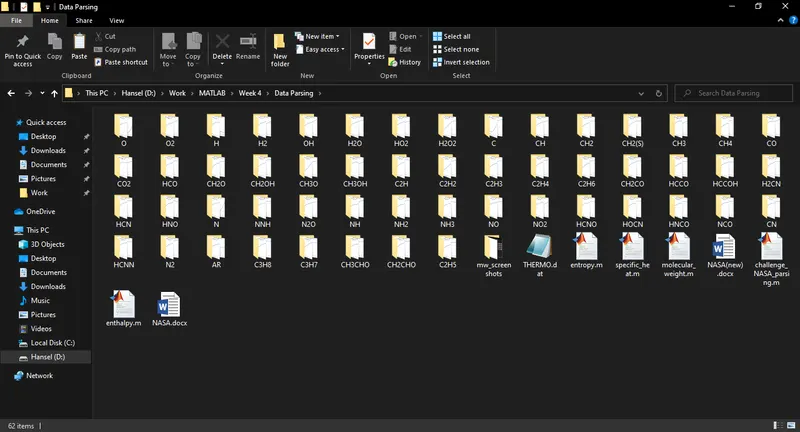
- Save the plots as images with appropriate names and dump them in separate folders for each species with suitable name. All these should be generated automatically.
THEORY:
Data Parsing is the process of taking data in one format and transforming it to another format. Parsers can be found everywhere. They are commonly used in compilers when we need to parse computer code and generate machine code.
The Molecular weight, synonymous to molecular mass (m) is the mass of a given molecule. It is measured in Daltons (Da or u). Different molecules of the same compound may have different molecular masses because they contain different isotopes of an element.
`R=8.31446261815324 J/(K.mol)`
The molar gas constant (also known as the gas constant, universal gas constant, or ideal gas constant) is denoted by the symbol R. It is the molar equivalent to the Boltzmann constant, expressed in units of energy per temperature increment per mole, i.e. the pressure–volume product. The constant is also a combination of the constants from Boyle's law, Charles's law, Avogadro's law, and Gay-Lussac's law.
Enthalpy is a property of a thermodynamic system, and is defined as the sum of the system's internal energy and the product of its pressure and volume.
`H=U+pV`
H = Enthalpy
U = Internal energy
p = Pressure
V = Volume of the system
Entropy is a scientific concept, most commonly associated with a state of disorder, randomness, or uncertainty.
`dU=T dS-p dV`
dU = Change in internal energy
T = Temperature
dS = Change in entropy
p = Pressure
dV = Change in volume
Specific heat capacity (Cp) of a substance is the heat capacity of a sample of the substance divided by the mass of the sample.
`C_p=C/M=1/M .(dQ)/dT`
Cp = Specific Heat
C = Heat capacity of the sample
M = Mass of the sample
EQUATIONS:
For high temperature
`C_p/R=a_1+a_2 T+a_3 T^2+a_4 T^3+a_5 T^4`
`H/(RT)=a_1+(a_2 T)/2+(a_3 T^2)/3+(a_4 T^3)/4+(a_5 T^4)/5+a_6/T`
`S/R=a_1 lnT+ a_2 T+(a_3 T^2)/2+(a_4 T^3)/3+(a_5 T^4)/4+a_7`
For low temperature
`C_p/R=a_8+a_9 T+a_10 T^2+a_11 T^3+a_12 T^4`
`H/(RT)=a_8+(a_9 T)/2+(a_10 T^2)/3+(a_11 T^3)/4+(a_12 T^4)/5+a_13/T`
`S/R=a_8 lnT+ a_9 T+(a_10 T^2)/2+(a_11 T^3)/3+(a_12 T^4)/4+a_14`
NOTE:
First 7 coefficients are high temperature coefficients in THERMO.dat data file.
Second 7 coefficients are low temperature coefficients in THERMO.dat data file.
PROGRAM:
Function for calculation of Enthalpy:
function H=enthalpy(a1,a2,a3,a4,a5,a6,a8,a9,a10,a11,a12,a13,R,mid_temp,T)

if T<=mid_temp
    H=R*T.*(a8+(a9.*T)./2+(a10.*T.^2)./3+(a11.*T.^3)./4+(a12.*T.^4)./5+a13./T);
else
    H=R*T.*(a1+(a2.*T)./2+(a3.*T.^2)./3+(a4.*T.^3)./4+(a5.*T.^4)./5+a6./T);
end
end
Explanation:
- The required coefficients are taken as input for the calculation of enthalpy along with universal gas constant, local medium temperature and local temperature range.
- If condition is applied to check whether the local temperature range is higher or lower than the local medium temperature.
- When the local temperature range is lower than the local medium temperature, enthalpy is calculated using the low temperature coefficients and when the local temperature range is higher than the local medium temperature, enthalpy is calculated using the high temperature coefficients.
- This value is stored in the variable H.
Function for calculation of Entropy:
function S=entropy(a1,a2,a3,a4,a5,a7,a8,a9,a10,a11,a12,a14,R,mid_temp,T)

if T<=mid_temp
    S=R*(a8.*log(T)+(a9.*T)+(a10.*T.^2)./2+(a11.*T.^3)./3+(a12.*T.^4)./4+a14);
else
    S=R*(a1.*log(T)+(a2.*T)+(a3.*T.^2)./2+(a4.*T.^3)./3+(a5.*T.^4)./4+a7);
end
end
Explanation:
- The required coefficients are taken as input for the calculation of entropy along with universal gas constant, local medium temperature and local temperature range.
- If condition is applied to check whether the local temperature range is higher or lower than the local medium temperature.
- When the local temperature range is lower than the local medium temperature, entropy is calculated using the low temperature coefficients and when the local temperature range is higher than the local medium temperature, entropy is calculated using the high temperature coefficients.
- This value is stored in the variable S.
Function for calculation of Specific Heat:
function Cp=specific_heat(a1,a2,a3,a4,a5,a8,a9,a10,a11,a12,R,mid_temp,T)

if T<=mid_temp
    Cp=R*(a8+a9.*T+a10.*T.^2+a11.*T.^3+a12.*T.^4);
else
    Cp=R*(a1+a2.*T+a3.*T.^2+a4.*T.^3+a5.*T.^4);
end
end
Explanation:
- The required coefficients are taken as input for the calculation of specific heat along with universal gas constant, local medium temperature and local temperature range.
- If condition is applied to check whether the local temperature range is higher or lower than the local medium temperature.
- When the local temperature range is lower than the local medium temperature, specific heat is calculated using the low temperature coefficients and when the local temperature range is higher than the local medium temperature, specific heat is calculated using the high temperature coefficients.
- This value is stored in the variable Cp.
Function for calculation of Molecular weight:
function mw=molecular_weight(species)

%Defining atomic weights (u)
%Oxygen, Hydrogen, Nitrogen, Carbon, Argon
molecules=['O','H','N','C','A'];
atomic_weight=[15.999,1.00784,14.0067,12.0107,39.948];

mw=0;

for a=1:length(species)
    for b=1:length(molecules)
        if (strcmpi(species(a),molecules(b)))
            mw=mw+atomic_weight(b);
            position=b;
        end
    end
    x=str2num(species(a));

    if x>0
        mw=mw+atomic_weight(position)*(x-1);
    end
end
sprintf(' Species: %s | %s %f',species,'molecular weight is',mw)
end
Explanation:
- The specie name is taken as input for the calculation of molecular weight.
- The elements are determined in a sequence such that the atomic weights match with each other.
- The specie name and elements are then compared using nested for The for loop checks whether each character of specie string matches the characters in the molecules array. If it matches then the molecular weight is calculated and returned.
- Since the specie name consists of characters which are also numbers (e.g. CH4, 4 in this case), if condition is applied to check whether that particular value is a number or not. If it is a number then it is multiplied to the molecular weight of that particular element.
- Finally, the molecular weight is printed using sprintf
Main program:
clear all
close all
clc

%Opening and reading THERMO.dat file
f=fopen('THERMO.dat','r');
fgetl(f);

%Universal gas constant
R=8.314;

%Global tmmperature
global_temp=fgetl(f);

%Skipping 3 comments
for i=1:3
    fgetl(f);
end

%Accessing all 53 elements
for j=1:53
    %Line 1
    A=fgetl(f);
    line_1=strsplit(A,' ');
    species=line_1{1};

    %Local temperature
    low_temp=str2num(line_1{end-3});
    mid_temp=str2num(line_1{end-1});
    high_temp=str2num(line_1{end-2});

    %Local temperature range
    T=linspace(low_temp,high_temp,500);

    %Line 2
    B=fgetl(f);
    exp_char=strfind(B,'E');

    a1=str2num(B(1:exp_char(1)+3));
    a2=str2num(B(exp_char(1)+4:exp_char(2)+3));
    a3=str2num(B(exp_char(2)+4:exp_char(3)+3));
    a4=str2num(B(exp_char(3)+4:exp_char(4)+3));
    a5=str2num(B(exp_char(4)+4:exp_char(5)+3));

    %Line 3
    C=fgetl(f);
    a6=str2num(C(1:exp_char(1)+3));
    a7=str2num(C(exp_char(1)+4:exp_char(2)+3));
    a8=str2num(C(exp_char(2)+4:exp_char(3)+3));
    a9=str2num(C(exp_char(3)+4:exp_char(4)+3));
    a10=str2num(C(exp_char(4)+4:exp_char(5)+3));

    %Line 4
    D=fgetl(f);
    a11=str2num(D(1:exp_char(1)+3));
    a12=str2num(D(exp_char(1)+4:exp_char(2)+3));
    a13=str2num(D(exp_char(2)+4:exp_char(3)+3));
    a14=str2num(D(exp_char(3)+4:exp_char(4)+3));

    %Enthalpy
    H=enthalpy(a1,a2,a3,a4,a5,a6,a8,a9,a10,a11,a12,a13,R,mid_temp,T);
    figure(1)
    H_plot=plot(T,H,'linewidth',3);
    grid on
    xlabel('Temperature');
    ylabel('Enthalpy');
    title('Temperature vs Enthalpy plot of',species);

    %Entropy
    S=entropy(a1,a2,a3,a4,a5,a7,a8,a9,a10,a11,a12,a14,R,mid_temp,T);
    figure(2)
    S_plot=plot(T,S,'linewidth',3);
    grid on
    xlabel('Temperature');
    ylabel('Entropy');
    title('Temperature vs Entropy plot of',species);


    %Specific heat
    Cp=specific_heat(a1,a2,a3,a4,a5,a8,a9,a10,a11,a12,R,mid_temp,T);
    figure(3)
    Cp_plot=plot(T,Cp,'linewidth',3);
    grid on
    xlabel('Temperature');
    ylabel('Specific Heat');
    title('Temperature vs Specific Heat plot of',species);

    %Creating a folder
    mkdir(species)
    cd (species)

    %Saving plots to respective folders
    saveas(figure(1),'Enthalpy.jpg')
    saveas(figure(2),'Entropy.jpg')
    saveas(figure(3),'Specific Heat.jpg')
    cd 'D:WorkMATLABWeek 4Data Parsing'

    mw=molecular_weight(species);

end

fclose(f);
Explanation:
- The program begins with clear all, close all, clc commands to get rid of any previous data.
- Then the ‘THERMO.dat’ data file is opened and read using fopen and fgetl
- The universal gas constant R is defined. The global temperatures are defined. The 3 comments are also skipped using for
- In order to calculate the properties of all 53 elements, for loop is used.
- The species is defined by using fgetl and strsplit
- The local temperature range is determined using pre-determined local low temperature, local medium temperature, local high temperature values which are converted from strings to numbers.
- Since all the 14 coefficients which are in their exponent form, are needed to calculate the properties, they are assigned to their respective variables (a1,a2,a3,a4,a5,a6,a7,a8,a9,a10,a11,a12,a13,a14).
- The enthalpy is determined using the function and the figure is plotted. The grid on command is used to display the grids. The x-axis and y-axis are labelled using xlabel and ylabel. The required title is given using the title
- Similarly, the value for entropy and specific heat are determined and figure is plotted.
- A new folder is created based on the name of the specie using mkdir, every time the for loop runs to save the plots in .jpg format, to the folder with the specie name.
- The directory is changed to the specie folder using cd and the plots are saved using saveas in .jpg format and then the directory is changed back to the previous folder using cd for the calculation of molecular weight.
- This loop runs until all 53 elements are over.
- The ‘THERMO.dat’ data file is closed using fclose
Results:
Plots for O2
Plots for N2
Plots for CO2
Molecular weight screenshots
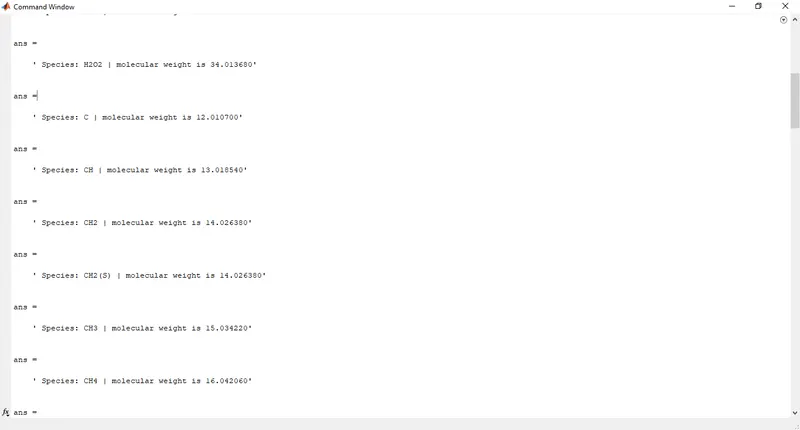
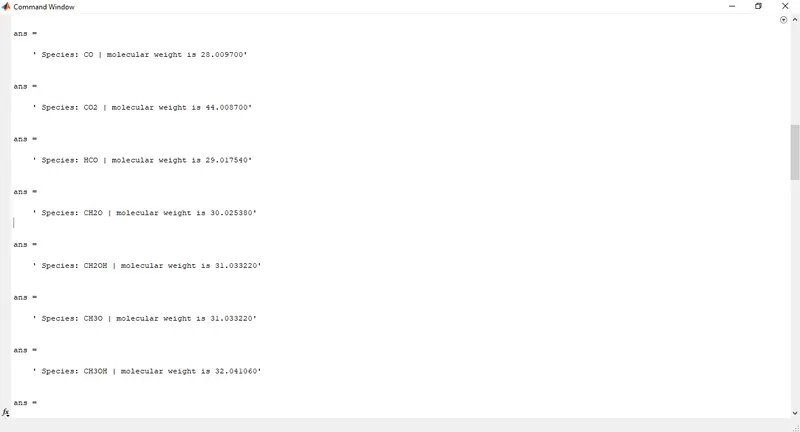
Folder screenshots
REFERENCES:
https://in.mathworks.com/help/matlab/ref/mkdir.html#bu_46hw-2
https://in.mathworks.com/matlabcentral/answers/73306-save-figures-to-one-folder