Project 1 - Parsing NASA thermodynamic data
File Parsing:
In MATLAB, File parsing is generally used to read or write data to any file. It can be either in '.txt' or '.dat' or any other file containing data.
Commands used for file parsing:
1. fopen - open file, or obtain information about open files.
syntax: fileID = fopen(filename,permission)
2. fclose - close one or all open files.
syntax: fclose(fileID)
3. fwrite - write data to binary file.
syntax: fwrite(fileID,A,precision,skip,machinefmt)
4. fread - read data from binary file.
syntax: A = fread(fileID,sizeA,precision,skip,machinefmt)
5. fprintf - wite data to text file.
syntax: fprintf(fileID,formatSpec,A1,...,An)
6. fscanf - read data from text file.
syntax: A = fscanf(fileID,formatSpec,sizeA)
7. fgetl - read line from file, removing newline characters.
syntax: tline = fgetl(fileID)
And some of the string converters that are commonly used:
- str2num - Converts character array or string to numeric array. [e.g: str2num(chr) ]
- str2double - Converts strings to double precision values. [e.g: str2double(str) ]
- findstr - finds strings within other stings. [e.g: findstr(str1,str2) ]
- strsplit - Splits string or character vector at specified delimiter. [e.g: strsplit(str,delimiter,Name,Value) ]
FileID:
File identifier of an open file, specified as an integer. Before closing a file with 'fclose', you must use 'fopen' to open the file and obtain its fileID.
File access types (permission):
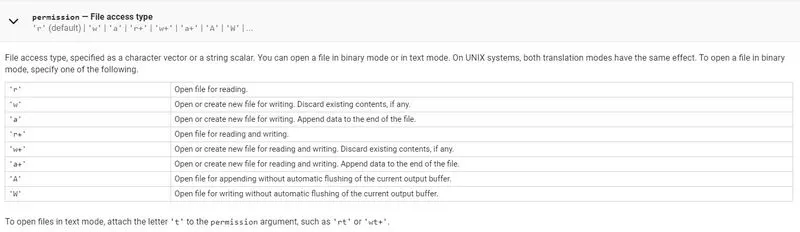
File access type, specified as a character vector or a string scalar. You can open a file in binary mode or in text mode. On UNIX systems, both translation modes have the same effect. To open a file in binary mode, specify one of the following.
AIM:
- To extract 14 coefficients of each species and calculate the entropy, enthalpy and specific heat from a given file.
- To show the variation of these parameters against a corresponding temperature.
- To calculate the molecular weight of each species.
In this particular NASA file, it contains a basic text of values. In that file, it contains a different number of molecules with their regarding coefficients.
So, we're just evaluating that file to read it.
With 'fgetl' command it reads the current line of the file.
PROCEDURE:
- Using 'fopen' to open the file and 'r' to read the file [ f1 = fopen('THERMO.dat','r') ].
- Using 'fgetl' to read the current line and without assigning it to any variable is for not using the line or lines.
- Coming to the specie set, we are taking four lines of specie into their respective specie lines ( i.e species_line1, species_line2, species_line3, species_line4) and evaluating their 14 coefficients (a1-a14) and local temperatures. And this type of process is done to every species by taking 'for loop' ( for i = 1:53 ).
- For every species, we are taking higher coefficients (a1-7) for higher temperatures and lower coefficients (a8-a14) for lower temperatures.
- In the main 'for loop' we are taking ( for each & every species )
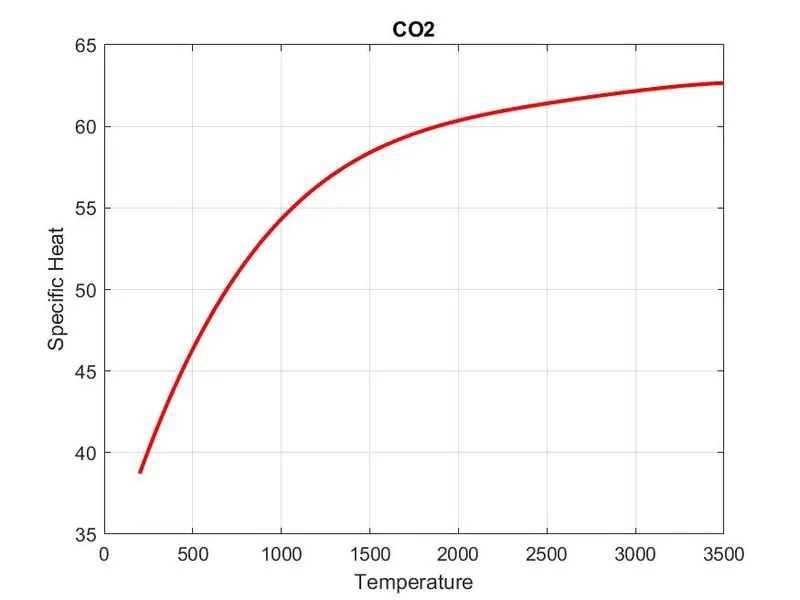
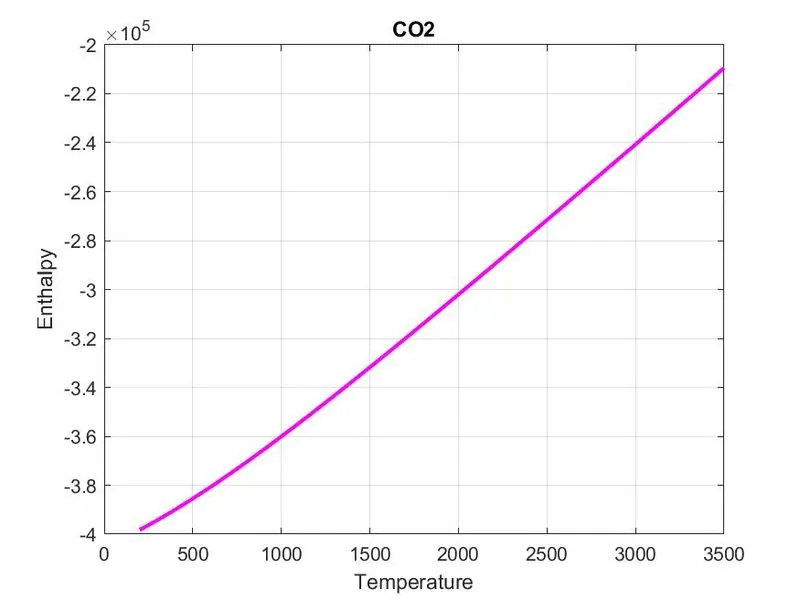
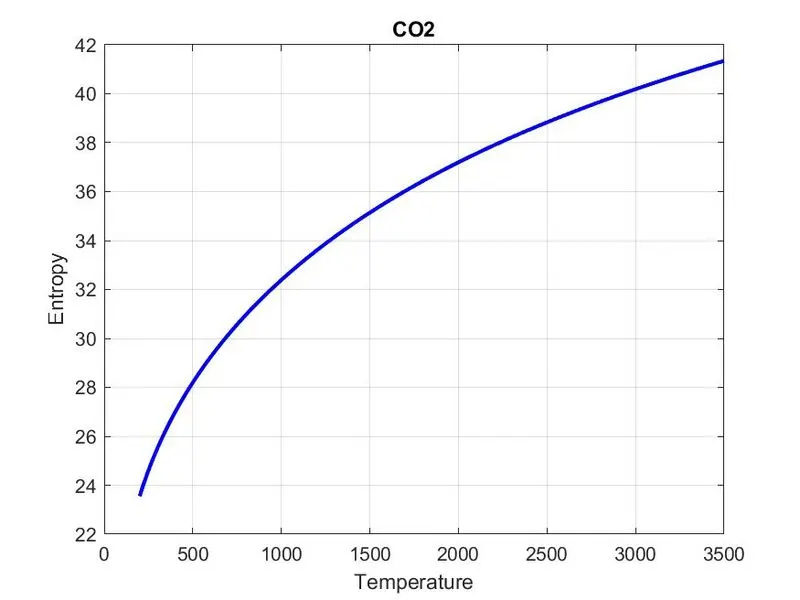
a. calculations for specific heat, enthalpy & entropy.
b. Plotting cp, h & s with their local temperatures.
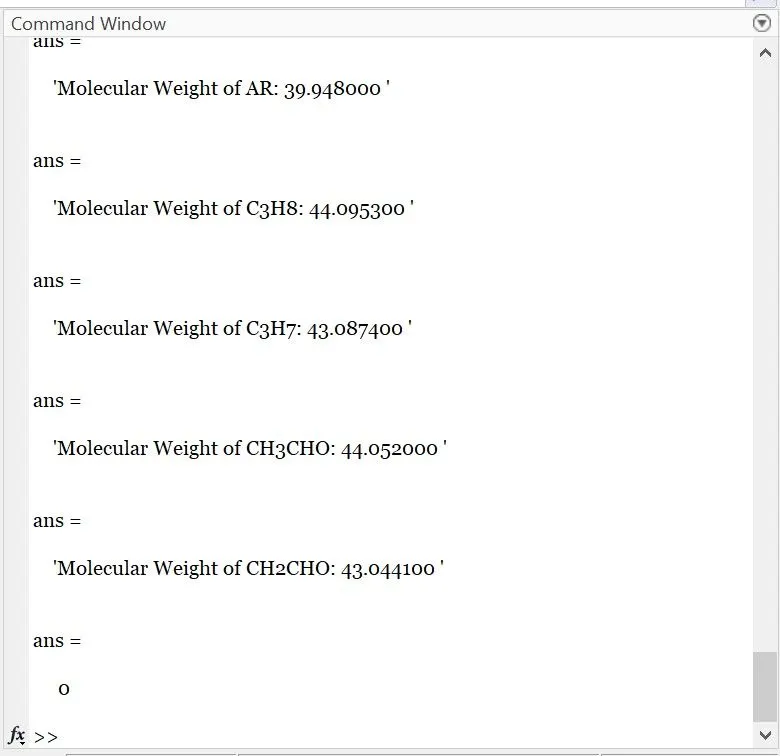
c. Calculating molecular weight.
PROGRAM:
clear all
close all
clc

f1 = fopen('THERMO.dat','r')

fgetl(f1);
tline = fgetl(f1);
tline = strsplit(tline,' ');

% Evaluating global temp's in header file
global_low_temp = str2num(tline{2});
global_mid_temp = str2num(tline{3});
global_high_temp = str2num(tline{4});

for i = 1:3
    fgetl(f1);
end

% Coefficients prop's for 'Each species'

for i = 1:53
      species_line1 = fgetl(f1);
      t_line1 = strsplit(species_line1,'  ');
      specie_name = t_line1{1};

      z = length(t_line1);


      local_low_temp = str2num(t_line1{z-3});
      local_mid_temp = str2num(t_line1{z-1});
      local_high_temp = str2num(t_line1{z-2});


      species_line2 = fgetl(f1);
      A = findstr(species_line2,'E');
      a1 = str2double(species_line2(1:A(1)+3));
      a2 = str2double(species_line2(A(1)+4:A(2)+3));
      a3 = str2double(species_line2(A(2)+4:A(3)+3));
      a4 = str2double(species_line2(A(3)+4:A(4)+3));
      a5 = str2double(species_line2(A(4)+4:A(5)+3));


      species_line3 = fgetl(f1);
      B = findstr(species_line3,'E');
      a6 = str2double(species_line3(1:B(1)+3));
      a7 = str2double(species_line3(B(1)+4:B(2)+3));
      a8 = str2double(species_line3(B(2)+4:B(3)+3));
      a9 = str2double(species_line3(B(3)+4:B(4)+3));
      a10 = str2double(species_line3(B(4)+4:B(5)+3));


      species_line4 = fgetl(f1);
      C = findstr(species_line4,'E');
      a11 = str2double(species_line4(1:C(1)+3));
      a12 = str2double(species_line4(C(1)+4:C(2)+3));
      a13 = str2double(species_line4(C(2)+4:C(3)+3));
      a14 = str2double(species_line4(C(3)+4:C(4)+3));


      % Creating a folder to save each species & their cp, H & S
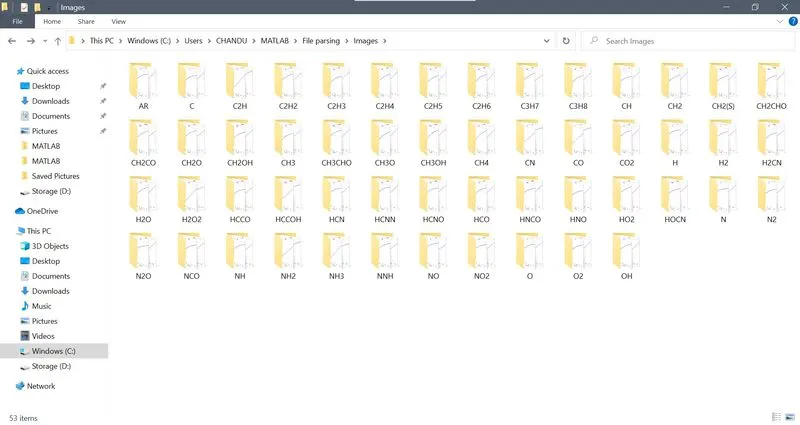
      mkdir(['C:\Users\CHANDU\MATLAB\File parsing\Images\',specie_name])

      R = 8.314;
      T = linspace(local_low_temp,local_high_temp,1000);

      % Calculating every species's 'specific heat, enthalpy & entropy'
      for j = 1:length(T)

% Use (a1- a7) coefficients for higher temp's & (a8- a14) for lower temp's

          if T(j)>local_mid_temp

              % Higher temperature coefficients


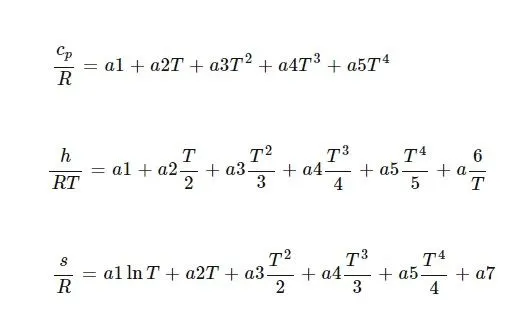
              cp  = (a1+a2.*T+a3.*T.^2+a4.*T.^3+a5.*T.^4)*R;

              H  = (a1+(a2.*T)/2+(a3.*T.^2)/3+(a4.*T.^3)/4+(a5.*T.^4)/5+(a6./T))*R.*T;

              S   = a1.*log(T)+a2.*T+(a3.*T.^2)/2+(a4.*T.^3)/3+(a5.*T.^4)/4+a7;

          else

              % Low temperature coeffecients

              cp  = (a8+a9.*T+a10.*T.^2+a11.*T.^3+a12.*T.^4)*R;

              H   = (a8+(a9.*T)/2+(a10.*T.^2)/3+(a11.*T.^3)/4+(a12.*T.^4)/5+(a13./T))*R.*T;

              S   =  a8.*log(T)+a9.*T+(a10.*T.^2)/2+(a11.*T.^3)/3+(a12.*T.^4)/4+a14;

          end

      end


              % Plotting specific heat, enthalpy & entropy w.r.t temperature


              % Figure 1 (specific heat)
              figure(1);
              plot(T, cp,'linewidth',2,'color','r');
              grid on;
              title(specie_name);
              xlabel('Temperature');
              ylabel('Specific Heat');


              % Figure 2 (enthalpy)
              figure(2);
              plot(T, H,'linewidth',2,'color','m');
              grid on;
              title(specie_name);
              xlabel('Temperature');
              ylabel('Enthalpy');


              % Figure 3 (entropy)
              figure(3);
              plot(T, S,'linewidth',2,'color','b');
              grid on;
              title(specie_name);
              xlabel('Temperature');
              ylabel('Entropy');


   % Saving each and every graph in its particular specie folder
   cd(['C:\Users\CHANDU\MATLAB\File parsing\Images\',specie_name])

    saveas(1,'Specific Heat','jpg');
    saveas(2,'Enthalpy','jpg');
    saveas(3,'Entropy','jpg');


   % Molecular weight calculations


    elements=['H','C','O','N','A'];
    atomic_weight=[1.0079 12.0107 15.999 14.0067 39.948];
    mol_mass=0;
    for l=1:length(specie_name)
        for m=1:length(atomic_weight)
        if strcmp(specie_name(l),elements(m))
            mol_mass=mol_mass+atomic_weight(m);
            position=m;
        end
        end

        n=str2double(specie_name(l));
        if n>1
            mol_mass=mol_mass+atomic_weight(position)*(n-1);

        end
    end
    sprintf('Molecular Weight of %s: %f ',specie_name,mol_mass)

end

fclose(f1)
OUTPUT:
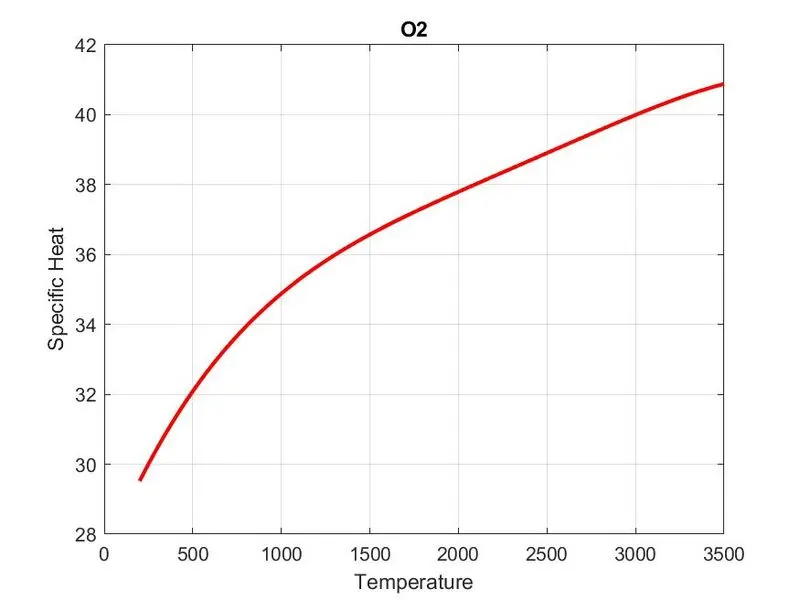
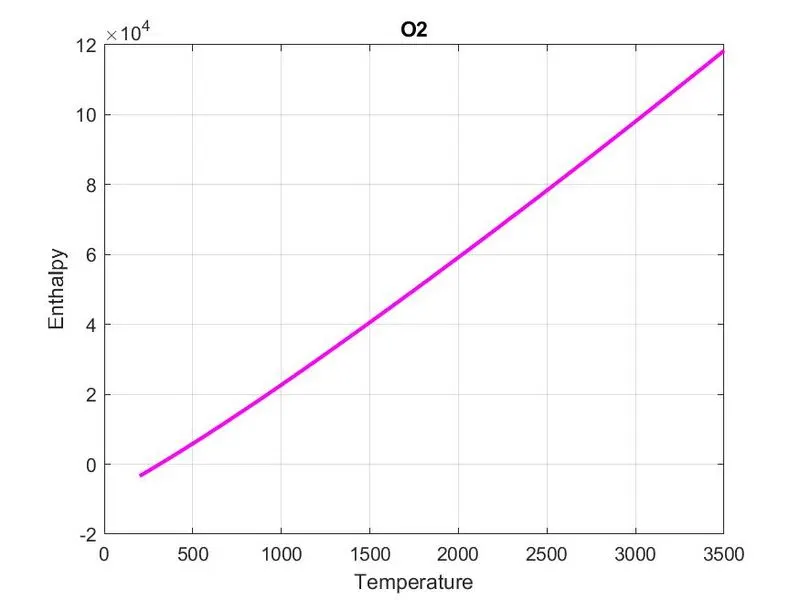
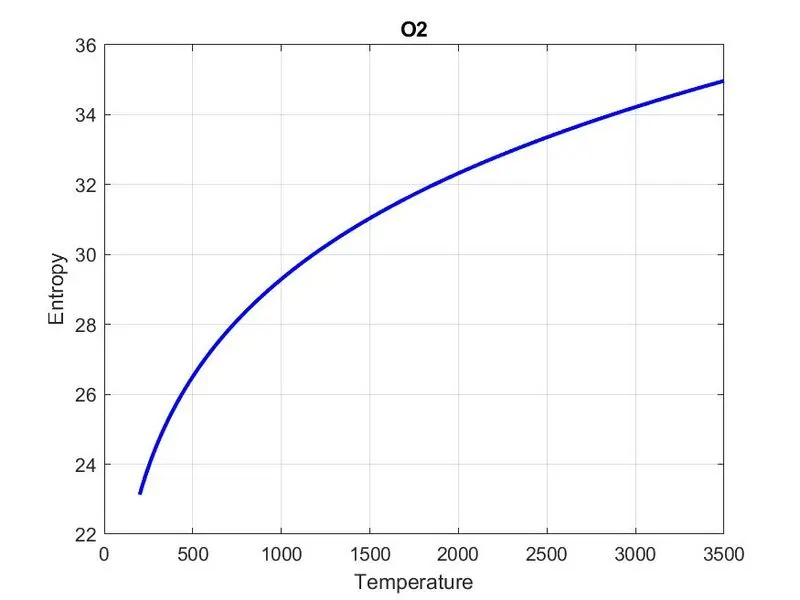
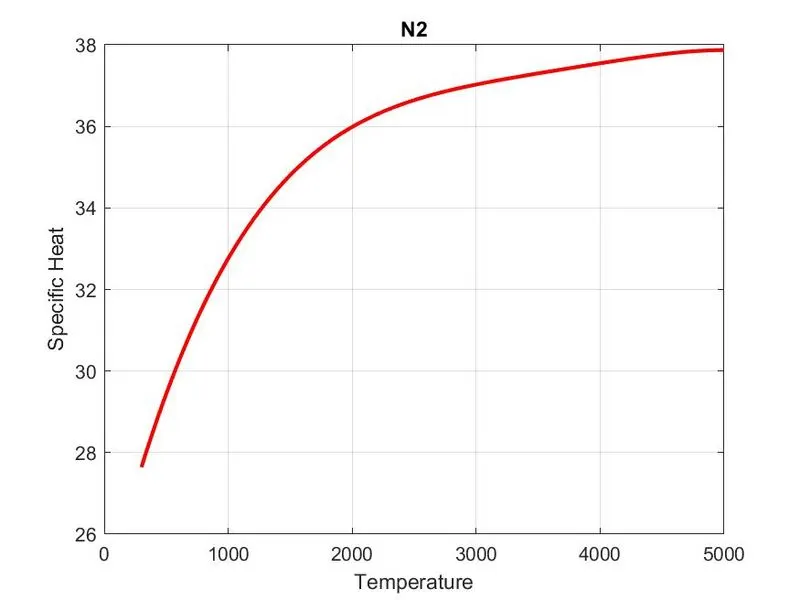
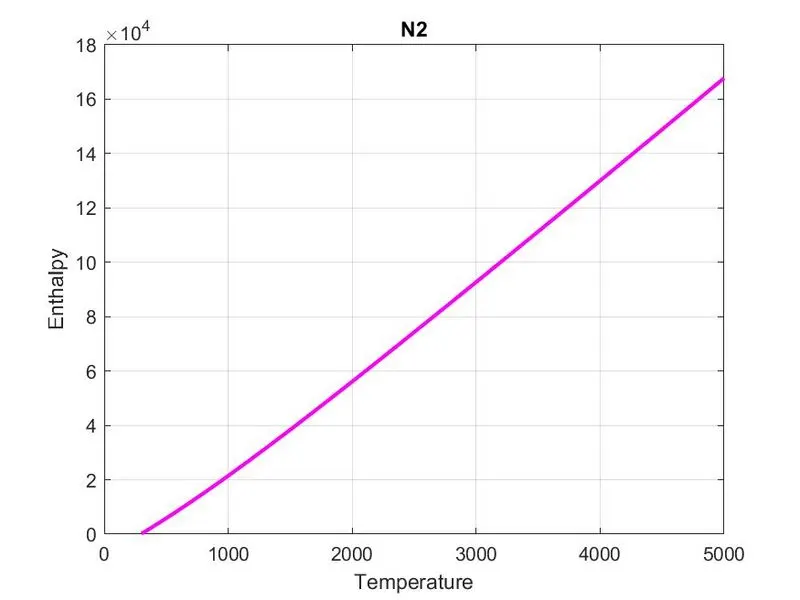
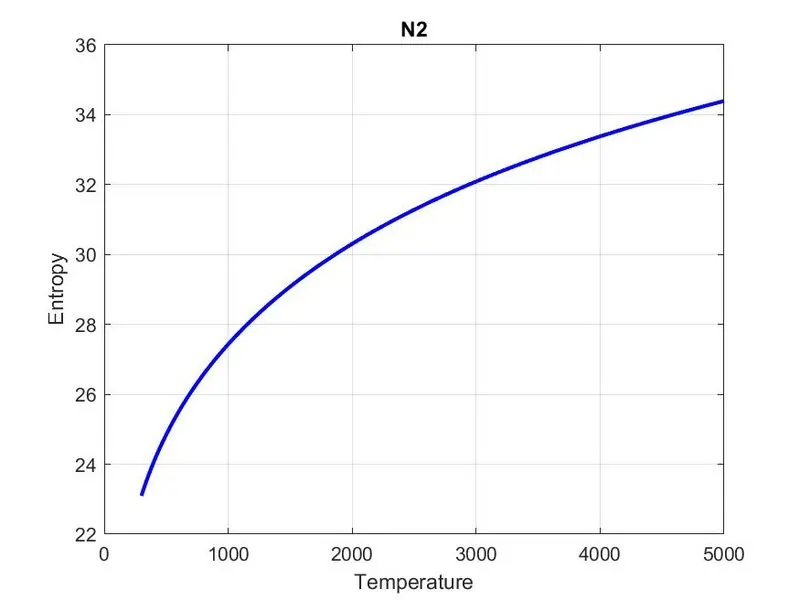
For 'O2','N2' & 'CO2':
'O2':
'N2':
'CO2':
Molecular weights:
Output folder of species:
CONCLUSION:
On successful parsing of data from NASA's thermodynamic data file, variation of thermodynamic properties with temperature of certain species of molecules are observed with the help of plots are obtained.