Project 1 - Parsing NASA thermodynamic data
Report on Parsing NASA thermodynamic data
Aim:
- To write a function that extracts the 14 co-efficients and calculates the enthalpy, entropy and specific heats for all the species in the data file.
Software Used: MATLAB.
Code:
% Parsing Of NASA Thermodynamic Data
clear all
close all
clc
% Open the thermodynamic data file
f1 = fopen('THERMO.dat', 'r');
fgetl(f1); % Skip header line
% Read global temperature limits
global_header_temperature = fgetl(f1);
A = strsplit(global_header_temperature); % Corrected string split
global_low_temperature = str2double(A{2});
global_mid_temperature = str2double(A{3});
global_high_temperature = str2double(A{4});
% Skip theoretical data header
for i = 1:3
fgetl(f1);
end
for i = 1:53 % Iterate over species
% Read species data
tline1 = fgetl(f1);
tline2 = fgetl(f1);
tline3 = fgetl(f1);
tline4 = fgetl(f1);
% Extract species name and temperature limits
loc_temp = strsplit(tline1, ' ');
species_name = strtrim(loc_temp{1}); % Ensure no spaces
loc_low_temp = str2double(loc_temp{end-3});
loc_mid_temp = str2double(loc_temp{end-2});
loc_high_temp = str2double(loc_temp{end-1});
% Extract coefficients
a = findstr(tline2, 'E');
a1 = str2double(tline2(1:a(1)+3));
a2 = str2double(tline2(a(1)+4:a(2)+3));
a3 = str2double(tline2(a(2)+4:a(3)+3));
a4 = str2double(tline2(a(3)+4:a(4)+3));
a5 = str2double(tline2(a(4)+4:a(5)+3));
a = findstr(tline3, 'E');
a6 = str2double(tline3(1:a(1)+3));
a7 = str2double(tline3(a(1)+4:a(2)+3));
a8 = str2double(tline3(a(2)+4:a(3)+3));
a9 = str2double(tline3(a(3)+4:a(4)+3));
a10 = str2double(tline3(a(4)+4:a(5)+3));
a = findstr(tline4, 'E');
a11 = str2double(tline4(1:a(1)+3));
a12 = str2double(tline4(a(1)+4:a(2)+3));
a13 = str2double(tline4(a(2)+4:a(3)+3));
a14 = str2double(tline4(a(3)+4:a(4)+3));
% Compute thermodynamic properties
R = 8.314;
T = linspace(loc_low_temp, loc_high_temp, 300);
cp = specific_heat(a1, a2, a3, a4, a5, a6, a7, a8, a9, a10, R, T, loc_mid_temp);
H = enthalpy(a1, a2, a3, a4, a5, a6, a8, a9, a10, a11, a12, a13, loc_mid_temp, T);
S = entropy(a1, a2, a3, a4, a5, a7, a8, a9, a10, a11, a12, a14, loc_mid_temp, T);
% Create directory and save plots
base_folder = pwd;
mkdir(fullfile(base_folder, species_name));
cd(fullfile(base_folder, species_name));
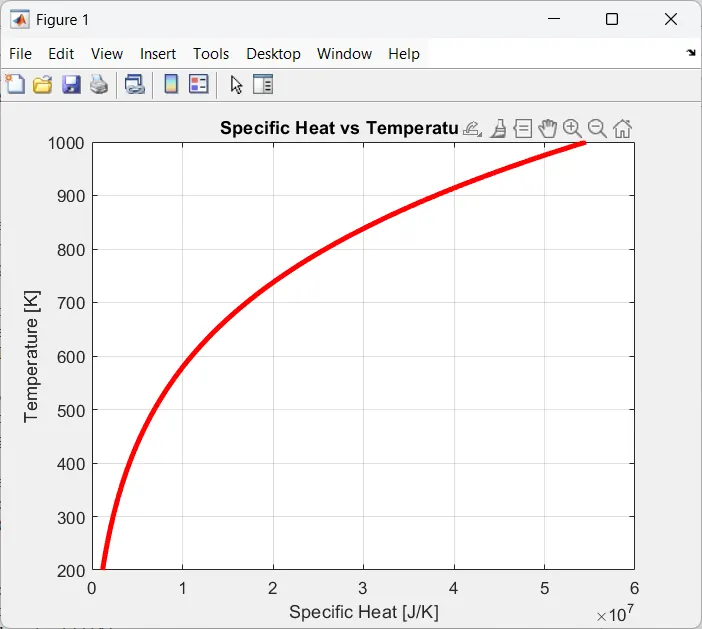
figure(1);
plot(cp, T, 'r', 'LineWidth', 3);
title(['Specific Heat vs Temperature - ' species_name]);
xlabel('Specific Heat [J/K]');
ylabel('Temperature [K]');
grid on;
saveas(gcf, 'cp_vs_T.jpeg');
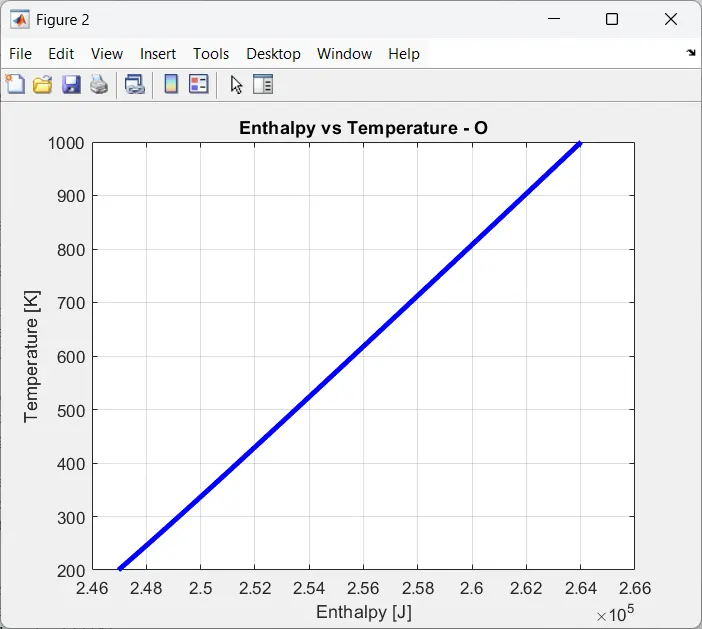
figure(2);
plot(H, T, 'b', 'LineWidth', 3);
title(['Enthalpy vs Temperature - ' species_name]);
xlabel('Enthalpy [J]');
ylabel('Temperature [K]');
grid on;
saveas(gcf, 'H_vs_T.jpeg');
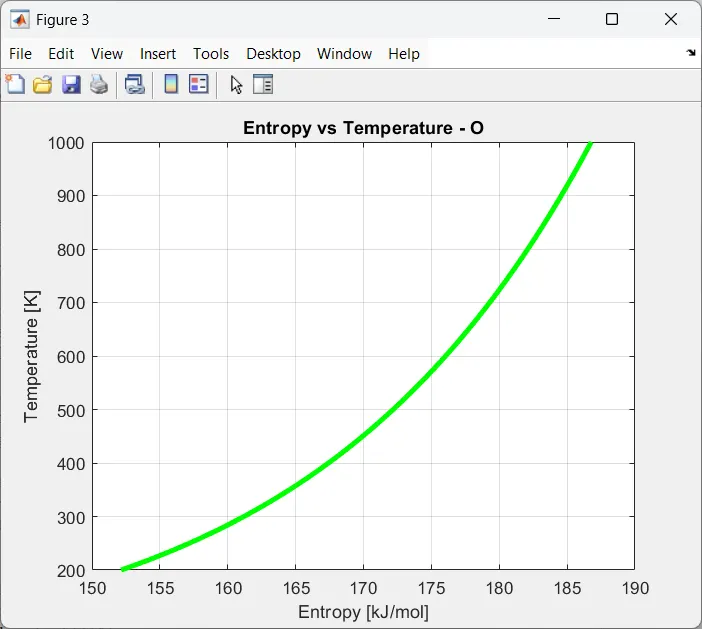
figure(3);
plot(S, T, 'g', 'LineWidth', 3);
title(['Entropy vs Temperature - ' species_name]);
xlabel('Entropy [kJ/mol]');
ylabel('Temperature [K]');
grid on;
saveas(gcf, 'S_vs_T.jpeg');
% Compute molecular weight
molecular_weight = mol_weight(species_name);
end
Enthalpy
%Function program for enthalpy
function[H] = enthalpy(a1,a2,a3,a4,a5,a6,a8,a9,a10,a11,a12,a13,loc_mid_temp,T)
R = 8.314;
if (T>loc_mid_temp)
H = ((a1+((a2*T)/2)+(a3*(T.^2))/3)+((a4*(T.^3))/4)+((a5*(T.^4))/5)+(a6./T)).*T*R;
else
H = ((a8+((a9*T)/2)+((a10*T.^2))/3)+((a11*(T.^3))/4)+((a12*(T.^4))/5)+(a13./T)).*T*R;
end
Entropy
%function code to find the entropy
function[S] = entropy(a1,a2,a3,a4,a5,a7,a8,a9,a10,a11,a12,a14,loc_mid_temp,T)
R = 8.314;
if (T>loc_mid_temp)
S = R*(a1*logT)+(a2*T)+((a3*(T.^2))/2)+((a4*(T.^3)/3)+(a5*(T.^4)/4)+a7);
else
S = R*((a8*log(T)+(a9*T)+(a10*(T.^2)/2)+(a11*(T.^3))/3)+(a12*(T.^4)/4)+a14);
end
Molecular weight
function [w]=mol_weight(species_name)
atomic_names=['H', 'C', 'O', 'N', 'A'];
atomic_weights=[1.00784,12.0107,15.999,14.0067,39.948];
w=0;
for i=1:length(species_name)
for j=1:length(atomic_names)
if strcmpi(species_name(i), atomic_names (j))
w=w+atomic_weights(j);
pos=j;
end
end
n=str2double(species_name(i));
if n>1
w =w+atomic_weights(pos)*(n-1);
end
end
fprintf('Molecular weight of %s = %f', species_name, w);
end
Explanation:
- Opens the NASA thermodynamic data file (THERMO.dat).
- fgetl(f1) skips the header line.
- Reads global temperature limits from the second line.
- Converts temperature strings into numerical values.
- Reads four lines per species.
- Stores species name and temperature limits.
- Extracts species Name (first entry in tline1) and Low, Mid, and High Temperatures (last three entries).
- findstr(tline2, 'E') finds scientific notation coefficients (e.g., 2.543E+01).
- Extracts and converts coefficients for Cp, H, and S.
- Similar extraction is repeated for tline3 and tline4 to get all 14 coefficients.
- Uses NASA polynomial equations to compute Specific Heat Capacity (Cp),Enthalpy (H),Entropy (S).
- Calls three functions (specific_heat, enthalpy, entropy).
- Plots Cp vs. T in red and saves the figure as 'cp vs T.jpeg'.
- Plots H vs. T in blue.
- Plots S vs. T in green.
- Creates a folder for the species.
- Saves plots in the folder.
- Calls mol_weight(species_name), which extracts elements from the species name and computes total molecular weight.
- Uses NASA polynomials to compute enthalpy, entropy, Molecular weight.
Result:
Conclusion:
- The 14 co-efficients are extracted and the enthalpy, entropy and specific heats for all the species in the data file are calculated.