Project 1 - Parsing NASA thermodynamic data
"Project 1 - Parsing NASA thermodynamic data"
Aim:
To write a Matlab Program to extract 14 coefficients from NASA Thermodynamics data file to calculate enthalpy, entropy, specific heat, for all the species in the data file.
Objective:
- To write a function that extracts 14 co-efficient for a given species from the given information.
- To write a function that calculates the enthalpy, entropy, and specific heat using NASA polynomials for the given species.
- To write a function that plots the Cp, Enthalpy, and Entropy of input species.
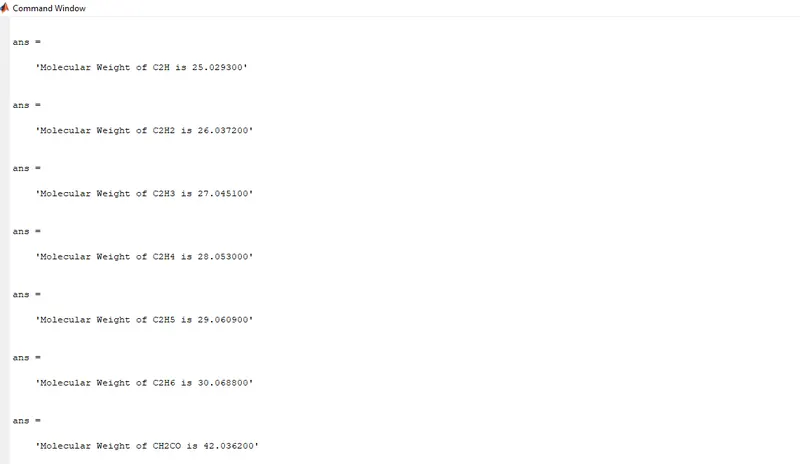
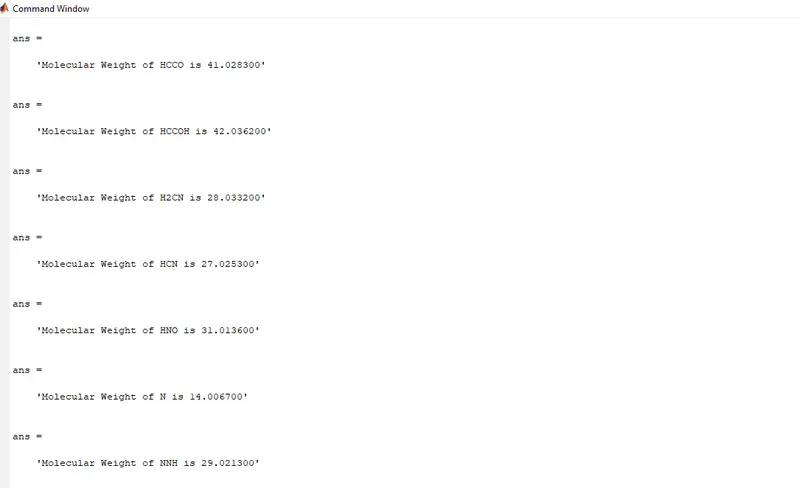
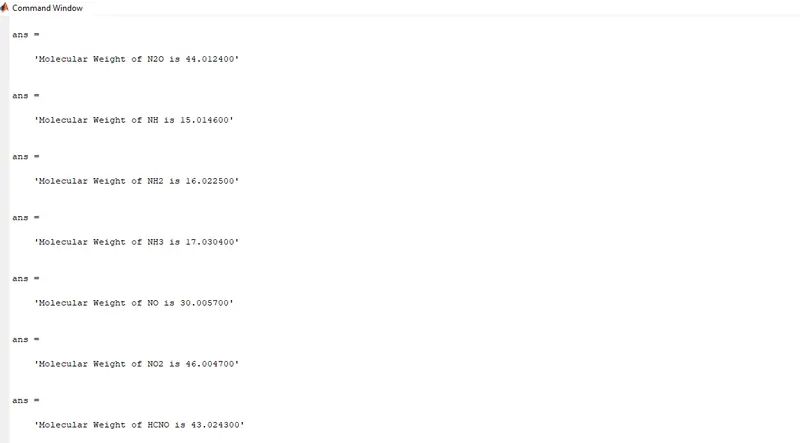
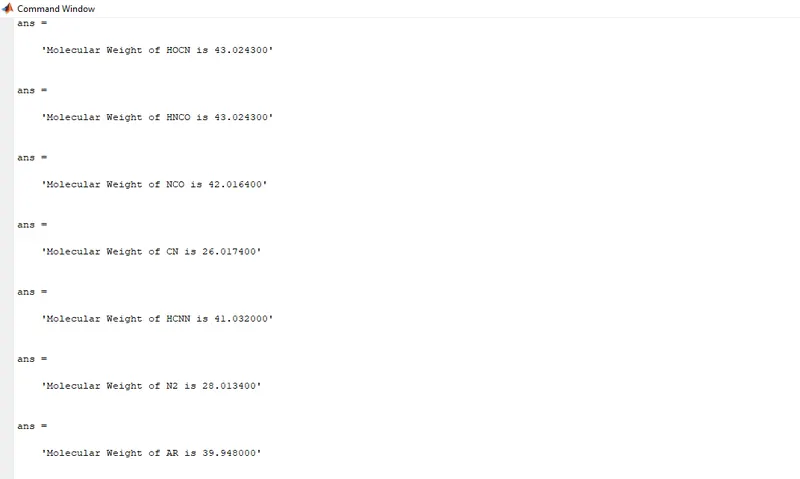
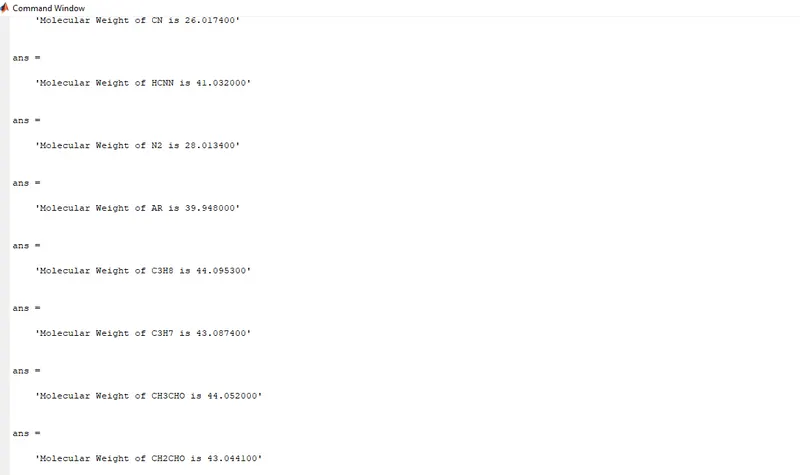
- To write a function that calculates the molecular weight of each species.
Basic Theory:
File Parsing:
Parsing in computer language refers to the syntactic analysis of the input code into its components parts in order to facilitate the writing of compilers and interpreters. It can be used to describe split or separation.
It is the method of splitting the file or other input into a piece of data that can be easily stored or manipulated. By doing this we are going to split a string into parts then recognizing the parts to convert it into something simpler than a string.
Here, in this project, we are going to split the NASA thermodynamic data. To perform the calculation for thermodynamic properties, we need some sort of co-efficient values and temperature ranges which are available in the NASA file. So, we are going to parse the values which are all needed for our calculation from that file.
Specific Heat:
It is the quantity of heat required to raise the temperature of one gram of a substance by one Celsius degree. The units of specific heat are usually calories or joules per gram per Celsius degree. For example, the specific heat of water is 1 calorie (or 4,186 joules) per gram per Celsius degree.
The Specific heat is denoted by C.
Thus, the specific heat equation is given by
C = `Q/(mDeltat)` joules/`kg^oc`
Where,
`DeltaQ` - The amount of heat gained or lost in joules.
`DeltaT` - The change or raise in the temperature in degree celsius.
m - The mass of the substance in kg.
Enthalpy:
It is the sum of the internal energy and the product of the pressure and volume of a thermodynamic system. Enthalpy is an energy-like property or state function—it has the dimensions of energy (and is thus measured in units of joules or ergs), and its value is determined entirely by the temperature, pressure, and composition of the system and not by its history. In symbols, the enthalpy, H, equals the sum of the internal energy, E, and the product of the pressure, P, and volume, V, of the system: H = E + PV.
According to the law of energy conservation, the change in internal energy is equal to the heat transferred to, less the work done by, the system. If the only work done is a change of volume at constant pressure, the enthalpy change is exactly equal to the heat transferred to the system. When energy needs to be added to a material to change its phase from a liquid to a gas, that amount of energy is called the enthalpy (or latent heat) of vaporization and is expressed in units of joules per mole. Other phase transitions have similar associated enthalpy changes, such as the enthalpy (or latent heat) of fusion for changes from a solid to a liquid. As with other energy functions, it is neither convenient nor necessary to determine absolute values of enthalpy. For each substance, the zero-enthalpy state can be some convenient reference state.
Entropy:
It is the measure of a system’s thermal energy per unit temperature that is unavailable for doing useful work. Because work is obtained from ordered molecular motion, the amount of entropy is also a measure of the molecular disorder, or randomness, of a system. The concept of entropy provides deep insight into the direction of spontaneous change for many everyday phenomena.
The idea of entropy provides a mathematical way to encode the intuitive notion of which processes are impossible, even though they would not violate the fundamental law of conservation of energy. For example, a block of ice placed on a hot stove surely melts, while the stove grows cooler. Such a process is called irreversible because no slight change will cause the melted water to turn back into ice while the stove grows hotter. In contrast, a block of ice placed in an ice-water bath will either thaw a little more or freeze a little more, depending on whether a small amount of heat is added to or subtracted from the system. Such a process is reversible because only an infinitesimal amount of heat is needed to change its direction from progressive freezing to progressive thawing. Similarly, compressed gas confined in a cylinder could either expand freely into the atmosphere if a valve were opened (an irreversible process), or it could do useful work by pushing a moveable piston against the force needed to confine the gas. The latter process is reversible because only a slight increase in the restraining force could reverse the direction of the process from expansion to compression. For reversible processes, the system is in equilibrium with its environment, while for irreversible processes it is not.
Molecular Weight:
Molecular weight, also called molecular mass, mass of a molecule of a substance, based on 12 as the atomic weight of carbon -12. It is calculated in practice by summing the atomic weights of the atoms making up the substance’s molecular formula. It is measured in daltons (Da or u). Different molecules of the same compound may have different molecular masses because they contain different isotopes of an element. The related quantity relative molecular mass, as defined by IUPAC, is the ratio of the mass of a molecule to the unified atomic mass unit (also known as the dalton) and is unitless. The molecular mass and relative molecular mass are distinct from but related to the molar mass. The molar mass is defined as the mass of a given substance divided by the amount of substance and is expressed in g/mol. The molar mass is usually the more appropriate figure when dealing with macroscopic (weigh-able) quantities of a substance.
Governing Equations:

Where,
Cp = Specific Heat (J/K kg)
H = Enthalpy (J)
S = Entropy (J/K)
R = Universal Gas Cinstant = 8.314 (J/mol.K)
T = Temperature (K)
a1.....a7 = Coefficients (In the file first 7 are high temperature and other 7 are low temperature coefficients)
Main Program:
clear all
close all
clc

% Extracting  the coefficient of thermodynamics
dt = fopen('THERMO.dat','r');

% Reading the first 5 lines of file(not for use)
first_line = fgetl(dt); % Reading the 1st line from data
global_temp = fgetl(dt); % Reading 2nd line from data
temp_range = strsplit(global_temp,''); % Splitting 2nd line using blank space as delimiter
comments_1 = fgetl(dt); % Reading 3rd line from data
comments_2 = fgetl(dt); % Reading 4th line from data
comments_3 = fgetl(dt); % Reading 5th line from data

for i = 1:53
    % Extracting name of gas species
 A = fgetl(dt); % Reading the 6th line
 species = strtok(A); % Reading the species name

% Extracting co-efficient of gas species
B = fgetl(dt);
b = findstr(B,'E');
a1 = B(1:b(1)+3); % Assigning 'a' variable for the temperature co-efficients
a1 = str2num(a1);
a2 = B(b(1)+4:b(2)+3);
a2 = str2num(a2);
a3 = B(b(2)+4:b(3)+3);
a3 = str2num(a3);
a4 = B(b(3)+4:b(4)+3);
a4 = str2num(a4);
a5 = B(b(4)+4:b(5)+3);
a5 = str2num(a5);

% 2nd line of species co-efficient
D = fgetl(dt);
d = findstr(D,'E');
a6 = D(1:d(1)+3);
a6 = str2num(a6);
a7 = D(d(1)+4:d(2)+3);
a7 = str2num(a7);
a8 = D(d(2)+4:d(3)+3);
a8 = str2num(a8);
a9 = D(d(3)+4:d(4)+3);
a9 = str2num(a9);
a10 = D(d(4)+4:d(5)+3);
a10 = str2num(a10);

% 3rd line of species co-efficient
D = fgetl(dt);
d = findstr(D,'E');
a11 = D(1:d(1)+3);
a11 = str2num(a11);
a12 = D(d(1)+4:d(2)+3);
a12 = str2num(a12);
a13 = D(d(2)+4:d(3)+3);
a13 = str2num(a13);
a14 = D(d(3)+4:d(4)+3);
a14 = str2num(a14);

% Creating a vector of 500 evenly spaced temperature points
t1 = 200;
t2 = 3500;
t3 = 1000;
T = linspace(t1,t2,500);

% Gas Constant
R = 8.314;

for j = 1:length(T)

  if T(j)>t3

      Cp(j) = (a1 + a2.*T(j) + a3.*T(j).^2 + a4.*T(j).^3 + a5.*T(j).^4)*R;
      H(j) = (a1 + (a2.*T(j))/2 + (a3.*T(j).^2)/3 + (a4.*T(j).^3)/4 + (a5.*T(j).^4)/5 + (a6./T(j)))*R.*T(j);
      S(j) = a1.*log(T(j)) + a2.*T(j) + (a3.*T(j)^2)/2 + (a4.*T(j)^3)/3 + (a5.*T(j)^4)/4 + a7;
  else
       Cp(j) = (a8 + a9.*T(j) + a10.*T(j).^2 + a11.*T(j).^3 + a12.*T(j).^4)*R;
      H(j) = (a8 + (a9.*T(j))/2 + (a10.*T(j).^2)/3 + (a11.*T(j).^3)/4 + (a12.*T(j).^4)/5 + (a13./T(j)))*R.*T(j);
      S(j) = a8.*log(T(j)) + a9.*T(j) + (a10.*T(j)^2)/2 + (a11.*T(j)^3)/3 + (a12.*T(j)^4)/4 + a14;
  end
end


 % Plotting Specific Heat vs Temperature
figure(1)
plot(T,Cp,'color','b','linewidth',3)
xlabel('Temperature (K)')
ylabel('Specific Heat (J/K Kg)')
title('Specific Heat vs Temperature Graph')
grid on

% Plotting Enthalpy vs Temperature
figure(2)
plot(T,H, 'color','r','linewidth',3)
xlabel('Temperature (K)')
ylabel('Enthalpy (J/K)')
title('Enthalpy vs Temperature Graph')
grid on

% Plotting Entropy vs Temperature
figure(3)
plot(T,S,'color','g','linewidth',3)
xlabel('Temperature (K)')
ylabel('Entropy (J/K)')
title(' Entropy vs Temperature Graph')
grid on

% Making new folder for saving the plot
mkdir('D:\Souradip\MATLAB for Mechanical Engineers',species)
cd(species)
saveas(figure(1),'Cp vs Temp.jpg')
saveas(figure(2),'Enthalpy vs Temp.jpg')
saveas(figure(3),'Entropy vs Temp.jpg')
cd('D:\Souradip\MATLAB for Mechanical Engineers')

% Molecular Weight Calculation
Elements = ['H','C','O','N','AR']; % Species Elements vector
Atomic_Weight = [1.0079 12.0107 15.999 14.0067 39.948]; % The Atomic Weight value of respective species
Molecular_Weight = 0; % Declaring Molecular Weight to be '0'

for x = 1:length(species)
    for y = 1:length(Atomic_Weight)
        if strcmp(species(x), Elements(y))
            Molecular_Weight = Molecular_Weight + Atomic_Weight(y);
            position = y;
        end
    end
    n = str2double(species(x));
    if n>1
        Molecular_Weight = Molecular_Weight + Atomic_Weight(position)*(n-1);
    end
end
  % Printing The Molecular Weight of the gas species in the command window
sprintf('Molecular Weight of %s is %f',species,Molecular_Weight)
end
fclose(dt);
Program Explanation:
- The program begins with clear all, close all, clc which clears all the graphs, stored data previously saved.
- Then the code is started with opening the file by using the command fopen('THERMO.dat', 'r'), the 'r' is used to read the file.
- Next, 5 lines include the fgetl command which reads each 5 lines text or integers(all the lines are stored or read in the string format). The first five lines seem to be irrelevant as we need only the coefficient value and species name.
- Now, we will create a for loop which will extract the species name and the value of its coefficient. Starting with the species name, we type fgetl(dt) and denoting it with the variable name A. It will read the sixth line which contains the species along with the temperature range.
- Next line we have used strtok which parses str from left to right, using whitespace characters as delimiters and returns part or all of the text in species.
- Now we are going to extract the co-efficient for the gas species in which the co-efficient locations are like in the 2nd row, the next 5 in the 3rd row, and the rest in the 4th row.
- We are going to extract these values similarly as we did for finding out local temperatures by using the findstr and str2num commands and store them in the variables a1 to a14. for extracting we are going to locate the string 'E' which is present in each co-efficient value and so it will be followed for all the coefficients values in the same line and then we can proceed for the next lines.
- The values from a1 to a7 represent the high-temperature coefficients and the values from a8 to a14 represent low-temperature coefficients.
- Then we have defined the temperature as t1,t2, and t3 equals 200,3500, and 1000 respectively from which the t1 is low temperature, t2 is high temperature and t3 is mild temperature. Temperature range values from t1 to t2 are assigned using the linspace command.
- Next, we have defined the gas constant R = 8.314.
- Again we have used the for loop command to calculate the values of specific heat, enthalpy, and entropy and also used the if-else command to find out the required values if the temperature is below the mild temperature or above the mild temperature.
- Then to create the new folder with the species we have used mkdir command so that a new folder is created in the main folder.
- Further, we have plotted the graph from the values obtained from the above step. The plots for specific heat vs temperature, enthalpy vs temperature, and entropy vs temperature are plotted.
- Next, Cd command is used to change the directory to the current folder mentioned, and all the plots are saved in jpg format in the respective species folder by using saveas command.
Molecular Weight Calculation Explanation:
- For the molecular weight calculation, we basically added the atomic weight of all the species of atoms. In order to calculate the molecular weight of the species, we declared the species elements in the form of cell array. Their atomic mass is declared in the form of an array and initially, the molecular weight is declared as zero.
- Now, for loop is used to detect if there are more than one species in the variable species.
- Then, strcmp command is used to compare and match the elements and species for further process.
- After the species name is matched and its atomic value-added, it is stored under the variable name position y.
- Since there can be more than two molecules of the same elements, the remaining elements are calculated by first converting the species to number by using str2double under n variable.
- Now, if loop(n>1) is used to multiple the (n-1) to the previously stored position value. Since one molecule of the element is already used the rest molecules are simply multiplied to previous by n-1.
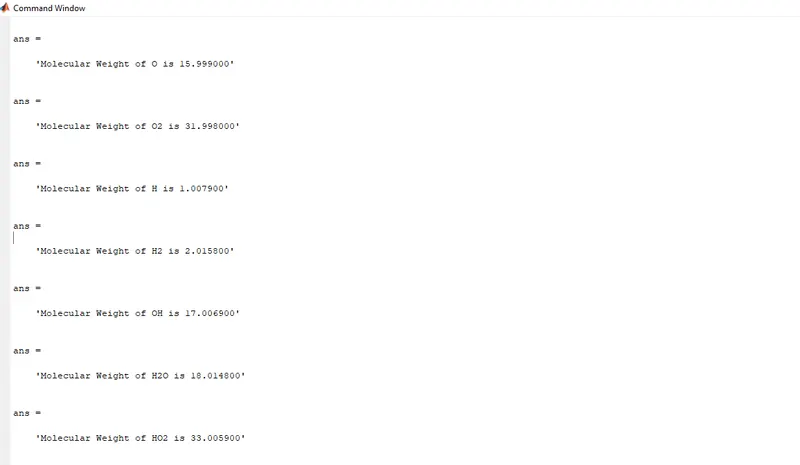
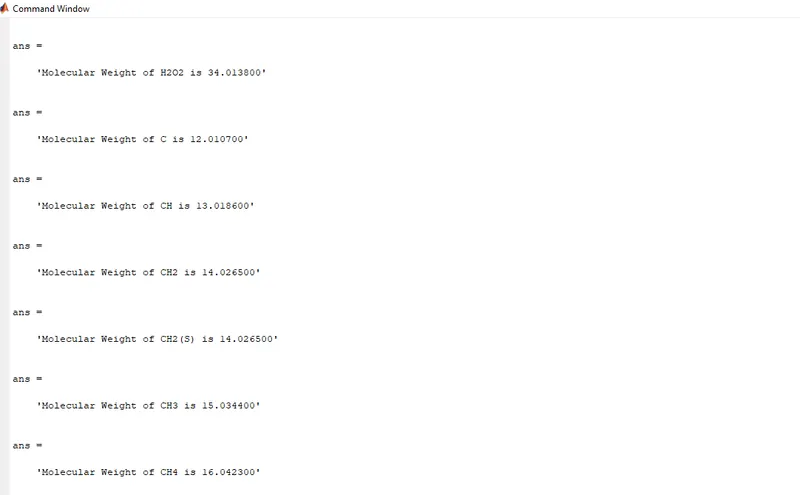
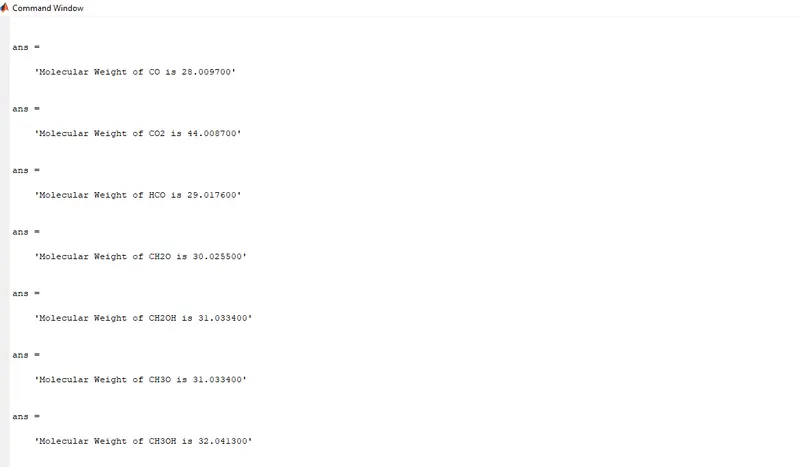
- Towards the end, we have used sprintf command to print the species name and its weight, and all the loop is closed and followed by fclose command to close the file.
Results:
1) O2 Plots:-
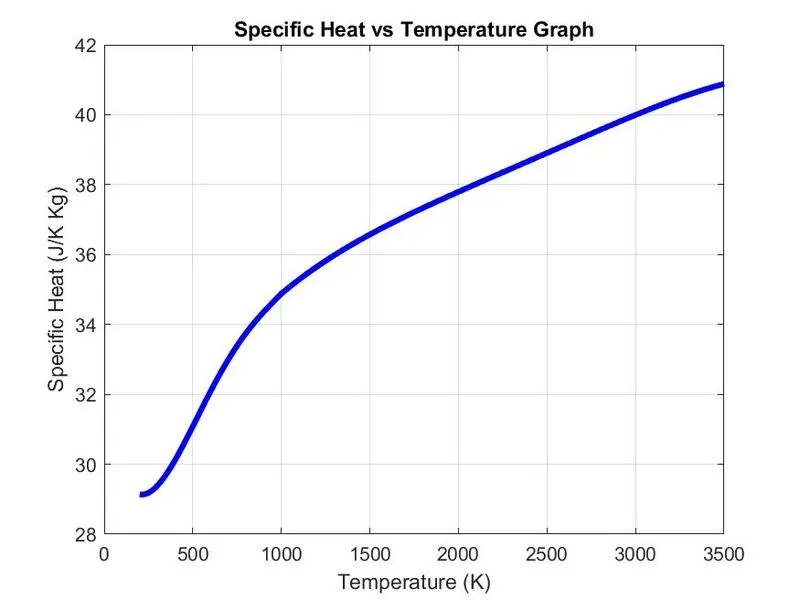
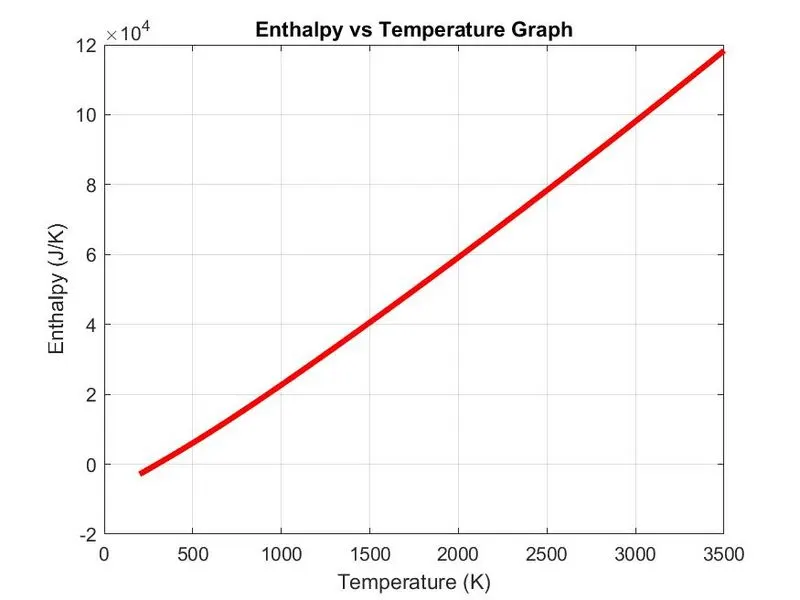
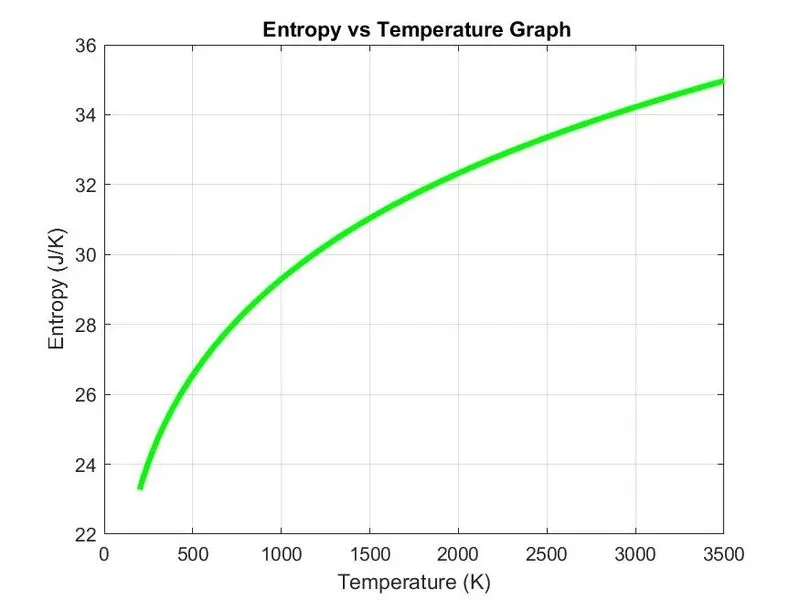
2) N2 Plots:-
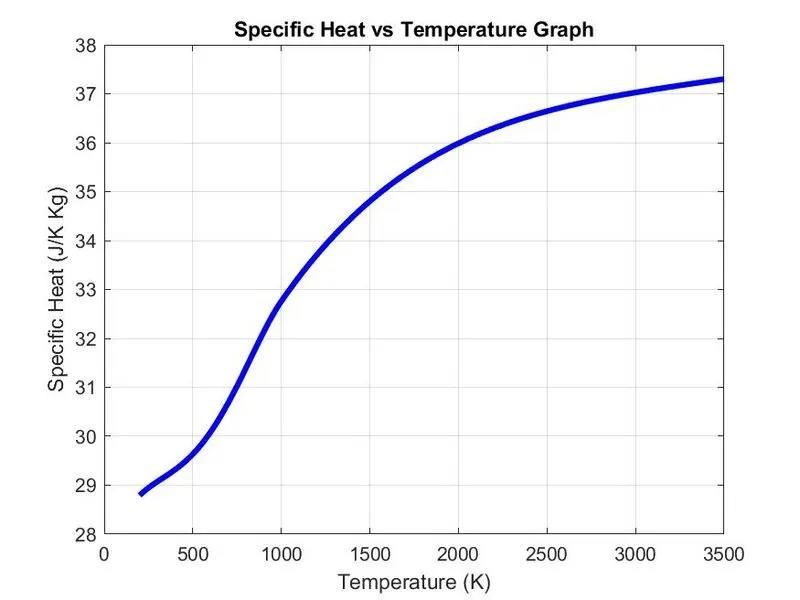
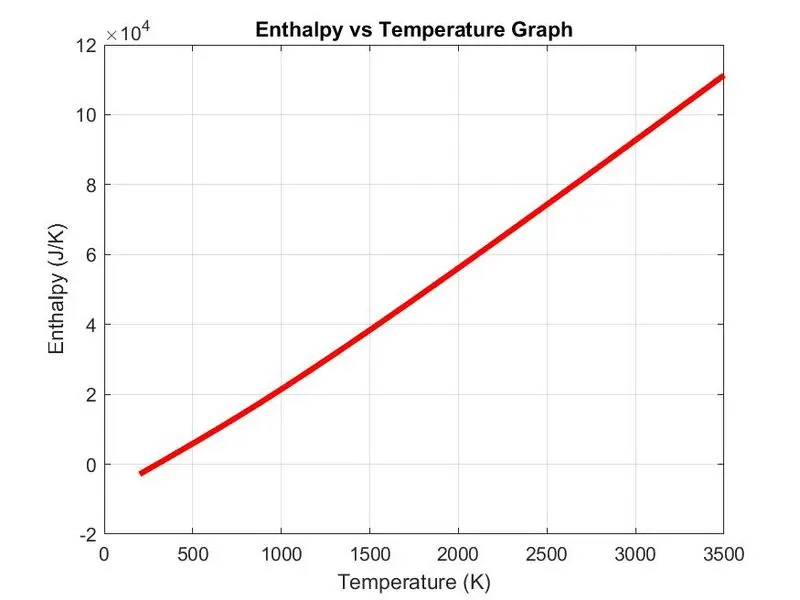
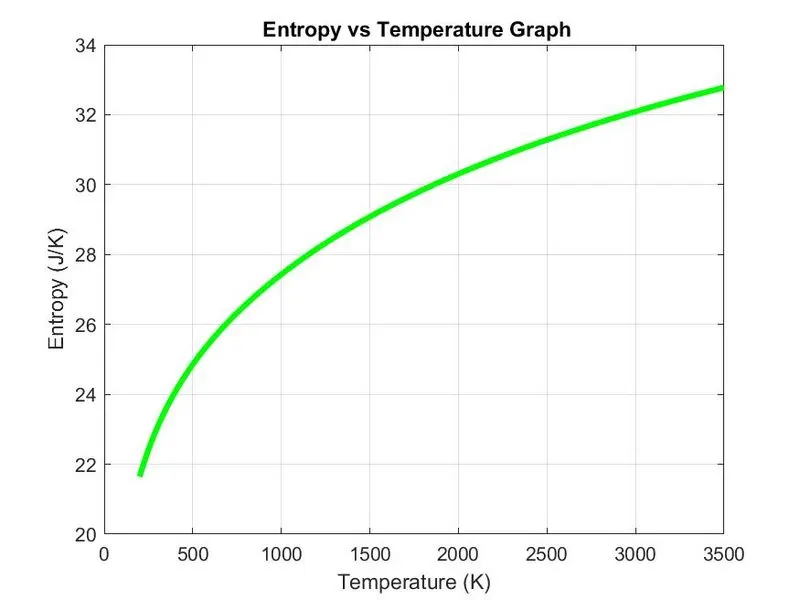
3) Co2 Plots:-
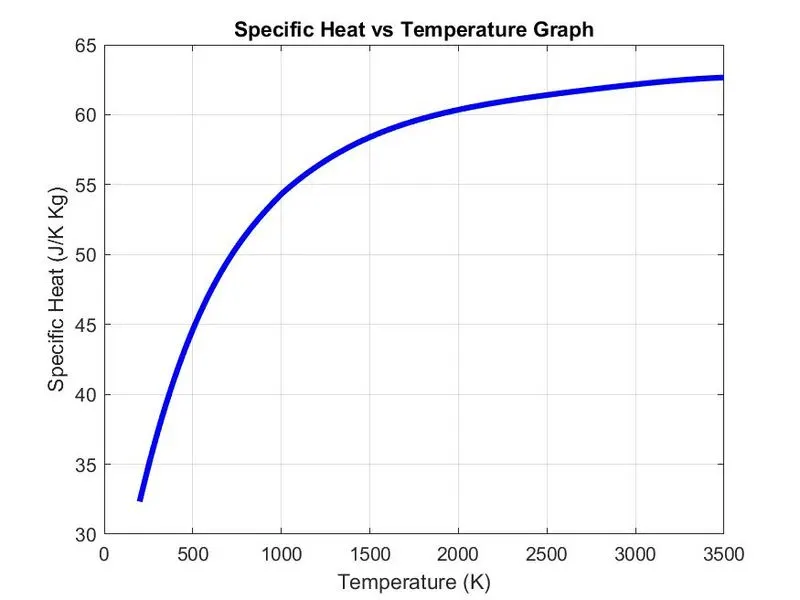
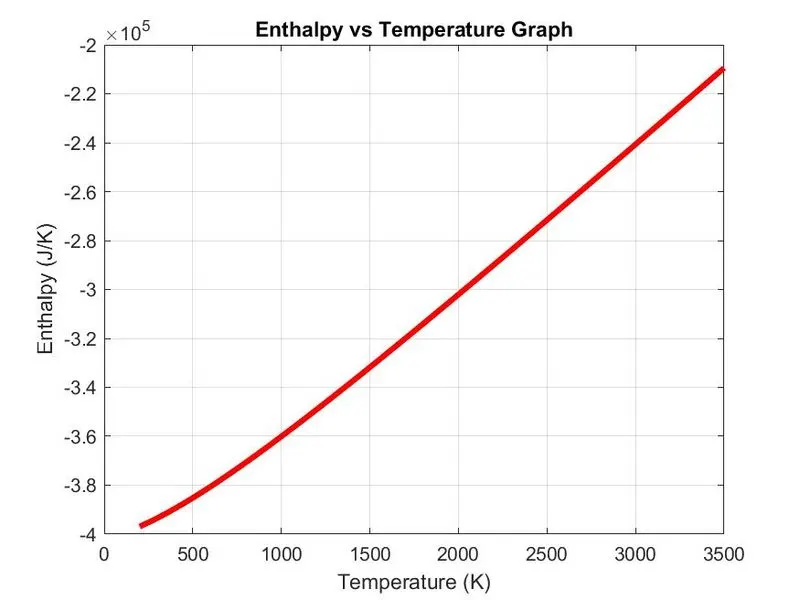
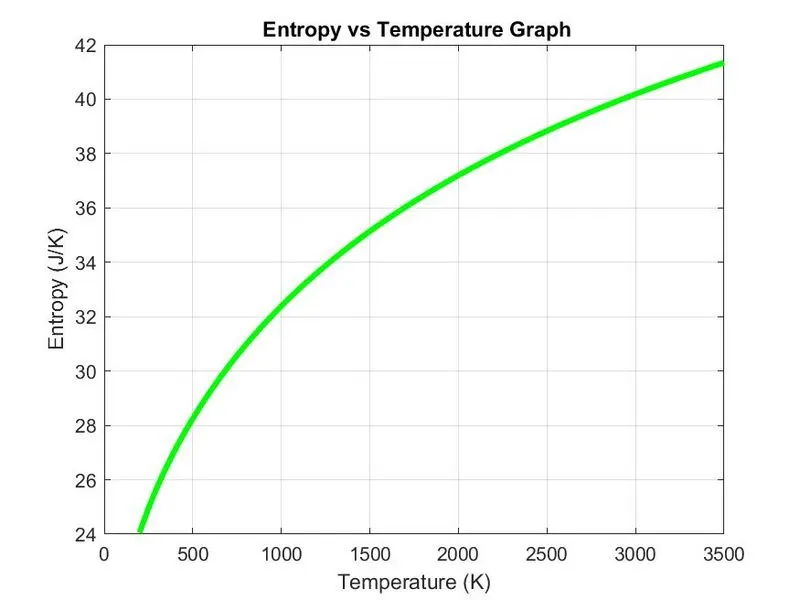
Screenshot of the window where all the folders are saved:

Molecular Weight of Various Species:
Conclusion:
We have successfully parsed or extracted the co-efficient value of each species from the NASA thermodynamics file and plotted the respective species graph for the specific heat, entropy, and enthalpy followed by which we calculated the molecular weight also.
References:
- https://in.mathworks.com/help/matlab/ref/mkdir.html
- https://in.mathworks.com/help/matlab/ref/cd.html
- https://in.mathworks.com/help/matlab/ref/saveas.html
- https://in.mathworks.com/help/matlab/ref/strtok.html
- https://www.britannica.com/science/entropy-physics
- https://www.britannica.com/science/enthalpy
- https://www.britannica.com/science/specific-heat
- https://www.britannica.com/science/molecular-weight
- https://en.wikipedia.org/wiki/Molecular_mass