Project 1 - Parsing NASA thermodynamic data
AIM: To write a function that extracts the 14 coefficients and calculates the enthalpy, entropy, and specific heats for all the species in the given data file.
OBJECTIVES:
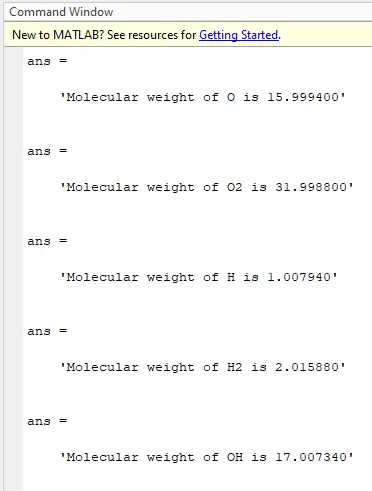
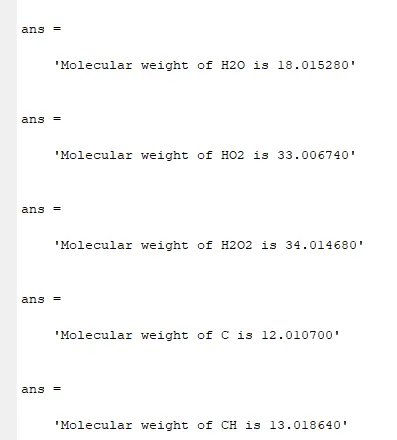
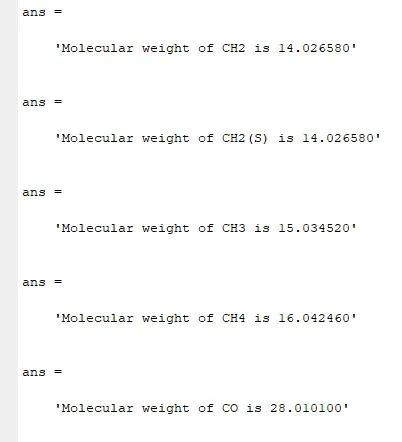
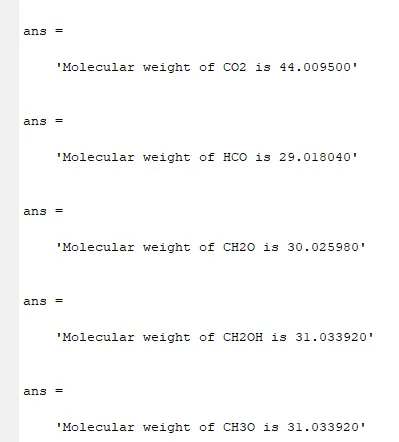
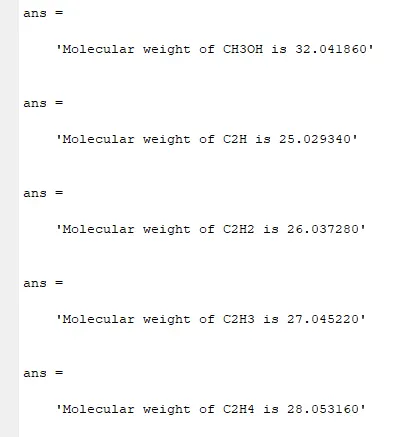
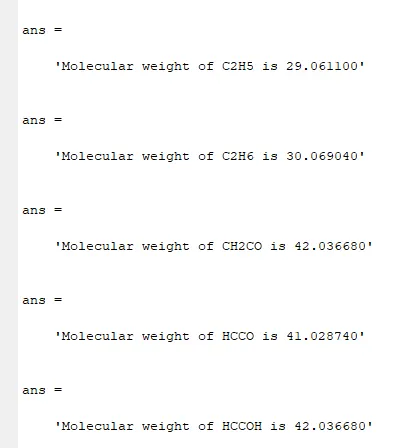
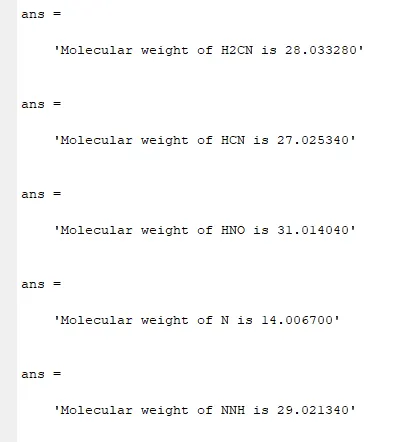
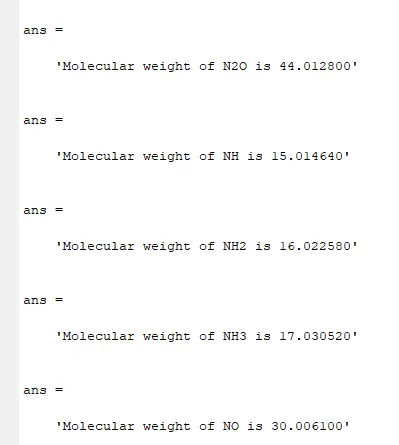
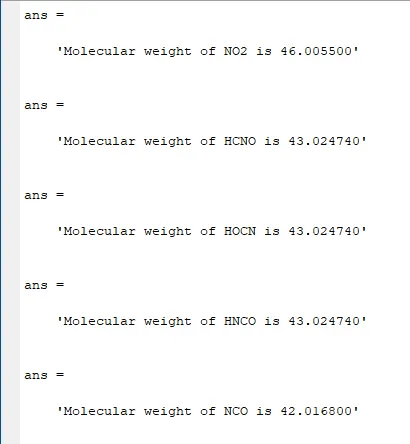
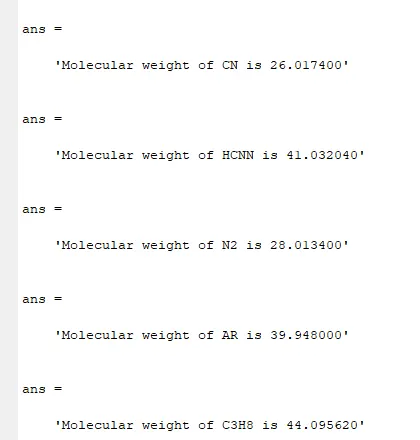
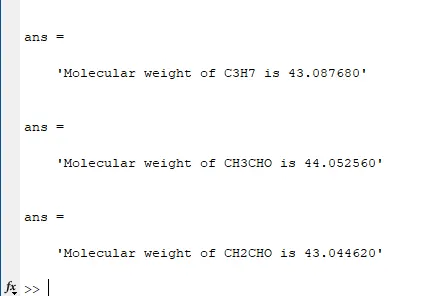
- Calculate the molecular weight of each species and display it in the command window.
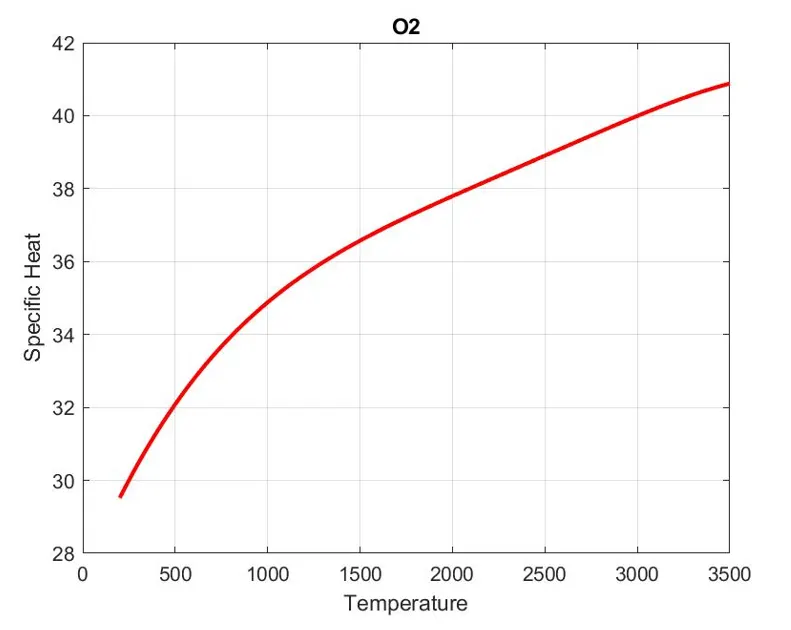
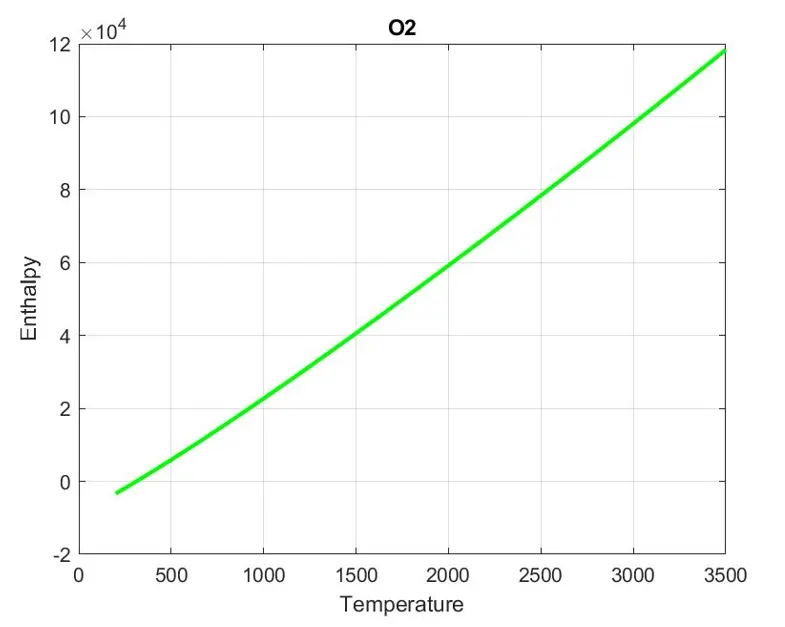
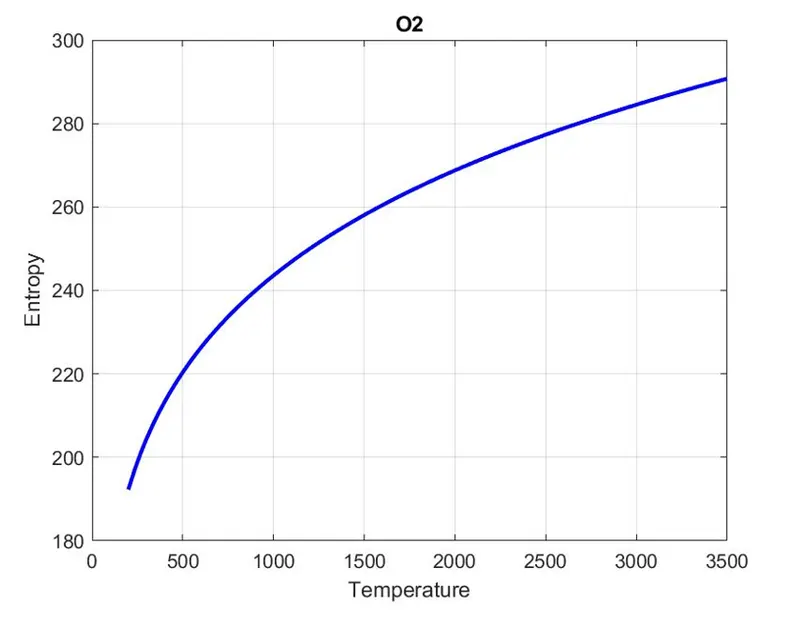
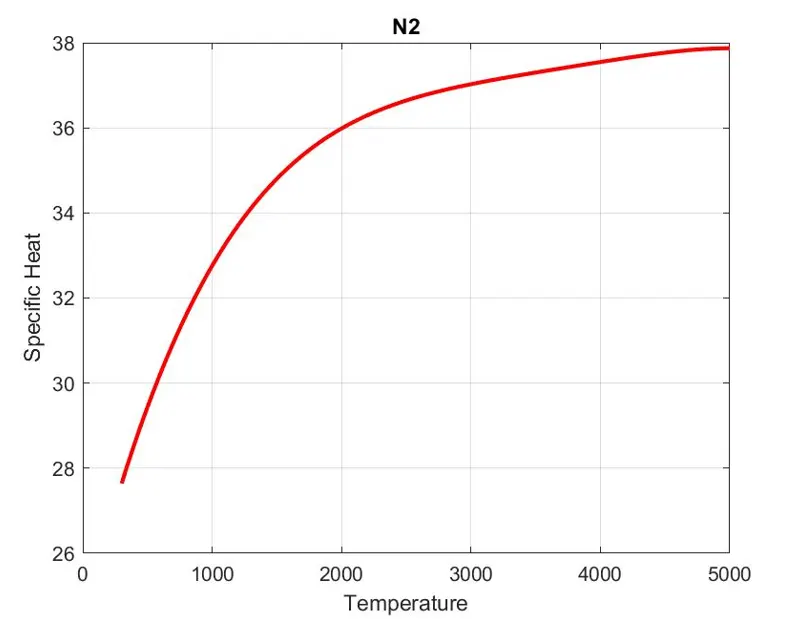
- Plot the Cp, Enthalpy and Entropy for the local temperature range (low temperature: high temperature) specific for each species.
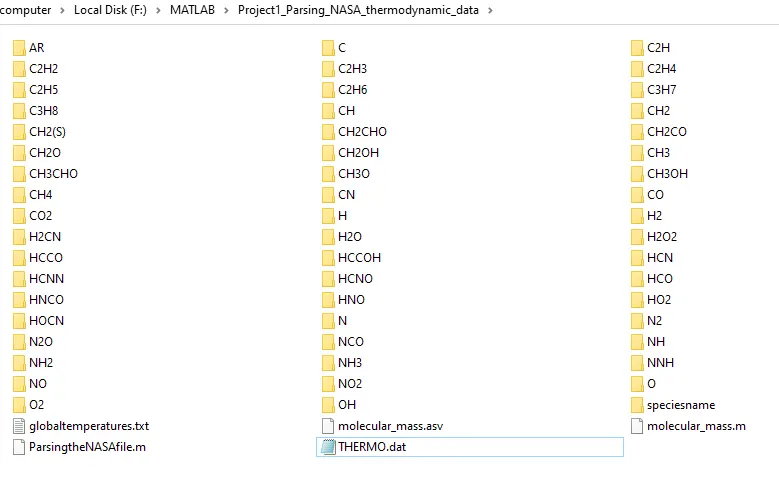
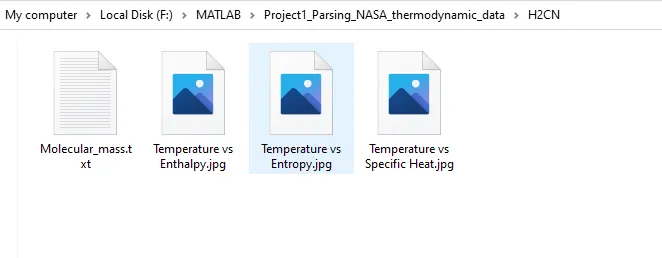
- Save the plots as images with appropriate names and dump them in separate folders for each species with a suitable name.
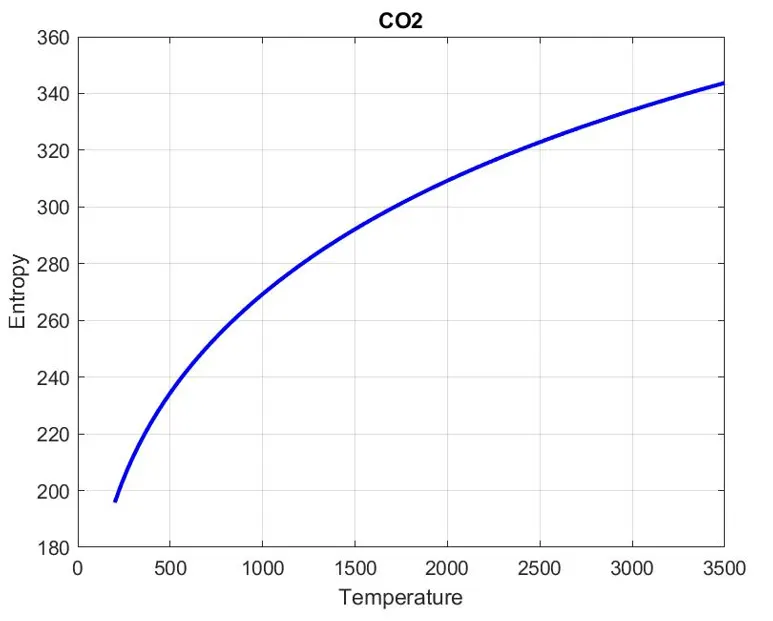
- Plots for o2, N2, and Co2 species.
THEORY:
Parsing a file means reading in a data stream of some sort and building an in-memory model of the semantic content of that data. This aims at facilitating performing some kind of transformation on the data. Parsing in computer languages refers to the syntactic analysis of the input code into its components parts in order to facilitate the writing of compilers and interpreters. It can be used to describe split or separation.
FORMULAE:

Here,
`"Cp = Specific heat, "J/(kg*K)`
`"H = Enthalpy, "J/(kg)`
`"S = Entropy, "J/K`
`"R = Universal gas constant, "8.314 J/(mol*K)`
`"a1, a2,...,a7 = First 7 high temperature coefficients in the data file"`
`"a8, a9,...,a14 = Next 7 low temperature coefficients in the data file"`
`"T = Temperature, T"`
Stepwise explanation of the code:
- Starting the program by clearing all previous data.
- Opening the THERMO data file using fopen().
- fgetl() is used for reading the next lines.
- The first three lines are read by using a for() loop.
- while() function is used to scan the whole document and count the number of species in the file.
- for() loop iterating from 1 to the number of species to read all the species in the file.
- Within the for() loop Specific heat, Enthalpy, and Entropy for each species are calculated and plots are plotted for each type.
- Individual folders are made for each species and the plots are dumped in this folder.
- Then function named molecular_mass is called to calculate the molecular mass of the individual species.
- The molecular mass of each species is stored in a text file and dumped in that folder.
- Finally, the files that are opened are closed.
Main code:
%To write a function that extracts the 14 co-efficients and calculates the enthalpy,
%entropy and specific heats for all the species in the given data file.
clear all
close all
clc

%opening the given data file in read mode
pf = fopen('THERMO.dat','r');
fgetl(pf); %to skip the first line THERMO
tline = fgetl(pf); %to extract the global temperatures
f1 = fopen('globaltemperatures.txt','w'); %opening a file to write the global temperatures

%for reading the next three lines
for y = 1:3
    if(y==1)
        A = strsplit(tline,' ');
        global_low_temp = str2num(A{2});
        global_mid_temp = str2num(A{3});
        global_high_temp = str2num(A{4});
        fprintf(f1,'%fn',global_low_temp);
        fprintf(f1,'%fn',global_mid_temp);
        fprintf(f1,'%fn',global_high_temp);
        fgetl(pf);
    else
        fgetl(pf);
    end
end

%ftell() function to output the current position of the pointer in the file
ft1 = ftell(pf);
ctr = 1;

%while function to count the number of species in the given file
while(1)
    ctr = ctr +1;
    ct = fgetl(pf);
    if ct==-1
        break
    end
end
ctr = ctr/4;
counter = round(ctr);

%fseek() function to fix the pointer to a certain position in the file
fseek(pf,ft1,'bof')
tline = fgetl(pf);

%for loop to read the rest of the lines and to plot the graphs
for i = 1:counter-1 %loop from 1st species to the last species
    % -1 because, the next line is counted while counting

    n = 1;
    a = findstr(tline,' ');
    speciesname = tline(1:a(n)-1);
    mkdir(['F:MATLABProject1_Parsing_NASA_thermodynamic_data',speciesname]);%opens a folder in the ame of the species
    c = tline(a(end-8)+1:a(end)-4);
    B = strsplit(c,' ' );
    local_low_temp = str2num(B{1});
    local_high_temp = str2num(B{2});
    local_mid_temp = str2num(B{3});

    ft2 = ftell(pf);
    mline = fgetl(pf);
    d = findstr(mline,'E');%to find the positions of 'E'
    %to extract the first 5 coefficients in the first line
    for j = 1:4
        coeff = mline(d(j)-11:d(j+1)-12);
        cf(j) = str2num(coeff);
        if j==4
            coeff = mline(d(j+1)-11:end-5);
            cf(j+1) = str2num(coeff);
        end
    end

    ft3 = ftell(pf);
    nline = fgetl(pf);
    %to extract the next 5 coefficients in the second line
    for k = 1:4
        coeff = nline(d(k)-11:d(k+1)-12);
        cf(k+5) = str2num(coeff);
        if k==4
            coeff = nline(d(k+1)-10:end-5);
            cf(k+1+5) = str2num(coeff);
        end
    end

    ft4 = ftell(pf);
    pline = fgetl(pf);
    %to extract the next 4 coefficients in the third line
    for m = 1:3
        coeff = pline(d(m)-11:d(m+1)-12);
        cf(m+5+5) = str2num(coeff);
        if m==3
            coeff = pline(d(m+1)-10:end-5);
            cf(m+1+5+5) = str2num(coeff);
        end
    end

    %to write all the 14 coefficients of the species to its respective
    %variable
    a1 = cf(1);
    a2 = cf(2);
    a3 = cf(3);
    a4 = cf(4);
    a5 = cf(5);
    a6 = cf(6);
    a7 = cf(7);
    a8 = cf(8);
    a9 = cf(9);
    a10 = cf(10);
    a11 = cf(11);
    a12 = cf(12);
    a13 = cf(13);
    a14 = cf(14);

    T = linspace(local_low_temp ,local_high_temp,100);
    R = 8.314;

    %to calculate enthalpy, entropy and specific heats from local low
    %temperatures to local high temperatures
    for s = 1:length(T)
        if T(s)>local_mid_temp
            Cp =(a1+a2.*T+a3.*T.^2+a4.*T.^3+a5.*T.^4).*R;
            H =((a1+(a2.*T)./2)+((a3.*(T.^2))./3)+((a4.*(T.^3))./4)+((a5.*(T.^4))./5)+(a6./T)).*T.*R;
            S =(a1.*log(T)+(a2.*T)+((a3.*(T.^2))./2)+((a4.*(T.^3))./3)+((a5.*(T.^4))./4)+a7).*R;
        else
            Cp =(a8+a9.*T+a10.*T.^2+a11.*T.^3+a12.*T.^4).*R;
            H =((a8+(a9.*T)./2)+((a10.*(T.^2))./3)+((a11.*(T.^3))./4)+((a12.*(T.^4))./5)+(a13./T)).*T.*R;
            S =(a8.*log(T)+(a9.*T)+((a10.*(T.^2))./2)+((a11.*(T.^3))./3)+((a12.*(T.^4))./4)+a14).*R;
        end
    end

  %to plot Temperature vs Specific Heat grpah
  figure(1)
  plot(T,Cp,'color','r','linewidth',2)
  title(speciesname)
  xlabel('Temperature')
  ylabel('Specific Heat')
  grid on

  %to plot Temperature vs Enthalpy graph
  figure(2)
  plot(T,H,'color','g','linewidth',2)
  title(speciesname)
  xlabel('Temperature')
  ylabel('Enthalpy')
  grid on

  %to plot Temperature vs Entropy graph
  figure(3)
  plot(T,S,'color','b','linewidth',2)
  title(speciesname)
  xlabel('Temperature')
  ylabel('Entropy')
  grid on

  %cd() is used to navigate to the current directory
  cd(['F:MATLABProject1_Parsing_NASA_thermodynamic_data',speciesname]);

  %dumping the plots in its respective folders
  saveas(1,'Temperature vs Specific Heat','jpg')
  saveas(2,'Temperature vs Enthalpy','jpg')
  saveas(3,'Temperature vs Entropy','jpg')
  cd('F:MATLABProject1_Parsing_NASA_thermodynamic_data')

  %function to pass the spciesname, inturn the Molecular mass is calculated
  %for each species
  MolM = molecular_mass(speciesname);

  %to prnt the molecular mass in the command window
  sprintf('Molecular weight of %s is %f',speciesname,MolM)
  cd(['F:MATLABProject1_Parsing_NASA_thermodynamic_data',speciesname]);

  %opening a file to write the Molecular mass of each species in its
  %respective folders
  MolMwr = fopen('Molecular_mass.txt','w');
  fprintf(MolMwr,'Molecular mass of this species is %f',MolM);
  cd('F:MATLABProject1_Parsing_NASA_thermodynamic_data')
  fclose(MolMwr);

  tline = fgetl(pf);

end

fclose(pf);
molecular_mass() function code:
%function to calculate molecular mass of a species
function MolM = molecular_mass(speciesname)

elements = ['H', 'C', 'N', 'O', 'A'];%basic elements
atomic_mass = [1.00794 12.0107 14.0067 15.9994 39.948];%atomic masses of basic elements
MolM = 0;

%for() loop to add each element's atomic mass in a species
for i = 1:length(speciesname)
    for j = 1:length(elements)
        if strcmp(speciesname(i), elements (j))
            MolM = MolM + atomic_mass(j);
            u = j;
        end
    end
    n = str2num(speciesname (i));
    if n>1
        MolM = MolM+atomic_mass(u)*(n-1);
    end
end
PLOTS FOR THE ABOVE PROGRAM CODE:
O2:
Specific Heat vs Temperature:
Enthalpy vs Temperature:
Entropy vs Temperature:
N2:
Specific Heat vs Temperature:
Enthalpy vs Temperature:
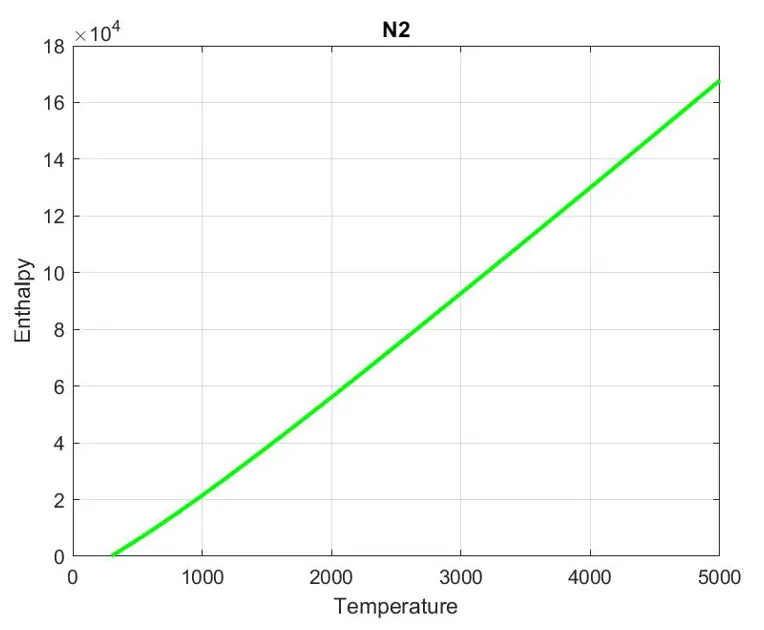
Entropy vs Temperature:
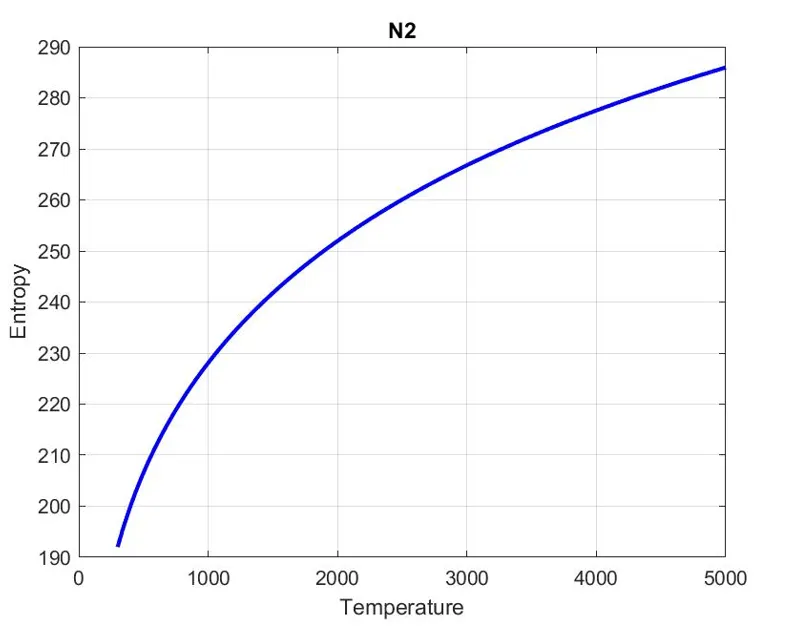
CO2:
Specific Heat vs Temperature:
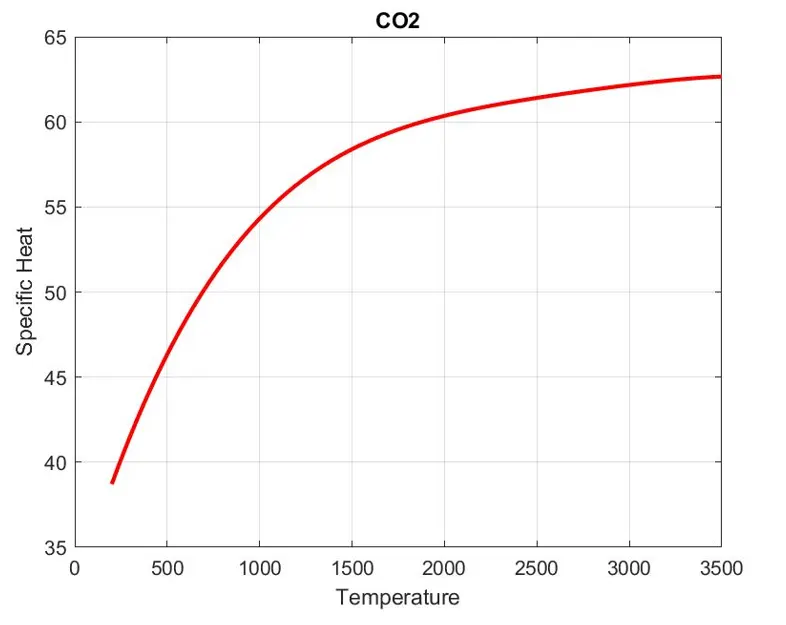
Enthalpy vs Temperature:
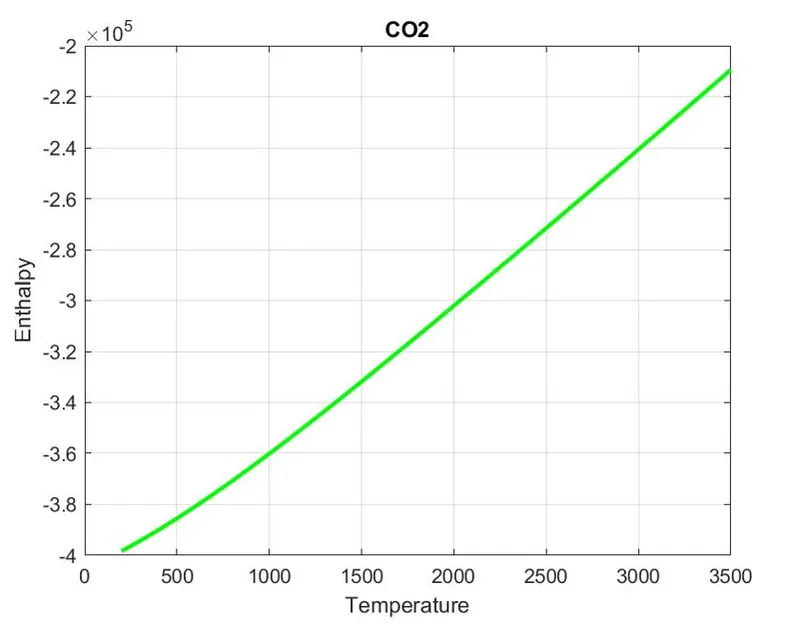
Entropy vs Temperature:
Screenshot of the window where all the folders are saved:
Screenshot of a species folder(here, H2CN):
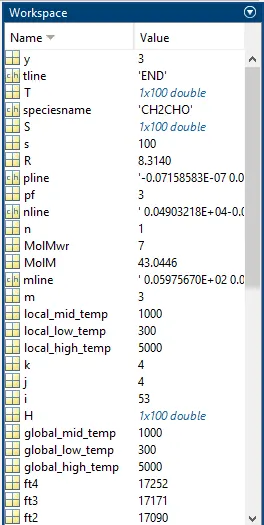
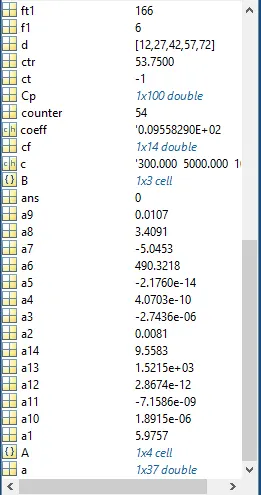
WORKSPACE:
COMMAND WINDOW:
CONCLUSION:
Hence, using the polynomials that NASA came up with can be used to evaluate thermodynamic properties such as Specific heat, Enthalpy, and Entropy, the program code reads the entire THERMO data file and extracts the coefficients. The Specific heat, Enthalpy, and Entropy are calculated for each species. The plots for each species are also done and dumped in separate folders. Also, the molecular weight for each species is calculated and dumped in its respective folders.