Project 1 - Parsing NASA thermodynamic data
Title: Nasa Thermodynamic Data file parsing using MATLAB
Logic: The screenshot of the given data file is attached below. Let's understand the structure of data given in this file.
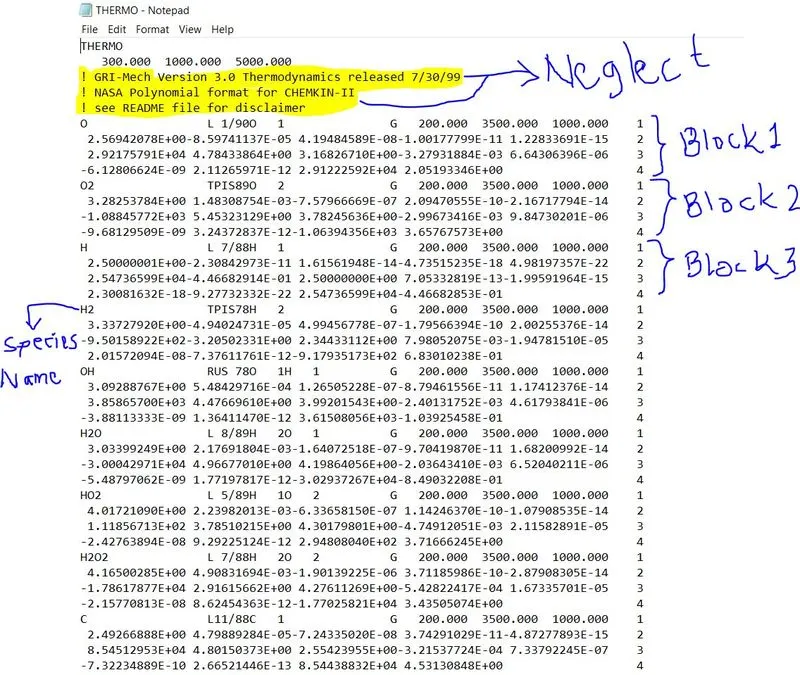
- Reading data from a particular Block:
So, in this file, there are total 53 species blocks are given. Each species block contain 4 lines of data. The 1st line of block gives information about species name, local low, medium and high temperature. The second line of block contain 5 numbers. The third line of block contain 5 numbers while the last line of block contain 4 numbers.
Now to extract data from 1st line, we use "fgetl" command. It will give a string array. We can assign this string array to any variable. Let's say "lineW" be the name of the variable. Now we have to convert this string array to cell array ("component1"). We can using string split (strsplit) command to do so. And then we can Extract the required data from the cell array
The folloowing are the lines of code written in MATLAB for 1st line:
lineW=fgetl(p);           % read 1st line of block and save the string as lineW
    component1=strsplit(lineW,' ');                % Extract the data from 1st line in
                                                     the form of cell array
    sp_name=component1{1};                         % name of species is 1st element of
                                                     cell array
    local_low_temp=str2num(component1{end-3});     % convert 4th element from last from
                                                    string to num and assign it to local
                                                    low temperature
    local_high_temp=str2num(component1{end-2});    % convert 3rd element from last from
                                                     string to num and assign it to local
                                                     high temperature
    local_medium_temp=str2num(component1{end-1});  % convert 2ndd element from last from
                                                     string to num and assign it to local
                                                     medium temperatre
To read next line of the block, again use "fgetl" command. But now we have to seperate 5 numbers from each other. We can do it by finding location of letter 'E' in the given string. We can use string find (strfind) commabd to do so. And then we can convert string to number as well as slice the string to seperate the numbers. The same procedure is applied for line 3 and 4.
The matlab code is given below:
lineX=fgetl(p);                       % read 2nd line of current block and save the
                                       string as lineX
    component2=strfind(lineX,'E');    % from given string, obtain location of letter 'E'
                                       and save the array of location as component2.
    a1=str2num(lineX(1:component2(1)+3));  % obtain 1st value (a1) by converting the
                                         sliced string from location 1 to "E+3" into num
    a2=str2num(lineX(component2(1)+4:component2(2)+3));   % obtain 2nd value (a2) by
                                                          converting the sliced string
                                                      from location "E+4" to next "E+3"
    a3=str2num(lineX(component2(2)+4:component2(3)+3));
    a4=str2num(lineX(component2(3)+4:component2(4)+3));
    a5=str2num(lineX(component2(4)+4:component2(5)+3));

    lineY=fgetl(p);
    component3=strfind(lineY,'E');
    a6=str2num(lineY(1:component3(1)+3));
    a7=str2num(lineY(component3(1)+4:component3(2)+3));
    b1=str2num(lineY(component3(2)+4:component3(3)+3));
    b2=str2num(lineY(component3(3)+4:component3(4)+3));
    b3=str2num(lineY(component3(4)+4:component3(5)+3));

    lineZ=fgetl(p);
    component4=strfind(lineZ,'E');
    b4=str2num(lineZ(1:component4(1)+3));
    b5=str2num(lineZ(component4(1)+4:component4(2)+3));
    b6=str2num(lineZ(component4(2)+4:component4(3)+3));
    b7=str2num(lineZ(component4(3)+4:component4(4)+3));
Since there are 53 blocks, we can use "for loops". By using for loops we can reperat procedure for 53 times. And each time whenever "fgetl" command is executed inside the loop, the MATLAB exact information from succeeding line from the given file.
- Reading the header information:
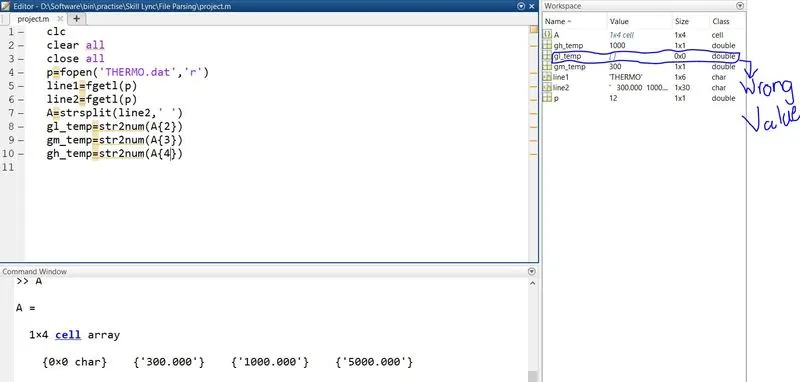
Header is present at the starting of file. We can use "fgetl" command. In line 2, we have information regarding global low, medium and high temperature. We can get it by using "fgetl" and then using string split command to get a cell array and finally assign each element from cell array to its respective variable by cnverting string to number.
The entire code is given below:
clc
clear all
close all
R=8.314;                      % Universal Gas Constant in KJ/Kmol-K
p=fopen('THERMO.dat','r')    % Open file "THERMO.dat'
line1=fgetl(p)               % read 1st line
line2=fgetl(p)               % read 2nd line
A=strsplit(line2,' ');        % split the string "line2" to form a cell array
gl_temp=str2num(A{2});        % convert 2nd element of cell array from string to num
                               and assign it to global low temperature
gm_temp=str2num(A{3});        % convert 3rd element of cell array from string to num
                                and assign it to global medium temperature
gh_temp=str2num(A{4});        % convert 4th element of cell array from string to num
                                and assign it to global high temperature
skip1=fgetl(p);              % skip line 3
skip2=fgetl(p);              % skip line 4
skip3=fgetl(p);              % skip line 5
for sp_no=1:53               % use for loop to collect data from block 1 to block 53
    lineW=fgetl(p);           % read 1st line of block and save the string as lineW
    component1=strsplit(lineW,' ');                % Extract the data from 1st line in
                                                     the from of cell array
    sp_name=component1{1};                         % name of species is 1st element of
                                                    cell array
    local_low_temp=str2num(component1{end-3});     % convert 4th element from last from
                                                     string to num and assign it to
                                                     local low temperature
    local_high_temp=str2num(component1{end-2});    % convert 3rd element from last from
                                                     string to num and assign it to
                                                     local high temperature
    local_medium_temp=str2num(component1{end-1});  % convert 2ndd element from last
                                                     from string to num and assign it
                                                     to local medium temperatre

    lineX=fgetl(p);                 % read 2nd line of current block and save the
                                     string as lineX
    component2=strfind(lineX,'E');  % from given string, obtain location of letter 'E'
                                     and save the array of location as component2.
    a1=str2num(lineX(1:component2(1)+3));  % obtain 1st value (a1) by converting the
                                             sliced string from location 1 to "E+3"
                                             into num
    a2=str2num(lineX(component2(1)+4:component2(2)+3));   % obtain 2nd value (a2) by c
                                                           onverting the sliced string
                                                           from location "E+4" to next
                                                            "E+3"
    a3=str2num(lineX(component2(2)+4:component2(3)+3));
    a4=str2num(lineX(component2(3)+4:component2(4)+3));
    a5=str2num(lineX(component2(4)+4:component2(5)+3));

    lineY=fgetl(p);
    component3=strfind(lineY,'E');
    a6=str2num(lineY(1:component3(1)+3));
    a7=str2num(lineY(component3(1)+4:component3(2)+3));
    b1=str2num(lineY(component3(2)+4:component3(3)+3));
    b2=str2num(lineY(component3(3)+4:component3(4)+3));
    b3=str2num(lineY(component3(4)+4:component3(5)+3));

    lineZ=fgetl(p);
    component4=strfind(lineZ,'E');
    b4=str2num(lineZ(1:component4(1)+3));
    b5=str2num(lineZ(component4(1)+4:component4(2)+3));
    b6=str2num(lineZ(component4(2)+4:component4(3)+3));
    b7=str2num(lineZ(component4(3)+4:component4(4)+3));

    T=linspace(local_low_temp,local_high_temp,250);     % obtain 250 values of
                                                          temperature
    sp_heat=specific_heat(local_low_temp,local_medium_temp,local_high_temp,a1,a2,a3,a4,a5,a6,a7,b1,b2,b3,b4,b5,b6,b7,T);
    Enthalpy=enthalpy(local_low_temp,local_medium_temp,local_high_temp,a1,a2,a3,a4,a5,a6,a7,b1,b2,b3,b4,b5,b6,b7,T);
    Entropy=entropy(local_low_temp,local_medium_temp,local_high_temp,a1,a2,a3,a4,a5,a6,a7,b1,b2,b3,b4,b5,b6,b7,T);

    % Creating Folder for each species:
    mkdir('D:\Software\bin\practise\Skill Lync\File Parsing\Element Properties\',sp_name);                          % create new folder and change the
                                                  current directory to that folder
    % Plotting:
    cd(['D:\Software\bin\practise\Skill Lync\File Parsing\Element Properties\',sp_name]);            % change the directory to that location where plots
                                    are to be saved.
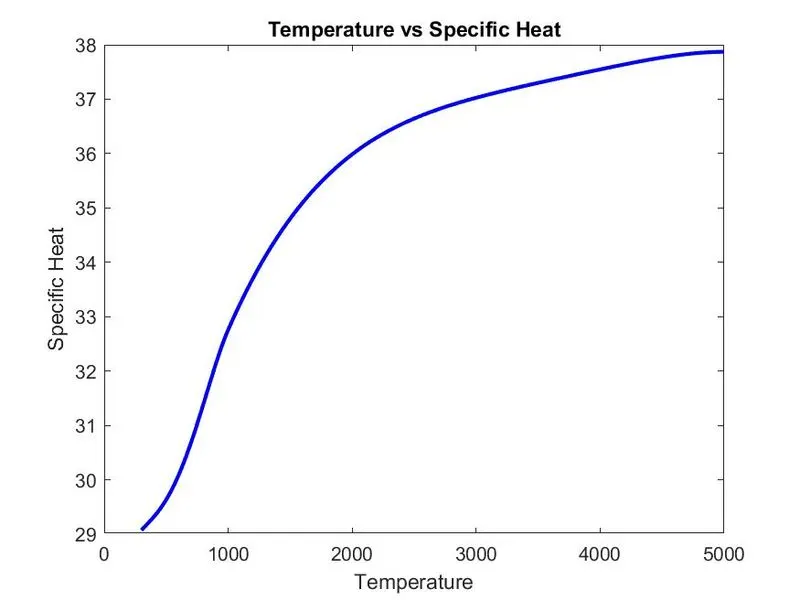
    figure(1)
    plot(T,sp_heat,'color','b','linewidth',2);
    xlabel('Temperature');
    ylabel('Specific Heat');
    title('Temperature vs Specific Heat');

    saveas(1,'Specific Heat.jpg');         % save the plot in new directory/location

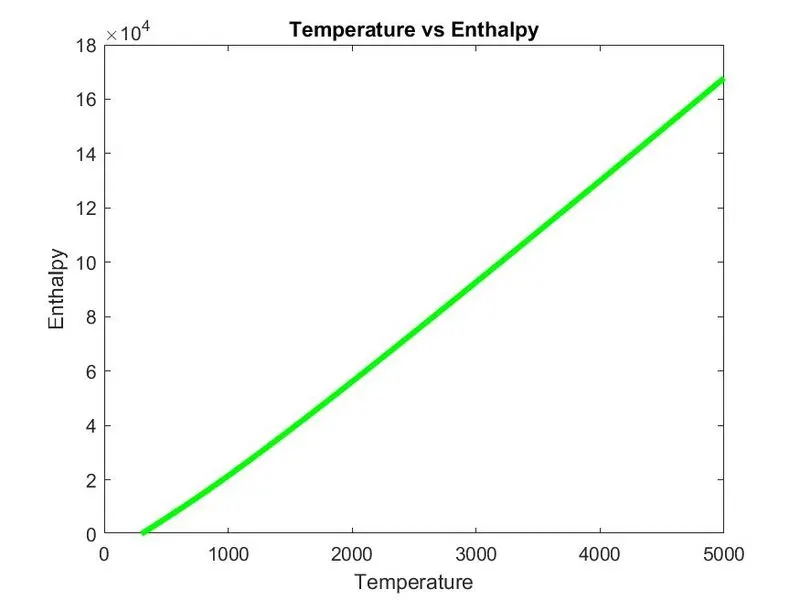
    figure(2)
    plot(T,Enthalpy,'color','g','linewidth',3);
    xlabel('Temperature');
    ylabel('Enthalpy');
    title('Temperature vs Enthalpy');

    saveas(2,'Enthalpy.jpg');

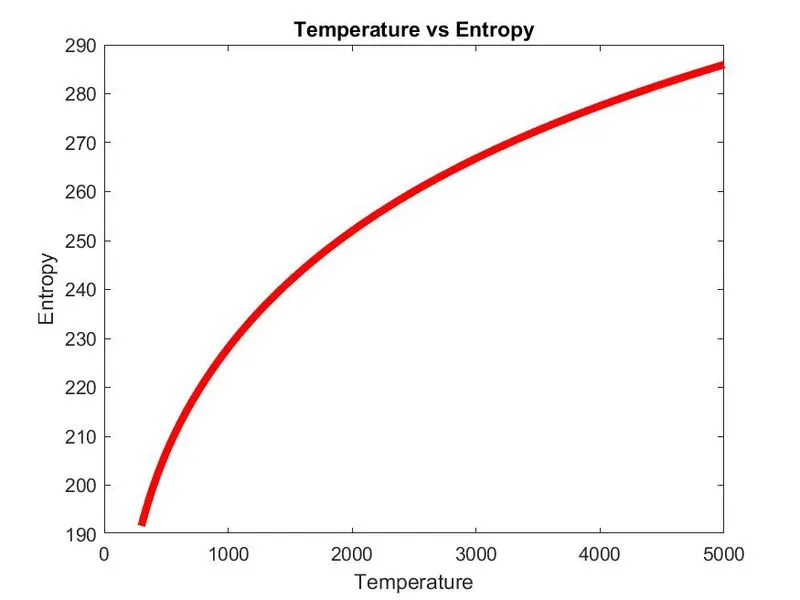
    figure(3)
    plot(T,Entropy,'color','r','linewidth',4);
    xlabel('Temperature');
    ylabel('Entropy');
    title('Temperature vs Entropy');

    saveas(3,'Entropy.jpg');

    % Calling function for molar mass:

    molecular_weight=molar_mass(sp_name)
end

fclose(p)
- The formula for calculating enthalpy, entropy and specific heat is given below

Function for Specific_Heat:
function[cp]=specific_heat(local_low_temp,local_medium_temp,local_high_temp,a1,a2,a3,a4,a5,a6,a7,b1,b2,b3,b4,b5,b6,b7,T)
R=8.314
for i=1:length(T)
    if (T(i)>local_medium_temp)
         cp(i)=R*(a1+(a2*T(i))+(a3*(T(i)^2))+(a4*(T(i)^3))+(a5*(T(i)^4)))
    else
         cp(i)=R*(b1+(b2*T(i))+(b3*(T(i)^2))+(b4*(T(i)^3))+(b5*(T(i)^4)))
    end
end
end
Function for Enthalpy:
function[H]=enthalpy(local_low_temp,local_medium_temp,local_high_temp,a1,a2,a3,a4,a5,a6,a7,b1,b2,b3,b4,b5,b6,b7,T)
R=8.314
for i=1:length(T)
     if T(i)>local_medium_temp
         H(i)=R*T(i)*(a1+((a2*T(i))/2)+((a3*(T(i)^2))/3)+((a4*T(i)^3)/4)+((a5*T(i)^4)/5)+(a6/T(i)))
     else
         H(i)=R*T(i)*((b1+(b2*T(i))/2)+((b3*T(i)^2)/3)+((b4*T(i)^3)/4)+((b5*T(i)^4)/5)+(b6/T(i)))
     end
end
end
Function for entropy:
function[S]=entropy(local_low_temp,local_medium_temp,local_high_temp,a1,a2,a3,a4,a5,a6,a7,b1,b2,b3,b4,b5,b6,b7,T)
R=8.314
for i=1:length(T)
     if T(i)>local_medium_temp
          S(i)=R*(a1*log(T(i))+(a2*T(i))+(a3/2)*(T(i)^2)+(a4/3)*(T(i)^3)+(a5/4)*(T(i)^4)+a7)
     else
          S(i)=R*(b1*log(T(i))+(b2*T(i))+(b3/2)*(T(i)^2)+(b4/3)*(T(i)^3)+(b5/4)*(T(i)^4)+b7)
     end
end
end- How to find molecular weight :
The species name is combination of letters and number. Example, CO2. It means 1 molecule of carbon and 2 molecules of oxygen. Out of all names of 53 species there are some common letters in their names. Those are H,C,N,O,S,Ar. These are names of element which have their own atomic mass. So now we use concept of string find (strfind) to identify which letters are present in the name of the species (which is in the form of string). And then we have to find the location of number in the string and value of that number and then add up the (n-1) atomic mass to current value. Use the concept of "for loops" so that you can check the letters as well as numbers in the given name of the species.
The code for this is given below:
function [mol_weight]=molar_mass(sp_name)
species=upper(sp_name)
elements=['H','C','N','O','S','A']
atomic_weight=[1,12,14,16,32,40]
mol_weight=0;
for i=1:length(species)
    for j=1:length(elements)
        if strcmp(species(i),elements(j))
            mol_weight=mol_weight+atomic_weight(j)
            q=j;
        end
    end
    n=str2num(species(i))
    if n>1
        mol_weight=mol_weight+atomic_weight(q)*(n-1)
    end
end
end
Some examples of finding molecular weights are as follows:
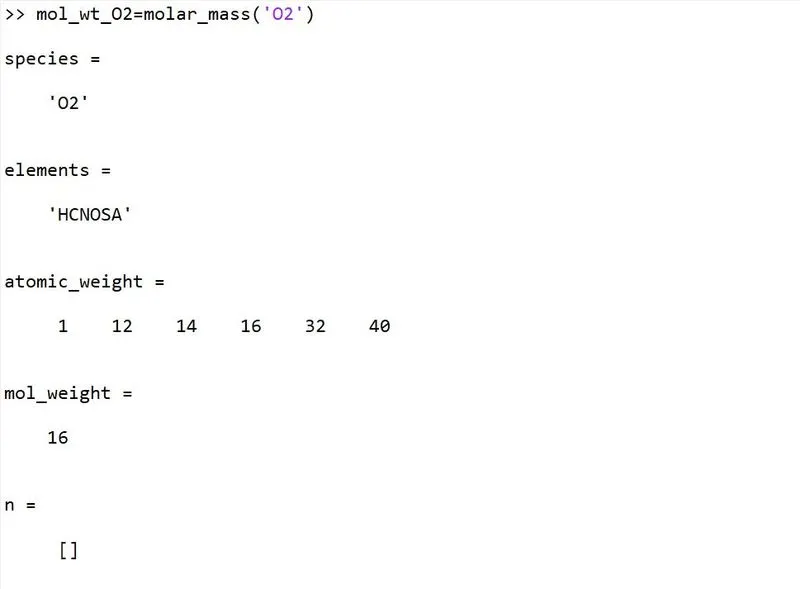

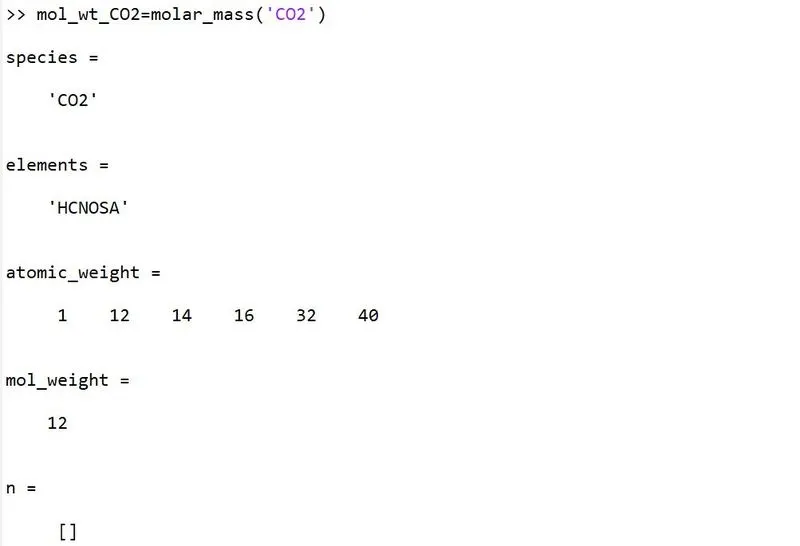
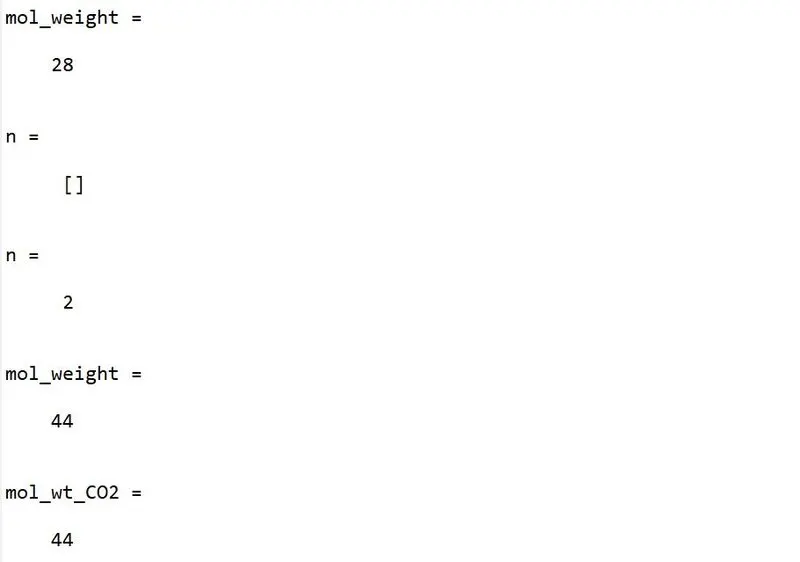
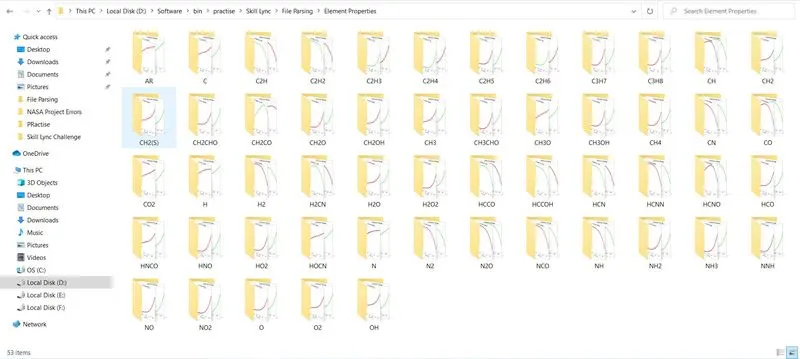
Finally, it is required to save the plots of each species type in its respeive folder. So the screenshot of the above is as follows:
- Plots for O2:
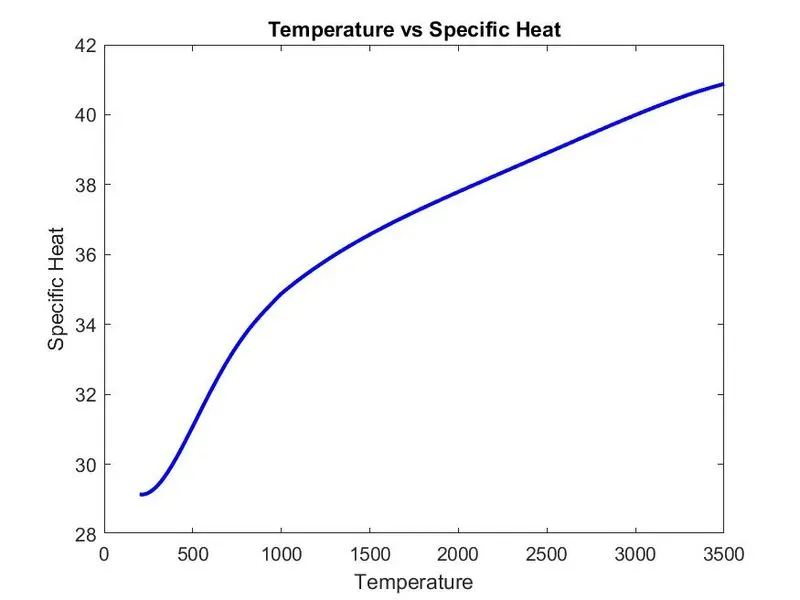
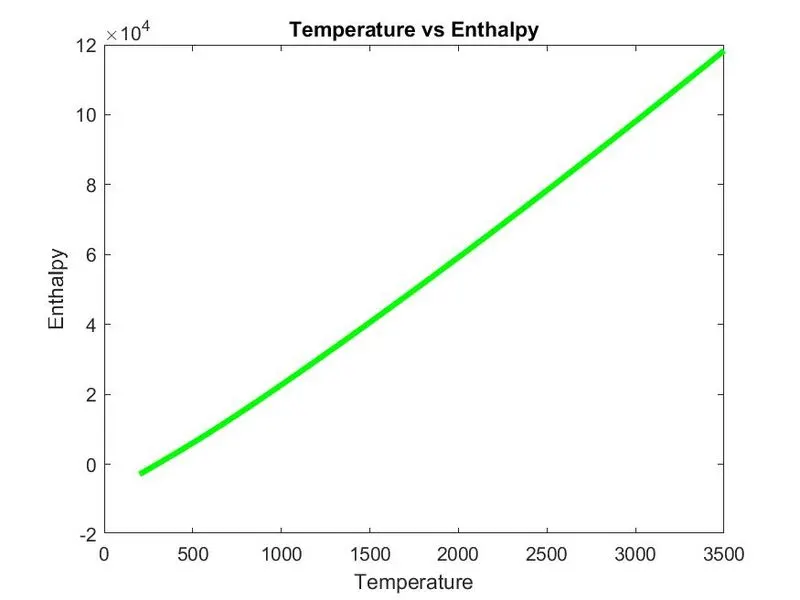
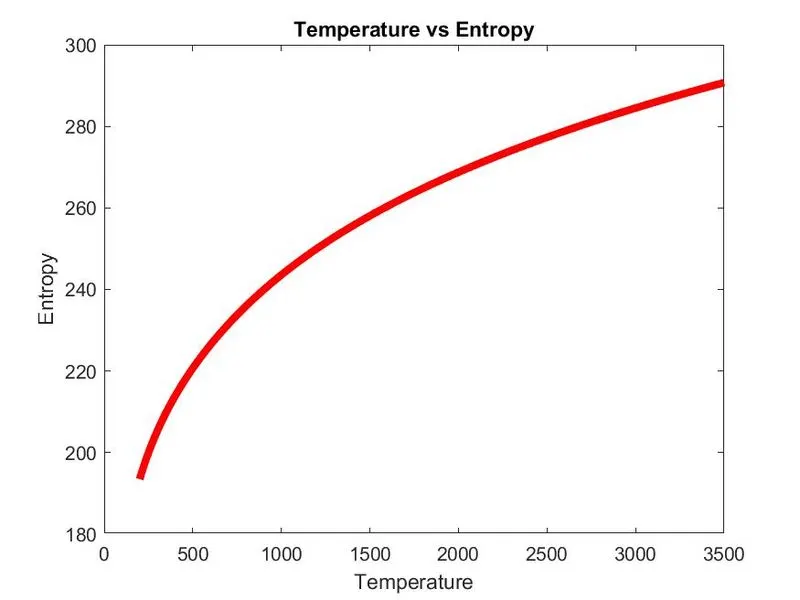
- Plots for N2:
- Plots for CO2:
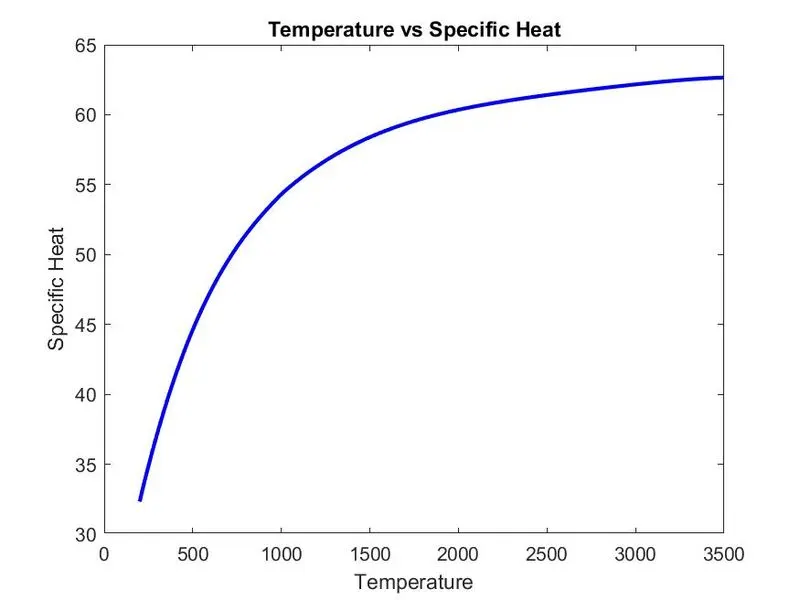
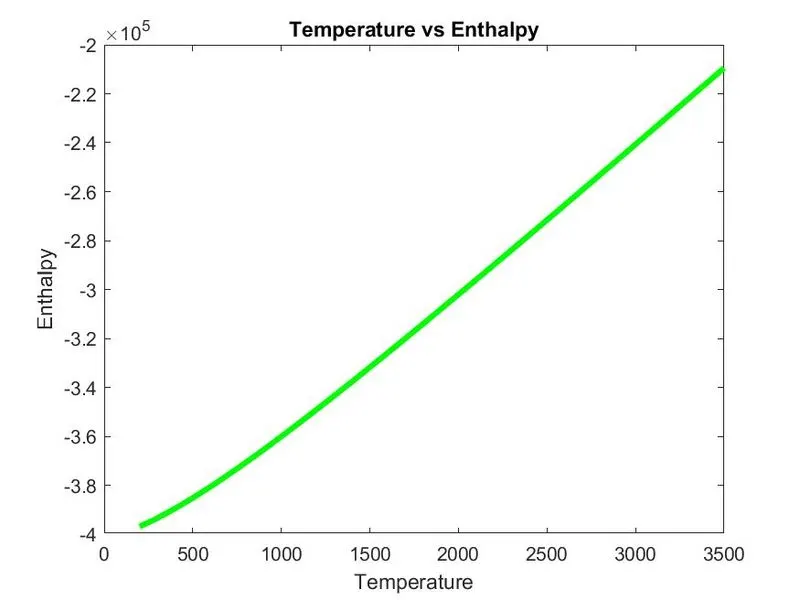
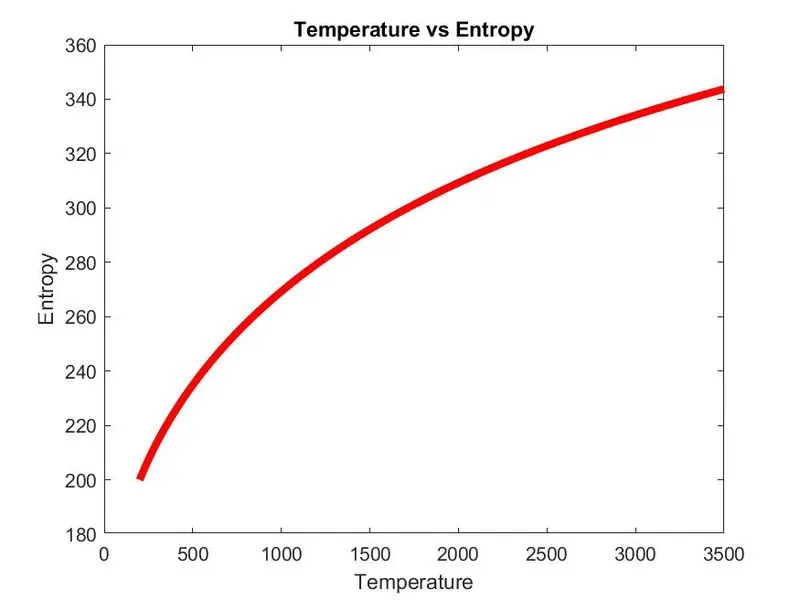
- Errors faced while programming:
The only error I encountered is during extracting values from 1st line of the block. Since in the first line, the number of elements in 1st line string array is different for different species. Some contain 8 some contain 9 and even some of them contain 10 elements. So I was not getting accurte values for low, medium and high local temperature. But one thing is common is that, medium temperature is at location "end-1", high temperature is at location "end-2" and low temperature is at location "end-3". Bu using this logic, I rectified the error.