Project 1 - Parsing NASA thermodynamic data
AIM - To parse the NASA Thermodynamic data using Matlab in order to extract the coefficients and calculate the Specific heat, Enthalpy, and Entropy of different species.
GOVERNING EQUATION - The equation I have applied in the program to calculate the Specific heat(cp), Enthalpy(H), and Entropy(s) are as follows:

In the above fig.
T - Temperature
R - Universal gas constant
a - Constant coefficient
In the data, there are 14 coefficients for which the first seven coefficients(a1-a7) are high-temperature coefficients and the next seven (a8-a14) are low-temperature coefficients.
OBJECTIVE - 1) To extract all 14 coefficients and calculate the Specific heat, Enthalpy, and Entropy of each species given in the data file.
2) To plot the Temperature vs Specific heat, Temperature vs Entropy, Temperature vs Enthalpy of the species to show the variation.
3) To calculate the molecular weight of each species.
THEORY - Parsing -The process of "parsing" can be described as reading in a data stream of some sort and building an in-memory model or representation of the semantic content of that data, to facilitate performing some kind of transformation on the data. or in simple words parsing refers to how information can be read from a particular text file or any type of file and how it can be used in a computer program.
NASA came up with polynomials that can be used to evaluate thermodynamic properties such as Cp, H, and S. They have also documented the coefficients that are required to evaluate these polynomials for 1000+ species. But the data which are given to me as the input are for limited species. The file which is given to me is the THERMO.dat file so I have to write a program in Matlab to read the file and evaluate the parameters. In the file, there are data for all the constant coefficients of each species required to calculate the parameters and it also consists of temperature data. There are a total of 53 species for which I have to calculate the specific heat, Enthalpy, and Entropy.
Now let see in brief what are these parameters like Specific heat, Enthalpy, and Entropy.
Specific heat - Specific heat is the quantity of heat required to raise the temperature of one gram of a substance by one Celsius degree. The units of specific heat are usually calories or joules per gram per Celsius degree. For example, the specific heat of water is 1 calorie (or 4,186 joules) per gram per Celsius degree. so I will be calculating the specific heat by the formulae shown below:

Enthalpy - Enthalpy is a property of a thermodynamic system, and is defined as the sum of the system's internal energy and the product of its pressure and volume. It is a state function used in many measurements in chemical, biological, and physical systems at constant pressure, that is conveniently provided by the large ambient atmosphere. The pressure-volume term expresses the work required to establish the system's physical dimensions, i.e. to make room for it by displacing its surroundings. As a state function, enthalpy depends only on the final configuration of internal energy, pressure, and volume, not on the path taken to achieve it.
The unit of measurement for enthalpy in the International System of Units (SI) is the joule. Other historical conventional units still in use include the calorie. The formulae I will be using in the program for the calculation of enthalpy is shown below:

Entropy - Entropy, the measure of a system’s thermal energy per unit temperature that is unavailable for doing useful work. Because work is obtained from ordered, molecular motion the amount of entropy is also a measure of the molecular disorder, or randomness, of a system. In the program I will be calculating the entropy using the formulae shown below:

Molecular Weight - Molecular weight also called molecular mass, mass of a molecule of a substance, based on 12 as the atomic weight of carbon-12. It is calculated in practice by summing the atomic weights of the atoms making up the substance’s molecular formula.
PROGRAM - As mentioned earlier the file given is the .dat file so first, I will move the given file to the destination where I am going to save my program. Then first I have written the program for the formulae to calculate specific heat, enthalpy, and entropy. So the program for calculating the specific heat is shown below:
% program for calculating speciffic heat(c_p)

function [c_p] = specific_heat(a1,a2,a3,a4,a5,a6,a7,a8,a9,a10,a11,a12,a13,a14,low_temp,mid_temp,high_temp,T,R);
if (T > mid_temp)
    c_p = (a1 + (a2*T) + (a3*(T.^2)) + (a4*(T.^3)) + (a5*(T.^4))).*R;
else
    c_p = (a8 + (a9*T) + (a10*(T.^2)) + (a11*(T.^3)) + (a12*(T.^4))).*R;
end
end
In the above program, I have used the function command which will save the program as a template and this function can be used later to evaluate the parameters. Then specific heat is the name of the function which I will be writing when I have to call this function. The inputs to this function will be all the constants that I will extract from the file and the temperatures.
Then I have used the conditional statement 'if' because I know that the first event coefficients are high-temperature coefficients that means when Temperature(T) is greater than mid-temperature then only it will be called high temperature. so basically here the temperature will be varied as I have to show the variation as well. some temperature will fall in the low-temperature zone and other will fall in the high-temperature zone. Then 'else' command is also used for conditional statements. so the line c_p = (a8 + (a9*T) + (a10*(T.^2)) + (a11*(T.^3)) + (a12*(T.^4))).*R; will be calculating the specific heat of a particular species for the temperatures which are less than mid temperature.
Then as already mentioned T will be an array so I have used the element-wise operator '.' in the calculation. Then I have ended the function as an end is a must for both conditional statements and for the function.
Next, I have written the program for calculating the Enthalpy. The program is shown below:
% For calculating enhtalpy(h)
function [h] = enthalpy(a1,a2,a3,a4,a5,a6,a7,a8,a9,a10,a11,a12,a13,a14,low_temp,mid_temp,high_temp,T,R);
if (T > mid_temp)
    h = (a1+((a2*T)./2)+(a3*((T.^2)./3))+(a4*((T.^3)./4))+(a5*((T.^4)./5))+(a6./T))*R;
else
    h = (a8+((a9*T)./2)+(a10*((T.^2)./3))+(a11*((T.^3)./4))+(a12*((T.^4)./5))+(a13./T))*R;
end
end
For this also I have used the function command which will again create a template for calculating the enthalpy I just have to call the program specifying its name 'enthalpy' and then I have to just give the inputs. The inputs are the same as that was for specific heat calculation. and here also I have used the conditional statements 'if' and 'else' for calculating the enthalpy for the temperatures which are above and below the mid-temperature. so the line (a1+((a2*T)./2)+(a3*((T.^2)./3))+(a4*((T.^3)./4))+(a5*((T.^4)./5))+(a6./T))*R will be calculating the enthalpy for temperatures which are above mid-temperature and the line (a8+((a9*T)./2)+(a10*((T.^2)./3))+(a11*((T.^3)./4))+(a12*((T.^4)./5))+(a13./T))*R will be calculating the enthalpy for temperatures below mid temperature. Then I have used the end command to end the function.
The program for calculating the Entropy is shown below:
% For calculating Entropy(s)
function [s] = entropy(a1,a2,a3,a4,a5,a6,a7,a8,a9,a10,a11,a12,a13,a14,low_temp,mid_temp,high_temp,T,R);
if (T>mid_temp)
    s = (a1*log(T)+a2*T+(a3*((T.^2)/2))+(a4*((T.^3)./3))+(a5*((T.^4)./4))+a7).*R;
else
    s = (a8*log(T)+a9*T+(a10*((T.^2)/2))+(a11*((T.^3)./3))+(a12*((T.^4)./4))+a14).*R;
end
end
For this also I have used the function command which will again create a template for calculating the entropy I just have to call the program specifying its name 'entropy' and then I have to just give the inputs. The inputs are the same as that was for specific heat calculation. and here also I have used the conditional statements 'if' and 'else' for calculating the enthalpy for the temperatures which are above and below the mid-temperature. so the line (a1*log(T)+a2*T+(a3*((T.^2)/2))+(a4*((T.^3)./3))+(a5*((T.^4)./4))+a7).*R will be calculating the entropy for temperatures which are above mid-temperature and the line (a8*log(T)+a9*T+(a10*((T.^2)/2))+(a11*((T.^3)./3))+(a12*((T.^4)./4))+a14).*R will be calculating the entropy for temperatures below mid temperature. Then I have used the end command to end the function.
so now my programs for calculating the specific heat, entropy, and enthalpy have been completed and I will call these functions in the main program.
The main program is shown below:
% program for file parsing of NASA Thermodynamic data
clear all
close all
clc
% Getting the data
f1 = fopen('THERMO.dat','r');

tline = fgetl(f1);
tline1 = fgetl(f1);
A=strsplit(tline1,' ');

% Extracting the temperature data
t1 = str2double(A{2});
t2 = str2double(A{3});
t3 = str2double(A{4});

% Extracting the lines which have esclamation mark
fgetl(f1);
fgetl(f1);
fgetl(f1);

% Extracting the species block

 for i = 1:53
     g = fgetl(f1);
 B = strsplit(g,' ' );
 q = strfind(g,'.');


    low_temp = str2double(g(q(1)-4:q(1)+3));
    high_temp = str2double(g(q(2)-4:q(2)+3));
    mid_temp = str2double(g(q(3)-4:q(3)+3));
      species_name = char(B{1});
    % Extracting constants of species of first line
    tline_1=fgetl(f1);

    a = strfind(tline_1,'E');
    a1 = tline_1(1:a(1)+3);
    a1 = str2double(a1);
    a2 = tline_1(a(1)+4:a(2)+3);
    a2 = str2double(a2);
    a3 = tline_1(a(2)+4:a(3)+3);
    a3 = str2double(a3);
    a4 = tline_1(a(3)+4:a(4)+3);
    a4 = str2double(a4);
     a5 = tline_1(a(4)+4:a(5)+3);
    a5 = str2double(a5);

    % Extracting constants of second line
    tline_2 = fgetl(f1);
    b = strfind(tline_2,'E');
    a6 = tline_2(1:b(1)+3);
    a6 = str2double(a6);
    a7 = str2double(tline_2(b(1)+4:b(2)+3));
    a8 = str2double(tline_2(b(2)+4:b(3)+3));
    a9 = str2double(tline_2(b(3)+4:b(4)+3));
    a10 = str2double(tline_2(b(4)+4:b(5)+3));

    % Extracting constants of Third line
    tline_3 = fgetl(f1);
    c = strfind(tline_3,'E');
    a11 = str2double(tline_3(1:c(1)+3));
    a12 = str2double(tline_3(c(1)+4:c(2)+3));
    a13 = str2double(tline_3(c(2)+4:c(3)+3));
    a14 = str2double(tline_3(c(3)+4:c(4)+3));


    % creating the temperature array
    T = linspace(low_temp,high_temp,500);
    R = 8.314;

% specific heat calculation function
    c_p = specific_heat(a1,a2,a3,a4,a5,a6,a7,a8,a9,a10,a11,a12,a13,a14,low_temp,mid_temp,high_temp,T,R);

    % Enthalpy calculation function
    h = enthalpy(a1,a2,a3,a4,a5,a6,a7,a8,a9,a10,a11,a12,a13,a14,low_temp,mid_temp,high_temp,T,R);

    % Entropy calculation function
    s = entropy(a1,a2,a3,a4,a5,a6,a7,a8,a9,a10,a11,a12,a13,a14,low_temp,mid_temp,high_temp,T,R);

    %creating a directory for the plots

t = sprintf('%s',species_name);
    mkdir(t);
    cd(t)

  % plotting Temperature vs specific heat
    figure(1)
    plot(T,c_p)
    title(species_name)
    xlabel('Temperature');
    ylabel('Specific heat');
    saveas(gcf,'CP.png');

    % Plotting Temperature vs Enthalpy
    figure(2)
    plot(T,h)
    title(species_name)
    xlabel('Temperature');
    ylabel('Enthalpy');
    saveas(gcf,'H.png');


    % Plotting Temperature vs Entropy
    figure(3)
    plot(T,s)
    title(species_name)
    xlabel('Temperature');
    ylabel('Entropy');
    saveas(gcf,'S.png');

    cd ..


     % for calculating molecular weight
M = Molecular_weight(species_name);
k = sprintf('%s mol_wt=%f',species_name,M);
disp(k)


 end
In the above program, the clear all command will delete the data from the previously performed operation, close all command will close all the graphs or scope related to the previously performed operation. clc command will clear the command window.
First, I have written the code to read the header data. For getting the data 'fopen' command and that command opens the file with the type of access specified by permission. under which I have to specify the file name and type of the file and because I want to read the data I have used the 'r' and suppose if I want to write something in a file then I will use the 'w' command.
The command fgetl(f1) is used to get the line or print the line so basically, this command will print the first line of the data. Then again I have used the same command to get the second line of the program so basically the if we keep on writing that command one after the other it will start giving us the lines one by one of the data.
The strsplit (str,delimiter) command splits str at the delimiters specified by delimiter. The third line of data contains the global temperature. the command fgetl will print the line but I want the temperature data so this command will separate each element of the line.
still, the global temperature data are in the string so I have to convert them into numbers so the command 'str2double' is used for that. str2double converts the text in str to double-precision values. str contains text that represents real or complex numeric values. str can be a character vector, a cell array of character vectors, or a string array. If str is a character vector or string scalar, then x is a numeric scalar. If str is a cell array of character vectors or a string array, then x is a numeric array that is the same size as str. so using this I got my global temperature data (low, mid, and high).
Then the next three lines can be neglected in the data because it does not contain any important information regarding my objective but still, I have used the fgetl command three times to get those three lines.
Then I have written the code for extracting the species block and as we know that is a total of 53 species in the data. so I have taken the 'for' loop which will run the program for all species. then to the next line which I termed as g again I have used the fgetl command. That line contains the data of local temperatures (low, mid, and high) and I will be creating the array of this local temperature data. so for that again I have to split into separate elements. The strsplit command will do the job for me as it will split the string data. This line of the data will also give information about the species like for this particular data the first species is monoatomic oxygen(O). so for every line of the data which contains the species name '.' is common so by using strfind I will find the place of that dot(.) And as I already mentioned (g) also contains the temperature data which are in string format so I have to convert them into numbers to find out the parameters. by strfind command, I will find the position of the dot in the line(g) so the position I found was q(1) that is why in line 30 of the program I have used q(1) and -4 I have used for getting the position of 2 in g and then again +3 for getting the low temperature as 200. Then the similar thing I have done for getting the mid and high temperatures as 1000 and 3500 respectively. These temperatures are for monoatomic oxygen only when the value of i will be 2 or when the for loop will run for a second time it will convert the string into numbers of that line to give low, mid, and high temperatures. It may be the same or different depends on the data given.
In the program, I know that command B(1) will give me the species name so I have used that to give the names of all the species present in the data. Then I have written the code for extracting all the constants. so I have to write the code for the first species which is monoatomic oxygen and because I have written it under 'for' loop the 'for' loop will extract the constants for other species. The line tline_1=fgetl(f1) will give the data of constant from a1 to a5. and again just like I have used the strfind to find the position of dot earlier here I have seen that E is common for all the constants so have to find the position of E in line tline_1. so a = strfind(tline_1,'E') will give me the position of E. As I know looking at the file that this line contains only constants so again just as I did for finding the local temperatures here also I have done the same. The command tline_1(12) will give the position of E and the command tline_1(1:12) will give all the left-hand side values of E. One more thing is common in all the constants data and that is after E there 3 digits in every constant. so the command a1 = tline_1(1:a(1)+3) will give the value of the first constant in string format to convert into no=umbers again I have used the str2double command. The command a1 = str2double(a1) will give the value of first constant. now from where the first constant end the second constant will start from that point only. so the command tline_1(a(1)+4) will give the starting of the second constant and the command a2 = tline_1(a(1)+4:a(2)+3) will give the value of the second constant. so the same thing I have done for getting the values of a3, a4, and a5.
Then I have extracted the coefficients from (a6 - a10) following the same commands as I did earlier and converted them to numbers. Here I have used b = strfind(tline_2,'E') to find the position of E in the line tline_2. The command tline_2(12) will give the position E and the command a6 = tline_2(1:b(1)+3) will give the value of a6 in string format a6 = str2double(a6) will give a6 in number. then again form where this constant will end the seventh constant will start from that poison only. so the command a7 = str2double(tline_2(b(1)+4:b(2)+3)) will give the value of seventh constant (a7) and similarly i have written the code to find a8,a9 and a10.
Then I have extracted the coefficients from (a11 - a14) following the same commands as I did earlier and converted them to numbers. Here I have used c = strfind(tline_2,'E') to find the position of E in the line tline_3. The command tline_3(12) will give the position E and the command a11 = str2double(tline_3(1:c(1)+3)) will give the value of a11 in number as I converted in this line only from string to numbers. then again form where this constant will end the twelfth constant will start from that poison only. so the command a12 = str2double(tline_3(c(1)+4:c(2)+3)) will give the value of twelfth constant (a12) and similarly I have written the code to find a13, and a14.
so now I got the values of all the constants from (a1 - a14) and now I have defined the temperature T which is an array. I have used linspace command which will create multiple temperature values ranging from low temperature to high temperature. so in my case, it will create 500 values between low and high temperature. Then I have defined the value of R which is the universal gas constant and we know that the value of R is 8.314 `j/(mol.K)`.
Then I have called the function which i created earlier for calculation of specific heat (cp) so the line
c_p = specific_heat(a1,a2,a3,a4,a5,a6,a7,a8,a9,a10,a11,a12,a13,a14,low_temp,mid_temp,high_temp,T,R) will calculate the specific for each species and as i have all then inputs there won't be any error in calculations.
Then i have called the function which i created earlier for calculation of Enthalpy and Entropy. so the line
h = enthalpy(a1,a2,a3,a4,a5,a6,a7,a8,a9,a10,a11,a12,a13,a14,low_temp,mid_temp,high_temp,T,R) will calculate the enthapy for each species and the line
s = entropy(a1,a2,a3,a4,a5,a6,a7,a8,a9,a10,a11,a12,a13,a14,low_temp,mid_temp,high_temp,T,R) will calculate the entropy for each species with varying temperature.
Then I have written the program for creating the directory to save the plots so for that I have used the 'sprintf' command that format data into string or character vector then I have created the directory of 't' using the 'mkdir' so this command will make separate folders for all species plots. the cd command is used to change the directory so this command will change the current folder to a new folder. The cd command is used here because I want to plot the graphs in different folders for each species.
Then I have written the codes to plot the graphs. so figure(1) will be for temperature vs specific heat plot and the title of the plot will be the species name for all the plots and I have also given the x and y label so the x-axis represents the temperature and the y-axis represents the specific heat values. Then to save the plots I have as an image I have used the save as command.
Then, in the same manner, I have written the codes for plotting the temperature vs enthalpy so this will be a figure(2) and the x and y-axis will represent temperature and enthalpy values respectively. Then again to save the plot as an image I have used the save as command.
Then again for plotting the third and final graph I have used the 'plot' function which will plot temperature vs entropy. The axis and y-axis will represent temperature and entropy values respectively. Then again to save the plot as an image I have used the save as command. The command 'cd .. ' is for ending the cd (change directory).
Then I have called the function for calculation of the molecular weight of species. so I created the molecular weight function program separately and its shown below:
% For molecular weight calculation
function [Mol_wt] = Molecular_weight(species_name)
Atomic_mass = [1.008,12.0110,14.007,15.999,39.948];
Elements = ['H','C','N','O','A'];

Mol_wt = 0;
for i = 1 : length(species_name)
    for j = 1 : length(Elements);

    if strcmp(species_name(i),Elements(j))
        Mol_wt = Mol_wt + Atomic_mass(j);
        p = j;
        end
end
    n = str2double(species_name(i));
  if  (n>1)
        Mol_wt = Mol_wt + (Atomic_mass(p))*(n-1);
  end
end
end
In the program, I have used the function command which will create a template for calculating the molecular weight. so the name of the function is Molecular_weight which I will write to call the program and the inputs to this function will be species name.
Then in the data, all the species are formed by combining the elements (H, C, O, N, A) means every species is a combination of one or more elements from the elements(H, C, O, N, A) that is why I have considered this 5 elements only. Then I know the atomic masses of these elements so I have written that. Then I have used the 'for' loop for the length of species and elements. Here when the for loop (i) will only change when the inner loop (j) is completed to its length. And here you can see that initially Mol_wt = 0 is taken that is because when the function will calculate the molecular weight of the second species then it has to start from 0 and not take the previously calculated value of molecular weight.
Then I have used the conditional statement 'if' and applied the conditions. The command strcmp is used to compare the strings so when the strings of (i)and (j) will be the same then only this condition will run and will end otherwise. Then I have written the equation for calculating the molecular weight. The variable p is used to save the recent value of j for which the molecular weight is calculated. still, the molecular weight is not entirely calculated and I have to again apply some conditions to get the complete value. so for that, I have used the variable n to define the number in species (for example in ch2 n will be 2). and again a conditional statement is applied that if n>1 then only the program will run the next line which is the modified formulae for calculating the molecular weight. Then I have simply ended the conditional statements, 'for' loop and the function.
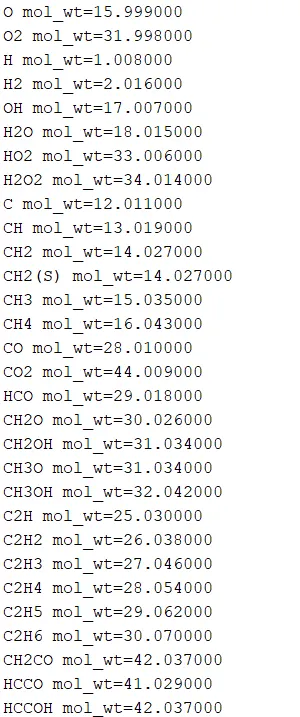
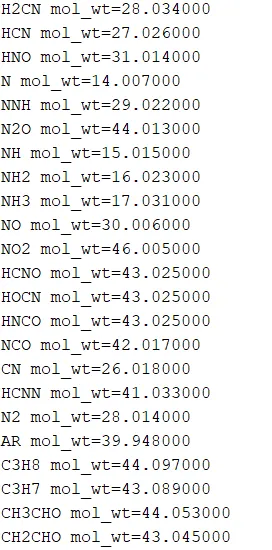
Now going back to the main program the 'sprintf' will again format data into string or character vector and %f is used to add the floating-point number. so the variable I have used for that is K and at last, I have used disp(k) which will display the species name and the molecular weight in the command window. Then finally I have ended the 'for' loop. so now the program is completed and it's time for outputs.
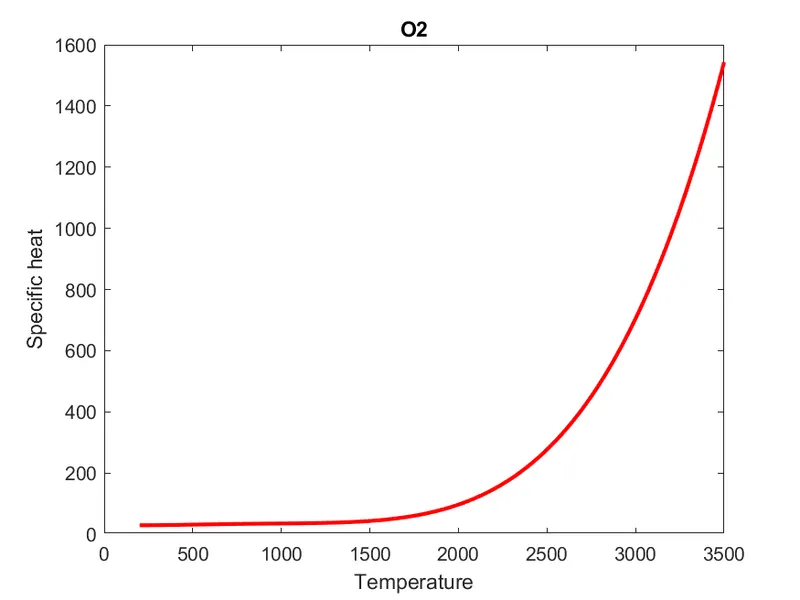
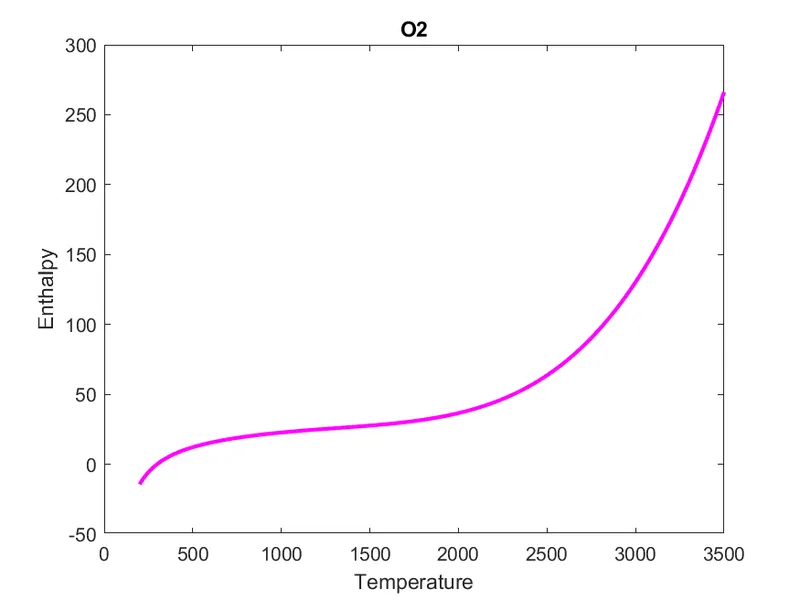
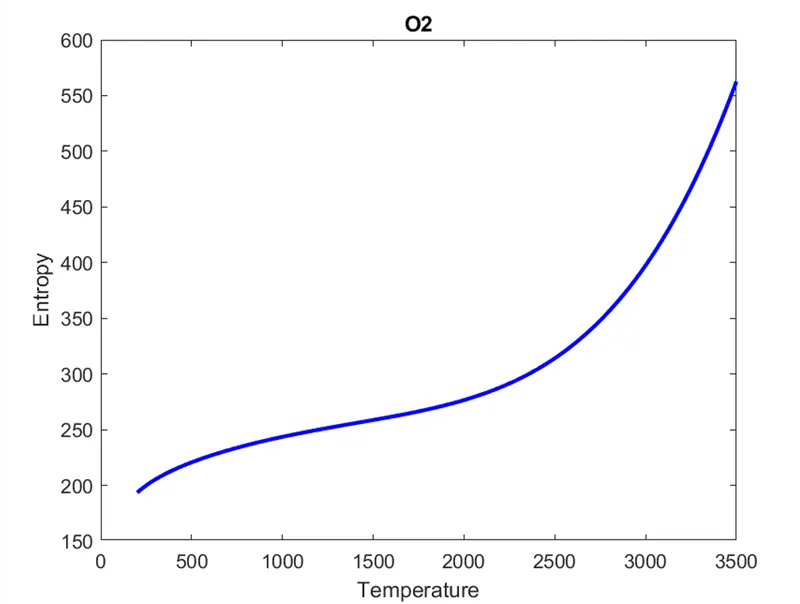
RESULT - The output plots for species o2 is shown below:
The Temperature vs Specific heat plot is shown below:
The Temperature vs Enthalpy plot is shown below:
The Temperature vs Entropy plot is shown below:
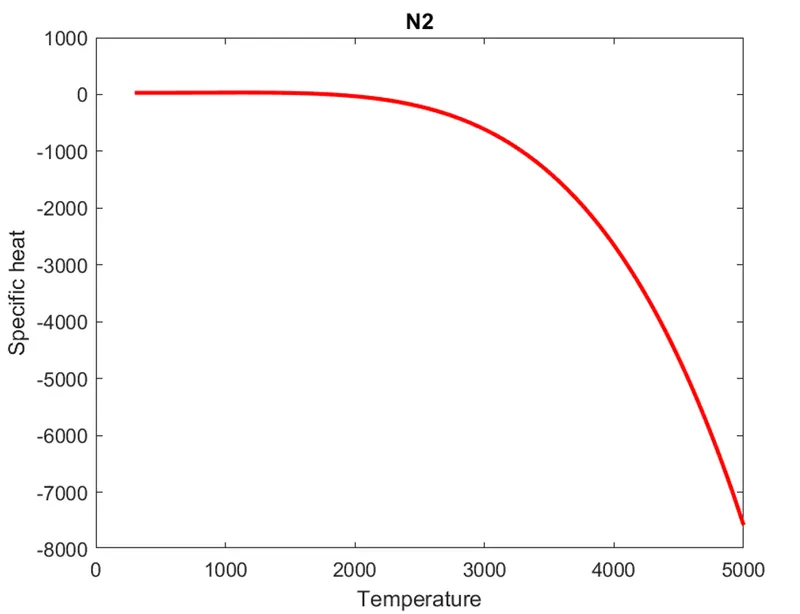
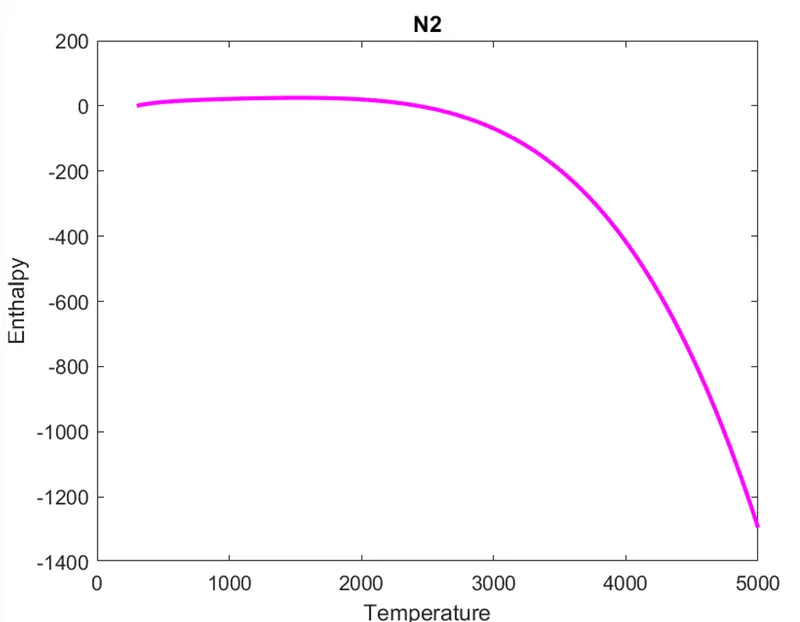
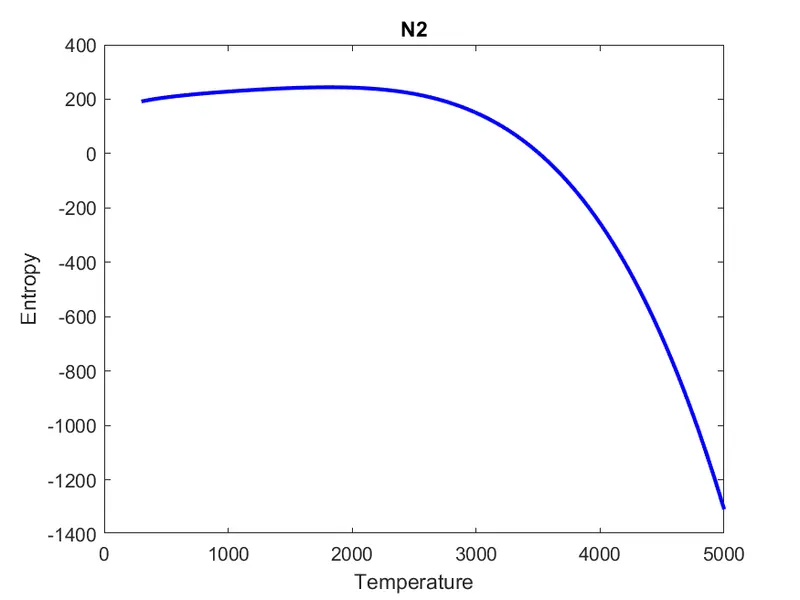
The output plots for species N2 is shown below:
The Temperature vs Specific heat plot is shown below:
The Temperature vs Enthalpy plot is shown below:
The Temperature vs Entropy plot is shown below:
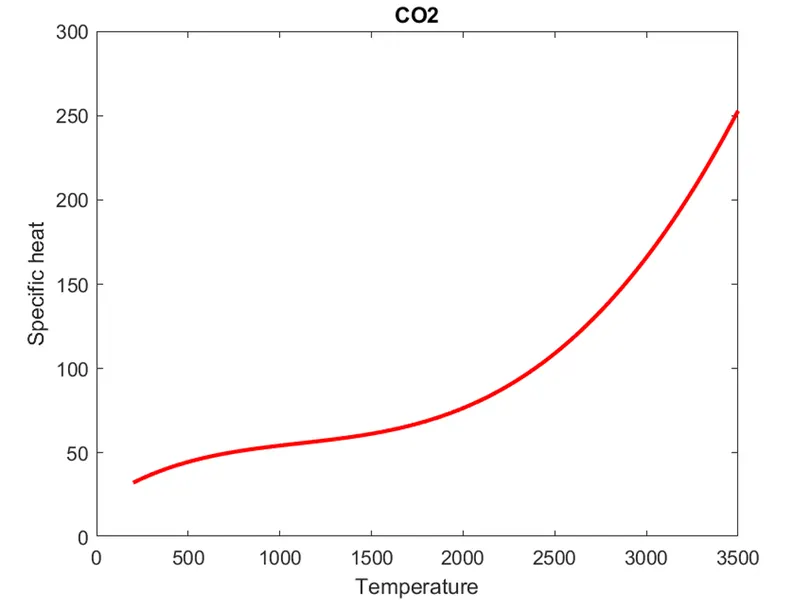
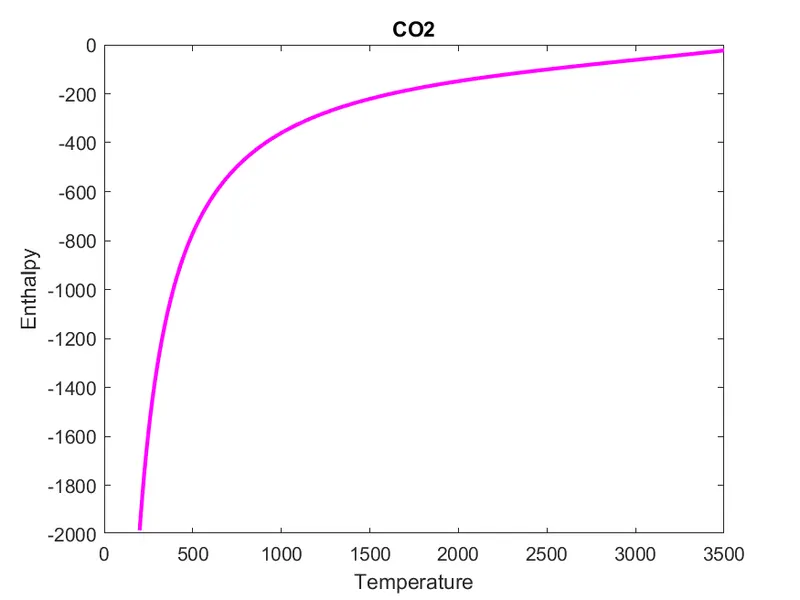
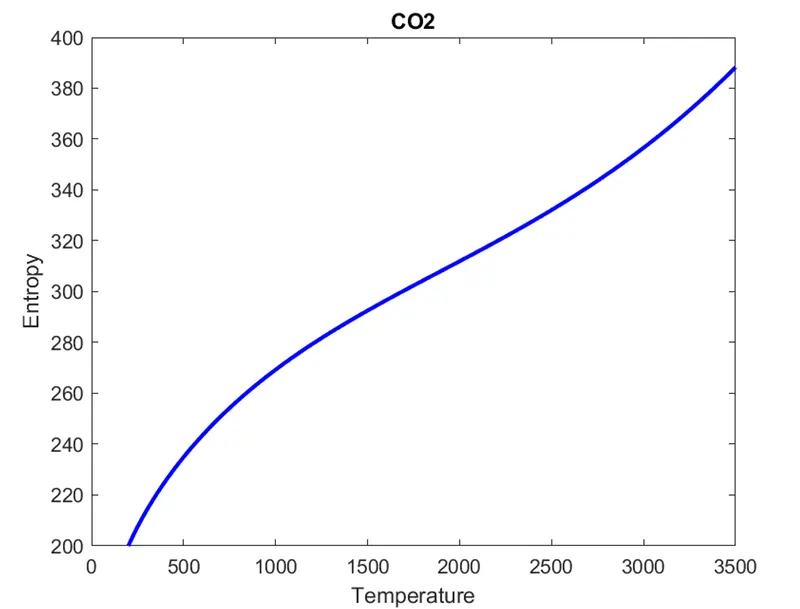
The output plots for species co2 is shown below:
The Temperature vs Specific heat plot is shown below:
The Temperature vs Enthalpy plot is shown below:
The Temperature vs Entropy plot is shown below:
The screenshot of the folders in which all the plots are saved for each species is shown below:

The molecular weight of every species is shown below:
CONCLUSION - The program to parse the NASA Thermodynamic data using Matlab in order to extract the coefficients and calculate and plot the Specific heat, Enthalpy, and Entropy of different species with varying temperatures is completed, and also the molecular weight of each and every species is calculated and shown.