Project 1 - Parsing NASA thermodynamic data
1. Aim:
- To conduct the file parsing for the recorded data by NASA which consists of co-efficients that are used to calculate Specific Heat, Entropy and Enthalpy.
- In the main script, encorporate commands that create and save a seperate directory that stores all the plots in sub-folders with folder title as the specific element/ compound name.
2. Description:
File Parsing could also be called as file processing where meaningful information or important data is extracted out of a file which is not in an easily accessable form for the user. Here the data is extracted and converted to be further modified or plotted.
In the given problem, we are presented with a .dat file that consists useful co-efficients for various elements/ compounds along with their local temperatures that would be useful to calculate the specific heat, enthalpy and entropy of the elements/ compounds. Our main objective is to extract this data calculate these values and later visualize this data against local temperature ranges for ease of understanding.
The data is to be computed using the following mathematical relation:
`=> C_p/R=a_1+a_2*T+a_3*T^2+a_4*T^3+a_5*T^4;`
`=>H/(R*T)=a_1+a_2*T/2+a_3*T^2/3+a_4*T^3/4+a_5*T^4/5+(a_6)/T;`
`=>S/R= a_1*log(T)+a_2*T+a_3*T^2/2+a_4*T^3/3+a_5*T^4/4+a_7;`
Where, `C_p` is Specific heat at constant pressure, `S` is Entropy, `H` is Enthalpy, `a_1,a_2,...a_7` are the co-efficients, `R=8.314` which is the universal gas constant and lastly, `T` is the local temperature for that specific element/ compound.
3. Code:
This part will be further divided into sub-sections which whill consist of four-functions and the main body.
The data file that is given consists of values of co-efficients that were recorded for the respective elements corresponding to a low temperature range and a high temperature range which is provided on the first line of each element. The functions will account for these changes with respect to the temperature ranges in the values of co-efficients.
3.1 Auxiliary Code: Function for Entropy [S]
function [S]=entropy(a1,a2,a3,a4,a5,a7,b1,b2,...
    b3,b4,b5,b7,T,R,LMT)
% All the 'a' values represent high and 'b' values represent low
if T>=LMT
    S=(a1*log(T)+a2.*T+a3.*T.^2/2+a4.*T.^3/3+a5.*T.^4/4+a7)*R; % HIGH
else
    S=(b1*log(T)+b2.*T+b3.*T.^2/2+b4.*T.^3/3+b5.*T.^4/4+b7)*R; % LOW
end
end
3.2 Auxiliary Code: Function for Enthalpy [H]
function [H]= enthalpy(a1,a2,a3,a4,a5,a6,b1,b2,b3,...
    b4,b5,b6,T,R,LMT)
% All the 'a' values represent high and 'b' values represent low
if T>=LMT
    H=(a1+a2.*T/2+a3.*T.^2/3+a4.*T.^3/4+a5.*T.^4/5+a6./T).*T*R; % HIGH
else
    H=(b1+b2.*T/2+b3.*T.^2/3+b4.*T.^3/4+b5.*T.^4/5+b6./T).*T*R; % LOW
end
end
3.3 Auxiliary Code: Function for Specific Heat [Cp]
function [Cp]=sp_heat(a1,a2,a3,a4,a5,...
    b1,b2,b3,b4,b5,R,T,LMT)
% All the 'a' values represent high and 'b' values represent low
if T>=LMT
    Cp=(a1+a2.*T+a3.*T.^2+a4.*T.^3+a5.*T.^4).*R; % HIGH
else
    Cp=(b1+b2.*T+b3.*T.^2+b4.*T.^3+b5.*T.^4).*R; % LOW
end
end
3.4 Auxiliary Code: Function to calculate Molecular Mass [MM]
function [MM]=molecularwt(Specie)
Elements=['H','C','N','O','A'];
Masses=[1,12,14,16,40];
MM=0;
for i=1:length(Specie)
    for j=1:length(Elements)
        if strcmp(Specie(i),Elements(j))
           MM=MM+Masses(j);
           n=j;
        end
    end
    k=str2num(Specie(i));
    if k>1
        MM=MM+Masses(n)*(k-1);
    end
end
end
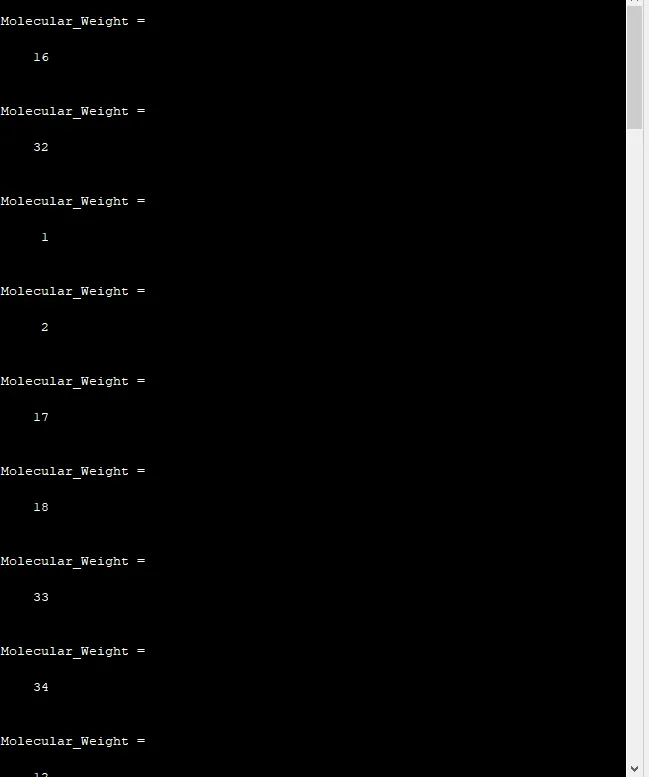
In the above code, there are two vectors 'Elements' and 'Masses' which are indexed in the two for-loops. The fundamental idea is to assign each element a molecular mass for all the 53 instances in the main script. Here, i,j,k & n are indexing variables and the secons if-statement counts the repeatibility of each element. Example- 'CH2CHO' consists 1-O, 2-C & 3-H and thus the individual 'Masses' value needs to increment by that much.
3.5 Main Script: This script is responsible for converting and extracting valuable information from the given data set. The function calls and plots are generated within this script itself and a dedicated folder is created as well for the results to be stored.
Note: For a better understanding, refer to the discriptive comments (starting with %). Also, %% starts the heading for a better understanding of the current task.
%% Project-1: NASA File Parsing

clear
close all
clc

% Assigning File handle
f1=fopen('THERMO.dat','r');

% Constant(s)
R=8.314;

% Main Body:
fgetl(f1); % Skipping heading

tline=fgetl(f1);
tvect=str2num(tline);
GLtemp=tvect(1);
GMtemp=tvect(2);
GHtemp=tvect(3);


for i=1:3
    skip=fgetl(f1); % Skipping 3 comment lines
end

%% Fetching Species+Calculating Cp\S\H and Molecular Weight
for i=1:53
    L0=fgetl(f1);
    y=strsplit(L0,' ');
    Specie=y{1};
    L1=fgetl(f1);
    M1=strfind(L1,'E');
    z=length(y);
    LLT=str2num(y{z-3});
    LMT=str2num(y{z-1});
    LHT=str2num(y{z-2});
    T=linspace(LLT,LHT,100);

    % High-temperature values
    a1=str2num(L1(1:M1(1)+3));
    a2=str2num(L1(M1(1)+4:M1(2)+3));
    a3=str2num(L1(M1(2)+4:M1(3)+3));
    a4=str2num(L1(M1(3)+4:M1(4)+3));
    a5=str2num(L1(M1(4)+4:M1(5)+3));
    L2=fgetl(f1);
    M2=strfind(L2,'E');
    a6=str2num(L2(1:M2(1)+3));
    a7=str2num(L2(M2(1)+4:M2(2)+3));

    % Low-temperature values
    b1=str2num(L2(M2(2)+4:M2(3)+3));
    b2=str2num(L2(M2(3)+4:M2(4)+3));
    b3=str2num(L2(M2(4)+4:M2(5)+3));
    L3=fgetl(f1);
    M3=strfind(L3,'E');
    b4=str2num(L3(1:M3(1)+3));
    b5=str2num(L3(M3(1)+4:M3(2)+3));
    b6=str2num(L3(M3(2)+4:M3(3)+3));
    b7=str2num(L3(M3(3)+4:M3(4)+3));

    % Calculating Cp\S\H and molecular wt. for every element/compound
    Cp=sp_heat(a1,a2,a3,a4,a5,...
    b1,b2,b3,b4,b5,R,T,LMT);
    S=entropy(a1,a2,a3,a4,a5,a7,b1,b2,...
    b3,b4,b5,b7,T,R,LMT);
    H=enthalpy(a1,a2,a3,a4,a5,a6,b1,b2,b3,...
    b4,b5,b6,T,R,LMT);
    Molecular_Weight=molecularwt(Specie) % Display in Command Window
    %% Plotting Results and Saving into folders
    % Temp vs Entropy
    mkdir(['F:\Misc Files\MATLAB Skill Lync\Week 3\Project 7 NASA File Parsing\NASA Thermo Data\Functions+Files\',Specie])
    cd(['F:\Misc Files\MATLAB Skill Lync\Week 3\Project 7 NASA File Parsing\NASA Thermo Data\Functions+Files\',Specie])
    figure(1)
    plot(T,S,'r','Linewi',2)
    title(['Temperature vs Entropy for: ',Specie])
    xlabel('Temperature')
    ylabel('Entropy')
    saveas(figure(1),'S.png')
    % Temp vs Enthalpy
    figure(2)
    plot(T,H,'b','Linewi',2)
    title(['Temperature vs Enthalpy for: ',Specie])
    xlabel('Temperature')
    ylabel('Enthalpy')
    saveas(figure(2),'H.png')
    % Temp vs Specific Heat
    figure(3)
    plot(T,S,'k','Linewi',2)
    title(['Temperature vs Specific Heat for: ',Specie])
    xlabel('Temperature')
    ylabel('Specific Heat')
    saveas(figure(3),'Cp.png')
    cd ..
end
%% Script End
3.5.1 Script Description:
- The script starts off by clearing closing the matlab workspace, command window and figure windows. Upon which, the file is read onto a file handle 'f1'. This is what would be used to call or refer to the data file throughout the entire script.
- We define the value of the constat R which would be later used at the time of function calls.
- The command 'fgetl' is used to read the line and the number of read lines depends on the number of 'fgetl' used. In other words, this command is sequential.
- the command 'str2num' converts a string of numbers to actual numbers upon which mathematical operations can be performed.
- Next we skip three other comment lines and move onto the main body and now get to the 0th line of the data where Specie name and temperature ranges are present.
- The command 'strsplit' is used to split the given string by pinpointing the addressed character and in our case, that character is a space.
- We assign the first character of every 4- lines as the Specie name as seen from the data manually. The specie name is present on the 0th line on each step.
- We now move on to detecting the character of exponent 'E' in every subsequent line as this is what would help us find all the five numbers that are present in all the lines and we assign that to M1:3 for each line.
- next we locate the local temperature ranges, we use simple line indexing to achieve this and assign the values to a vector 'T' which we'll later use in the functions.
- The first seven co-efficients represented by 'a' are for the high temperature range and the second seven represented by 'b' are for low temperature ranges.
- The line 'a1=str2num(L1(1:M1(1)+3));' indexes under L1 from 1st character to M1(1)="E" and increments that by 3 incasing the complete first co-efficient and this same process is used to incase al the co-efficients.
- These same steps are taken for the other three lines and the complete procedure is repeated for 53 steps as the data consists 53 samples.
- Next we move on to calculating the Entropy, Enthalpy and Specific heat in co-herence to the relative species, for that reason, these function calls have also been encased within the first for-loop.
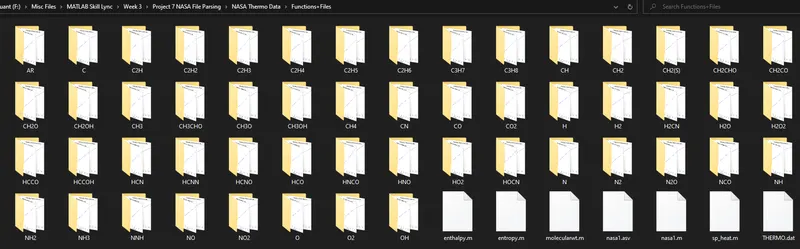
- Now a directory within which the results will be saved is created using 'mkdir' and this directory will be created for every loop step we then change directory to the newly-created directory in order to save the results within this new folder which has the same name as the Specie.
- Next, we plot the results of the three functions against the local temperature range with different colors and individually save these three figures within each folder using 'saveas' command.
- In the end, we use 'cd ..' to jump out of the new directory in order to make a next directory in the next step of the loop.
4. Results and Figures:
4.1 Plots for O2,N2 and CO2:
4.1.1 Plots for O2:
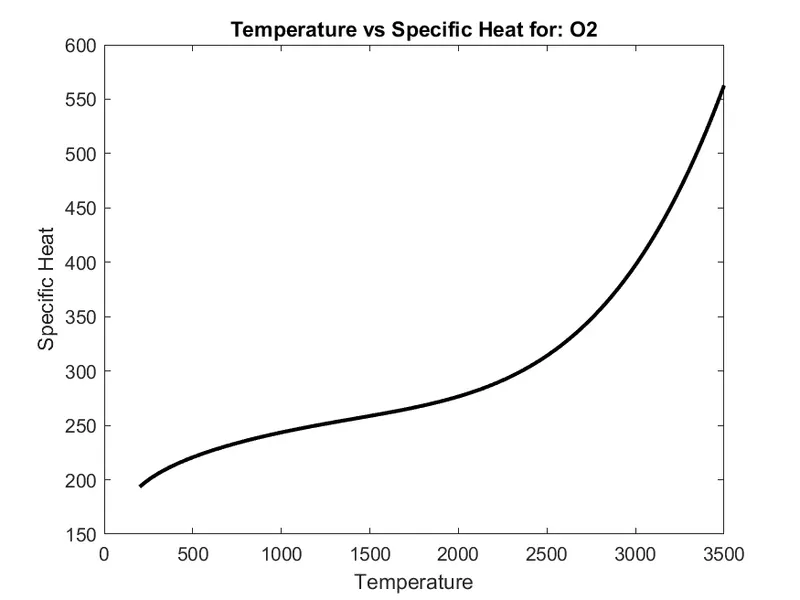
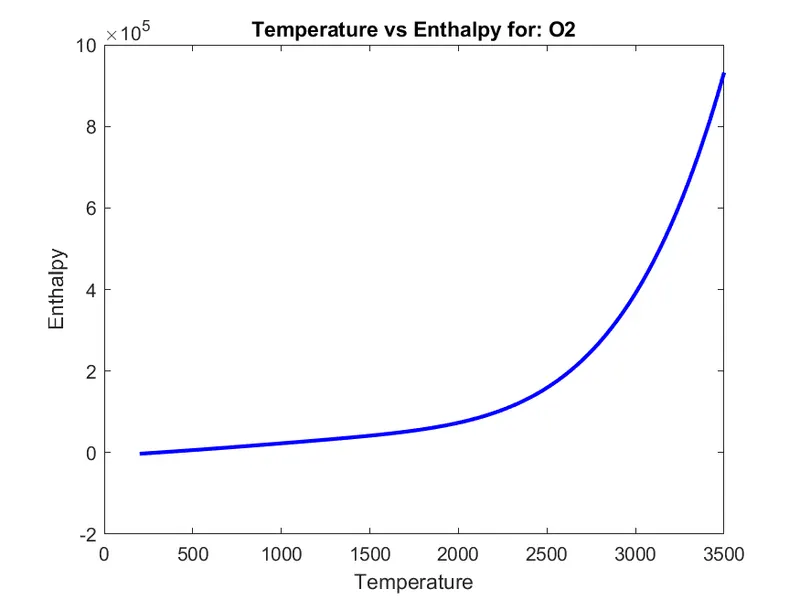
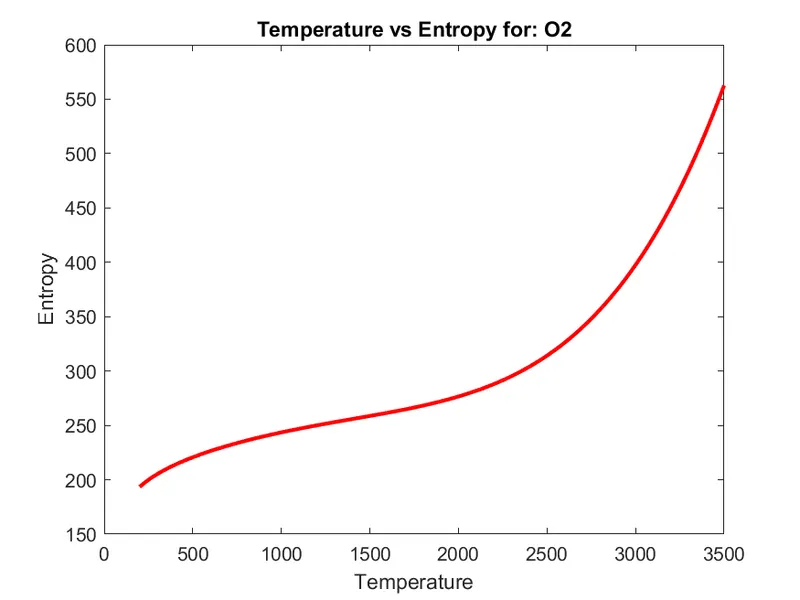
4.1.2 Plots for N2:
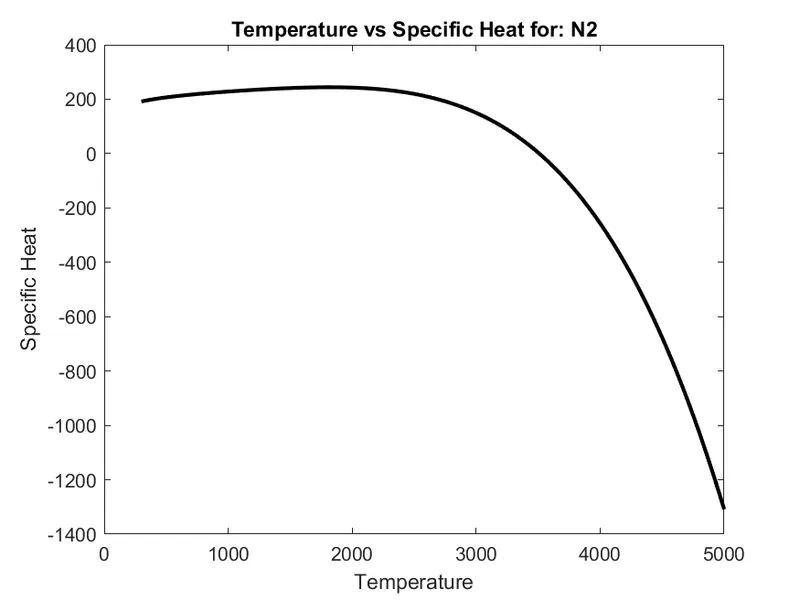
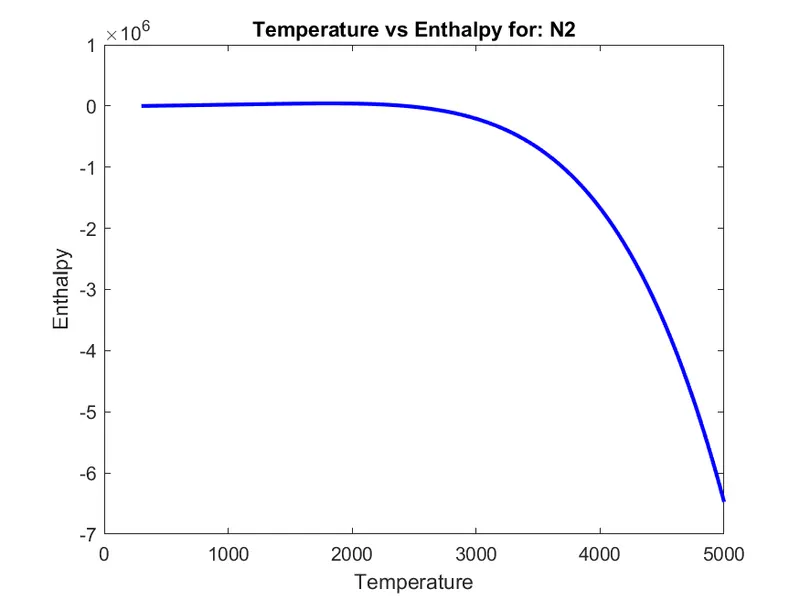
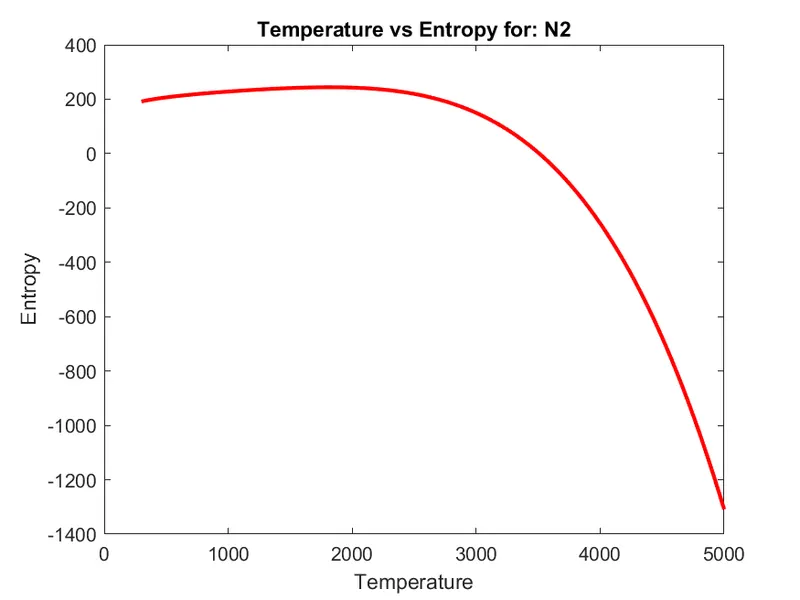
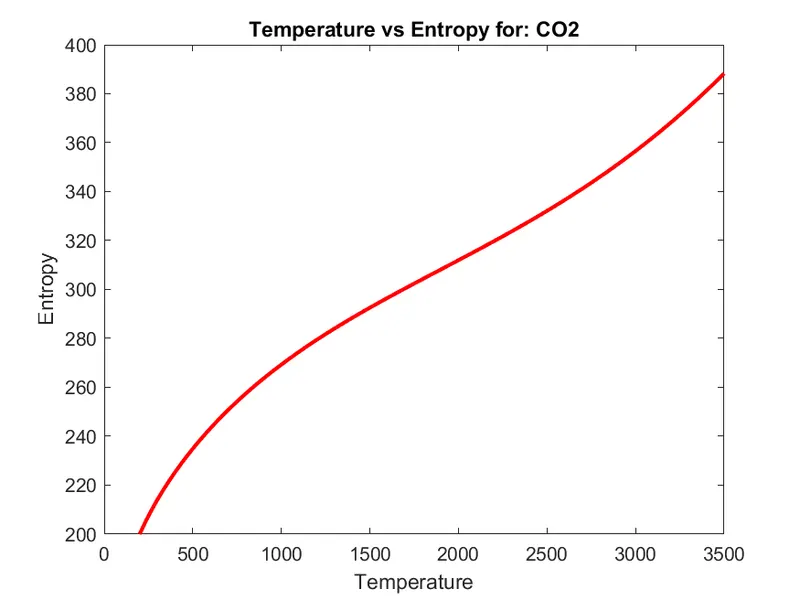
4.1.3 Graphs for Co2:
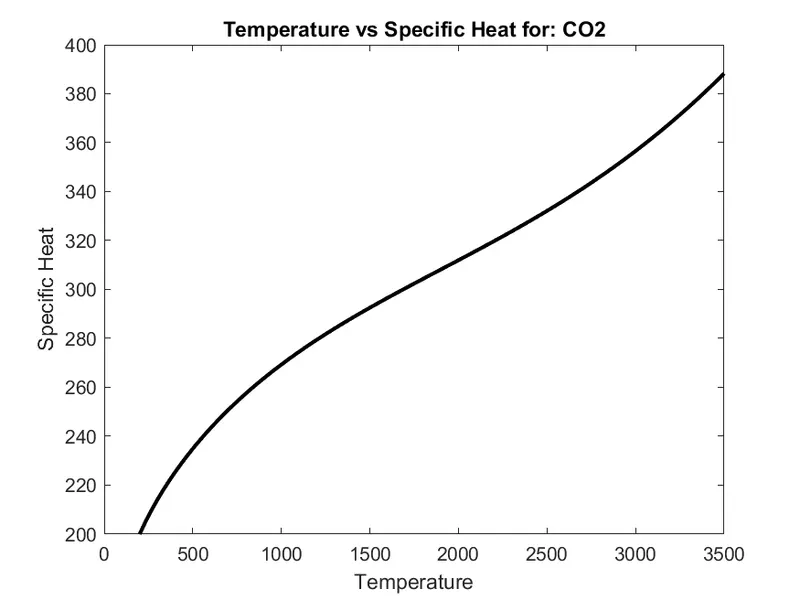
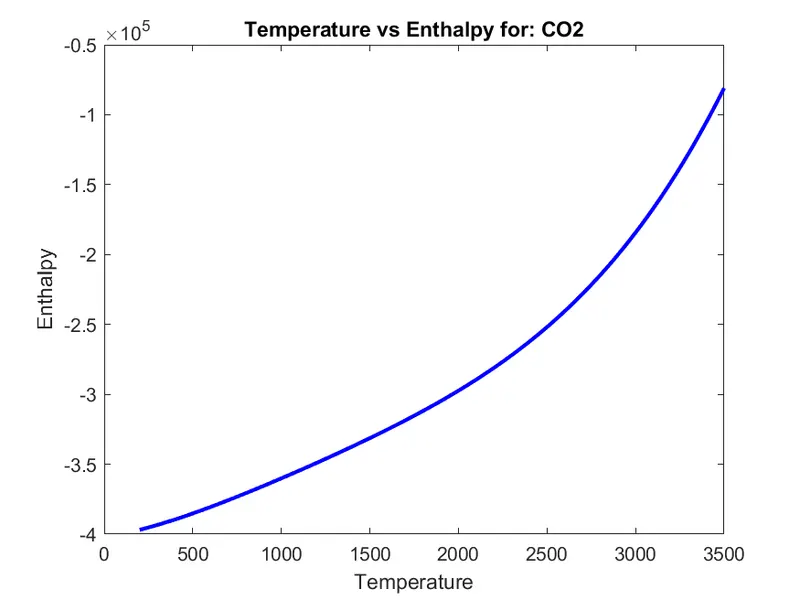
4.2 Molecular Masses on Command Window(Sequential):
4.3 Screenshot of folders:
5. Sources:
- Matlab Documentation
- Atomic Masses of different elements (rounded off)